
An Empirical Analysis of Selected Macroeconomic Indicators and Agricultural Value Added in Nigeria
- Aniefiok Benedict Udo
- Ime Okon Utuk
- Boniface Linus Akpan
- Enobong Akpan Ekaetor
- Ededet Bassey Eduno
- 1374-1383
- Feb 8, 2024
- Agriculture
An Empirical Analysis of Selected Macroeconomic Indicators and Agricultural Value Added in Nigeria
Ime Okon Utuk1, Aniefiok Benedict Udo*2, Boniface Linus Akpan3, Enobong Akpan Ekaetor4, Ededet Bassey Eduno5
1,3,4,5Department of Economics, Akwa Ibom State University-Nigeria
2Department of Economics, Topfaith University, Mkpatak-Nigeria
*Corresponding Author
DOI: https://dx.doi.org/10.47772/IJRISS.2024.801101
Received: 14 December 2023; Revised: 23 December 2023; Accepted: 27 December 2023; Published: 08 February 2024
ABSTRACT
This study seeks to establish the relationship between agriculture value added and some selected macroeconomic factors in Nigeria from 2000-2022. Augmented Dickey Fuller unit root tests, co-integration test with Auto regressive Distributed Lag Bound test, Auto regressive Distributed Lag-Error Correction Model analysis were carried out on the data for the variable. The results revealed that GDP per capita (LNGDPC) (proxy for market size) has negative affect on agriculture value added while exchange rate (LNREXR), foreign direct investment (LNFDI) (proxy for technology), and index of human capital per person (LNIHC) (proxy for labour) exhibit positive impact on agriculture value added in Nigeria in the long run. As such, Nigerian government should promote policies (security issues) that are directed at attracting more foreign direct investment inflow to the agricultural sector so as to boost technology and agriculture value added. Similarly, it is critical to invest in human capital through training and education, given that agricultural technology is rapidly evolving. Lastly, through fiscal and monetary policies management, it is also vital for Nigerian government to increase agriculture value added by controlling inflation and building a stable exchange rate that will enhance foreign exchange earnings, encourage flexibility and competitiveness of farmer.
Keywords: agriculture value added, exchange rate, GDP per capita, foreign direct investment, index of human capital per person, inflation rate, gross capital formation, Nigeria.
INTRODUCTION
Agricultural sector plays a strategic role in the process of economic development of a country. It has already made a significant contribution to the economic prosperity of advanced countries and its role in the economic development of less developed countries is of vital importance. In other words, where per capita real income is low, emphasis is being laid on agriculture and other primary industries. However, the idea behind value addition is basically to increase the economic value of primary agricultural commodities. There’s more to be gained in adding value to agricultural commodities than merely exporting in their primary state.
Agriculture contributes about 21% to the GDP of Nigeria and it’s a vibrant non-oil magnet for foreign exchange. The sector represents a veritable low hanging fruit for the diversification and development of the economy. The country is an important exporter of agricultural commodities like sesame, ginger, cocoa which rakes in billions of Naira annually to the economy. Nigeria’s top 10 agricultural export is estimated to have earned the country about N289.3 billion in one year (April 2019- march 2020) (The Nation, 2020). Sesame seed and cocoa dominated the export with the two commodities constituting about 60% of the entire products. However, the exports of these commodities undergo minimal or zero value addition processes. Value added agriculture enables farmers to align with consumer preferences with quality characteristics not found in conventional raw material products, and Agriculture value added could be under serious threat under poor governance situation and insecurity (Anwana, Aniefiok & Samuel 2019). Therefore, this study aims at empirically investigating the effect of some selected macroeconomic factors on agriculture value added in Nigeria, given that Nigeria and by extension Africa is losing substantially due to the failure in adding value to their produce. Several studies have been conducted concerning factors that influence agricultural output in Nigeria in Ahangar et al. (2013); Obilor (2013); Udah and Nwachukwu (2015); Adeyemo (2015); Awe (2013); Mu’azu and Lawal (2017); Mekwe, Bosco and Obayori (2018). For Utuk, Boniface, Ededet & Aniefiok (2023) agricultural raw materials exports has a positive effect on real gross domestic product while agriculture value added exhibited a negative relationship with real gross domestic product. However, this shows that there is still a literature gap on agriculture in Nigeria that needs to be filled. The study is organized into four segments: introduction, methodology, results and discussion, and summary, conclusion and suggestion.
METHODOLOGY
Model Specification
To study the impact of macroeconomic factors on agriculture value added in Nigeria, following
Mu’azu and Lawal (2017) which found that sustained growth in agricultural output is possible through capital accumulation, thus this study envisaged that agriculture value added in Nigeria is influenced by certain macroeconomic factors in an agricultural production model including exchange rates, inflation rate, foreign direct investment (FDI) inflows, market size, capital accumulation and labour force.
Thus the model for this study is specified below:
Definitional form as; AGVAL = f (REXR, INFR, TECH, MKT, IHC, K) . . . (1)
The econometric form as: LNAGVALt = Ҧ0 + Ҧ1NREXRt + Ҧ2LNINFRt + Ҧ3LNTECHt + Ҧ4LNMKTt + Ҧ5LNIHCt + Ҧ6LNKt + ֆt . . . (2)
where, AGVAL is agriculture value added (% of GDP). Value added in agriculture measures the output of the agricultural sector less the value of intermediate inputs. Other variables were included to control for economic factors which could affect agricultural value added: real exchange rate (REXR); inflation rate (INFR); TECH is technology (it is measured in foreign direct investment (FDI)); MKT is market size (it is measured in GDP per capita (GDPC). This shows the purchasing power; index of human capital per person (IHC) was included as a proxy for labour because human capital, or an individual’s collective skill-set and knowledge to create economic value, plays a fundamental role in economic growth and is a keystone to development. Index of human capital per person was based on years of schooling and returns to education; K is gross capital formation (K (₦’b)) as a proxy for domestic capital; t = time/period; Ҧ0 = constant intercept; Ҧ1 – Ҧ6 = slope of coefficients of the explanatory variables that are captured in the model; and ֆ = stochastic disturbance term. A priori Expectation; Ҧ1 > 0, Ҧ2 > 0 Ҧ3, Ҧ4 > 0 , Ҧ5 > 0,and Ҧ6 > 0.
Data Source
The type of data necessary for this study is secondary data due to the fact that the research work is analytical in nature. Time series data relating to the dependent and independent variables were employed for a period covering 2000 and 2022 due to the availability of data. The data used in this study were sourced from World Development Indicators, theglobaleconomy.com, indexmundi.com, tradingeconomics.com, countryeconomy.com, worlddata.info, fred.stlouisfed.org, and Statistical Bulletin and Annual Report and Statement of Accounts published by the Central Bank of Nigeria (CBN).
Method of Data Analysis
Firstly, unit root test is carried out in order to determine whether the selected variables in the study are stationary or non-stationary. This is as a result of most time series data being non-stationary which can most likely give misleading results. This study deployed Augmented Dicky-Fuller (ADF) unit root test and the model for ADF is specified in the general form as:
![]()
Where: y = time series, t = linear time trend, Δ = first difference operator, α0 = constant term and U = random error term.
Hereafter, the co-integration test was carried out to determine whether there exists a long run equilibrium relationship amongst the selected variables in the study under the Auto-regressive Distributed Lag (ARDL) framework. The ARDL model provides two bounds of critical values; one is when the variables are purely I(0), and the other is when the variables are purely I(1). Therefore, ARDL model avoids the shortcomings arising from the classification of variables according to their order of integration as 1(0) or I (1). In another word, the ARDL model is possible to apply whether the series is purely I(0) or purely I(1) or combination of both. Furthermore, the ARDL model was used to explore short-run dynamics along with the long-run relationship among the variable in the study. Finally, some series of diagnostic tests were deployed to ensure the goodness of fit of the model: residual and stability tests.
RESULTS AND DISCUSSION
Unit Root Test
Time series data were used in this study. Generally, time series data show trending behavior (scholastic trend), in other words, there may be a problem of none stationarity. Therefore, it is necessary to remove such trending behavior to obtained valid results. Also, it is a pre-condition to test time series properties to identify whether the variable is stationary at levels, first difference or second difference. These results of unit root test will help to select the appropriate econometric method for the data analysis. This study used Augmented Dicky-Fuller unit root test out of the numbers of unit root tests in econometric literature.
The results of ADF unit root test in Table 1 shows that the logarithms of some variables are non-stationary in their level while some variables became stationary after taking their first difference. In order words, the variables are integrated in a mixed order of I(0) and I(1). The combination of variables which are stationary at level and at first difference gives the reason for the application of Auto-regressive Distributed Lag (ARDL) bounds test for cointegration can be applied.
Table 1: Augmented Dickey Fuller (ADF) Unit Root Results
| Variable | ADF test | Order of Integration | |||
| Levels | 1st difference | ||||
| Intercept | Trend & Intercept | Intercept | Trend & Intercept | ||
| LNAGVAL | -1.912313 | -2.516866 | -3.573747** | — | I(1) |
| LNREXR | -1.876691 | -2.819644 | -5.521139* | — | I(1) |
| LNINFR | -3.466959** | — | — | — | I(0) |
| LNFDI | -3.121809** | — | — | — | I(0) |
| LGGDPC | -2.906720*** | — | — | — | I(0) |
| LNIHC | -2.307898 | -1.023337 | -3.504476** | — | I(0) |
| LNGCF | 1.084953 | -4.319477** | — | — | I(0) |
Note: ADF test was performed using Schwarz information criterion and the automatic lag selection set as 4 lags. Also,*, ** and *** imply statistical significance at 1%, 5% and 10% levels respectively.
Source: Author’s computation using Eviews 10
ARDL Bounds Test (Cointegration Test)
In carrying out the ARDL bounds testing, due to the sample size, the study chose a maximum lag length of 1 for the dependent variable and independent variables. In addition, the specification was with Unrestricted Constant and No Trend, and the model selection criteria was Akaike information criterion. In Table 1, the ADRL bound test reveals that the computed F-statistic (3.818503) is greater than the lower and upper bounds critical values of 2.55 and 3.28, respectively, at the 5 per cent significance level. Thus, indicating that the null hypothesis of non-co-integration is rejected. Consequently, the empirical result confirms the presence of long-term relationship among AGVAL, REXR, INFR, TECH, MKT, IHC, and K. However, at 1 per cent significance level, the test is inconclusive since the F-statistic falls between the bounds.
The next stage of the procedure would be to estimate the coefficients of the long-run relations and short run (as well as the associated error correction model (ECM)) using the ARDL approach.
| Table 2: F-Bounds Test | Null Hypothesis: No levels relationship | |||
| Test Statistic | Value | Signif. | I(0) | I(1) |
| F-statistic | 3.818503 | 10% | 1.99 | 2.94 |
| K | 6 | 5% | 2.27 | 3.28 |
| 2.5% | 2.55 | 3.61 | ||
| 1% | 2.88 | 3.99 | ||
Source: Author’s computation using E views 10
ARDL Estimates
In estimating the specified model using the ARDL approach, it was pertinent to detect the best model. The model selection is based on Akaike info criterion (AIC). The model with the lowest AIC is considered to be the best and the selected model is ARDL (1, 1, 0, 1, 1, 0, 0) with the selected lags out of 64 number of models evaluated. Table 3 presents the long run and short-run coefficients estimated using ARDL approach. The results of the model show that in the long run, real exchange rate (LNREXR), foreign direct investment (LNFDI) (proxy for technology (TECH)),
GDP per capita (LNGDPC) (proxy for market size (MKT)) and index of human capital per person (LNIHC) (proxy for labour) are statistically significant in influencing agriculture value added (LNAGVAL) in Nigeria. However, GDP per capita (LNGDPC) is shown to negatively affect agriculture value added while exchange rate (LNREXR), foreign direct investment (LNFDI), and index of human capital per person (LNIHC) exhibit positive impact on agriculture value added in the long run. In the short-run, current value of real exchange rate (D(LNREXR)), current value of foreign direct investment (D(LNFDI)) showed positive effect on agriculture value added. On the contrary, current value of GDP per capita (D(LNGDPC)) depicted an inverse relationship with agriculture value added in the short-run.
Specifically, the result of the model shows that the coefficient (1.543026) of real exchange rate (LNREXR) has a statistically significant positive effect on agriculture value added (LNAGVAL) in the long-run at 10% level of significance. With a coefficient of 1.543026, it implies that a 1% increase in trade openness will cause agriculture value added to increase by about 1.543026 % in the long run vice versa. But in the short-run the magnitude is slightly low, though it remained statistically significant at 10% significance level. The current value of foreign direct investment (D(LNFDI)) is shown to have a positive impact on agriculture value added at 1% significance level. This positive significant impact is also experienced in the long-run though at 5% significance level and its magnitude of 0.446341 is close to the magnitude expressed in the short-run (0.232492). However, Nnorom (2023) reported that in apparent reflection of the numerous challenges bedeviling the agriculture sector in Nigeria, especially the problem of insecurity, foreign capital inflow into the sector fell by 37.9 percent Year-on-Year (YoY) in the half year ended June 30, 2022 (H1’22). The Vanguard newspaper’s findings from the Foreign Capital Importation report of the National Bureau of Statistics (NBS) for the second quarter to June 2022, shows that foreign capital flow to the sector fell to $59.17 million in H1’22 from $95.1 million in the corresponding period in 2021, representing a 37.9 percent decline within the period (Nnorom, 2023).
As can be seen in Table 3, index of human capital per person (LNIHC) (proxy for labour) variable is positively signed and significant at the 10% significance level, which implies that an increase in human capital per person by 1% will increase agriculture value added by 5.265518% ceteris paribus, only in the long run. This result agrees with Nugroho et al. (2022) findings that human capital index (HCI) has a significant positive effect on agricultural value-added (AVA). Indeed, education is crucial for sustainable agricultural growth because it raises their knowledge, improves their skills and practices, changes their attitudes and encourages farmers to use proper strategies and technologies, such as doing postharvest operations for perishable products and boosting AVA (Ali et al., 2021; Alwedyan and Taani, 2021; Marenya et al., 2021; Zobeidi et al., 2021).
Additionally, Table 3 reveals that inflation rate (LNINFR) is negatively signed and insignificant at any standard significance level. Inflation makes agricultural inputs and outputs increase in price, making products more expensive. As such, agriculture value is shown to declines by 0.114800% for every 1% increase in inflation even though the effect is insignificant. This result is contrary to Nugroho et al. (2022) findings that inflation has a negative significant impact on agriculture value added in MENA region. Also, gross capital formation (LOGGCF) has a positive but insignificant impact on agriculture value added in the long-run but in the short-run it showed a significantly negative relationship with agriculture value added.
From Table 3, the coefficient of the parameter of error correction mechanism (ECM) (-0.674036) has the hypothesized negative sign and is statistically significant at 1% level. This showed that about 67.40 percent disequilibria in agriculture value added in the previous year were corrected for in the current year. It therefore, follows that the ECM could rightly correct any deviations from short run to long-run equilibrium relationship of the dependent and the explanatory variables.
Table 3: ARDL Result
| Long-Run Estimates | ||||
| Variable | Coefficient | Std. Error | t-Statistic | Prob. |
| LNREXR | 1.543026 | 0.844550 | 1.827038 | 0.0949*** |
| LNINFR | -0.114800 | 0.130202 | -0.881709 | 0.3968 |
| LNFDI | 0.446341 | 0.179218 | 2.490497 | 0.0300** |
| LNGDPC | -1.863630 | 0.736931 | -2.528906 | 0.0280** |
| LNIHC | 5.265518 | 2.687607 | 1.959185 | 0.0759*** |
| LNGCF | 0.157554 | 0.241075 | 0.653546 | 0.5268 |
| Short-Run Estimates | ||||
| Variable | Coefficient | Std. Error | t-Statistic | Prob. |
| D(LNREXR) | 0.171361 | 0.090845 | 1.886304 | 0.0859*** |
| D(LNFDI) | 0.232492 | 0.040414 | 5.752748 | 0.0001* |
| D(LNGDPC) | -0.595178 | 0.127231 | -4.677927 | 0.0007* |
| ECM(-1) | -0.674036 | 0.095335 | -7.070196 | 0.0000* |
Note: *, ** and *** imply statistical significance at 1%, 5% and 10% levels respectively.
Source: Author’s computation using E views 10
Diagnostic Test
To ensure the goodness of fit of the model, residual and stability tests were conducted. Starting with residual test, in Table 4, the Correlograms Q-Statistics was deployed to conduct the residual test for serial correlation. The result in Table 4 shows that the Q-statistics are insignificant all the way down to 12 lags as depicted by their probability value, indicating that there is no presence of serial correlation. Similarly, this was confirmed in Table 6 by the Breusch–Godfrey test F-statistic (1.327434) with Prob. F(2,9) of 0.3125 which is insignificant, thus the hypothesis of no serial correlation is rejected. But the Obs*R-squared (5.011391) with Prob. Chi-Square (2) (0.0816) shows weak significance, indicating some presence of serial correlation.
As depicted in the Breusch Pagan test for heteroskedasticity in Table 6, the F-statistic (0.858557) has an observed probability value (0.5912) that is greater than 0.05. Also, the Obs*R-squared (9.643964) probability value of 0.4723 is greater than the significance level of 5% . This means that the residual of the model is free from heteroskedasticity problem. More so, this is confirmed by the Harvey heteroskedasticity test in Table 6. Furthermore, the diagnostic test shows that there is no autoregressive conditional heteroskedasticity (ARCH) in the residuals of the model because the Q-statistics is not significant at all lags as shown by the probability values of the correlograms of the squared residuals in Table 5. Additionally, the Jarque-Bera test statistic in Table 6 with F-statistic of 1.597555 indicates that the residual of the model is normally distributed since the probability value of 0.449879 is greater than the significance level of 5% i.e., 0.449879 > 0.05.
The stability test was conducted for the model by employing the cumulative sum of recursive residuals (CUSUM) and the cumulative sum of squares of recursive residuals (CUSUMSQ) suggested by Brown et al. (1975). The CUSUM and CUSUMSQ statistics are updated recursively and plotted against the break points. If the plots of the CUSUM and CUSUMSQ statistics stay within the critical bonds of a 5 percent level of significance, the null hypothesis of all coefficients in the given regression is stable and cannot be rejected. Figures 1 and 2 plot the results for CUSUM and CUSUMSQ tests. The results indicate the absence of any instability of the coefficients because the plot of the CUSUM and CUSUMSQ statistic fall inside the critical bands of the 5% confidence interval of parameter stability.
Table 4: Correlograms Q-Statistics
| Auto correlation | Partial Correlation | AC | PAC | Q-Stat | Prob* | |
| . *| . | | . *| . | | 1 | -0.158 | -0.158 | 0.6279 | 0.428 |
| .**| . | | .**| . | | 2 | -0.251 | -0.283 | 2.2896 | 0.318 |
| . *| . | | .**| . | | 3 | -0.101 | -0.219 | 2.5731 | 0.462 |
| .**| . | | ***| . | | 4 | -0.249 | -0.460 | 4.3928 | 0.355 |
| . |* . | | .**| . | | 5 | 0.120 | -0.264 | 4.8393 | 0.436 |
| . |**. | | . | . | | 6 | 0.330 | 0.030 | 8.4378 | 0.208 |
| . | . | | . | . | | 7 | -0.004 | -0.007 | 8.4382 | 0.296 |
| . *| . | | . | . | | 8 | -0.075 | 0.009 | 8.6495 | 0.373 |
| . *| . | | . *| . | | 9 | -0.188 | -0.110 | 10.078 | 0.344 |
| . | . | | . |* . | | 10 | 0.007 | 0.094 | 10.080 | 0.434 |
| . *| . | | ***| . | | 11 | -0.173 | -0.369 | 11.522 | 0.401 |
| . |**. | | . *| . | | 12 | 0.216 | -0.144 | 13.974 | 0.302 |
Source: Author’s computation using E views 10
Table 5: Correlograms of Squared Residuals
| Auto correlation | Partial Correlation | AC | PAC | Q-Stat | Prob* | |
| . *| . | | . *| . | | 1 | -0.094 | -0.094 | 0.2219 | 0.638 |
| . | . | | . | . | | 2 | -0.009 | -0.018 | 0.2239 | 0.894 |
| . *| . | | . *| . | | 3 | -0.076 | -0.079 | 0.3829 | 0.944 |
| . | . | | . | . | | 4 | -0.033 | -0.049 | 0.4154 | 0.981 |
| . | . | | . | . | | 5 | -0.035 | -0.047 | 0.4544 | 0.994 |
| . |**. | | . |**. | | 6 | 0.267 | 0.256 | 2.7986 | 0.834 |
| . | . | | . |* . | | 7 | 0.043 | 0.093 | 2.8637 | 0.897 |
| . *| . | | . *| . | | 8 | -0.108 | -0.103 | 3.3076 | 0.914 |
| . | . | | . |* . | | 9 | 0.062 | 0.083 | 3.4652 | 0.943 |
| . *| . | | . | . | | 10 | -0.084 | -0.046 | 3.7766 | 0.957 |
| . | . | | . | . | | 11 | -0.037 | -0.050 | 3.8405 | 0.974 |
| . | . | | . *| . | | 12 | -0.047 | -0.132 | 3.9575 | 0.984 |
Source: Author’s computation using E views 10
Table 6: Other Residual Tests
| Breusch-Godfrey Serial Correlation LM Test: | F-statistic | 1.327434 | Prob. F (2,9) | 0.3125 |
| Obs*R-squared | 5.011391 | Prob. Chi-Square (2) | 0.0816 | |
| Heteroskedasticity Test: Breusch-Pagan-Godfrey | F-statistic | 0.858557 | Prob. F(10,11) | 0.5912 |
| Obs*R-squared | 9.643964 | Prob. Chi-Square (10) | 0.4723 | |
| Heteroskedasticity Test: Harvey | F-statistic | 1.137951 | Prob. F(10,11) | 0.4152 |
| Obs*R-squared | 11.18654 | Prob. Chi-Square (10) | 0.3432 | |
| Jarque-Bera | F-statistic | 1.597555 | Prob. | 0.449879 |
Source: Author’s computation using E views 10
Figure 1: CUSUM Test
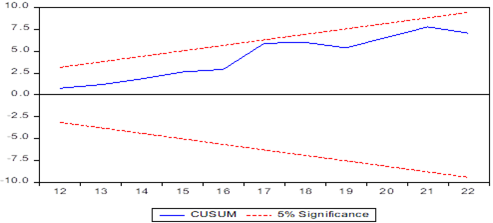
Source: Extracted from E views 10
Figure 2: CUSUM of Squares Test
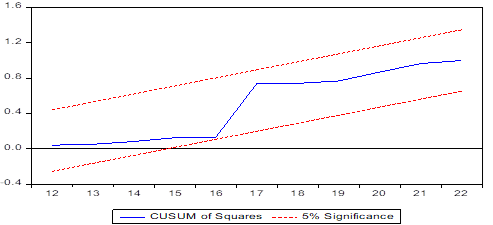
Source: Extracted from E views
SUMMARY, CONCLUSION AND SUGGESTION
This study seeks to establish the relationship between agriculture value added and some selected macroeconomic factors in Nigeria from 2000-2022 using the ARDL approach. The results of the model shows that in the long run, real exchange rate (LNREXR), foreign direct investment (LNFDI)
(Proxy for technology (TECH)), GDP per capita (LNGDPC) (proxy for market size (MKT)) and index of human capital per person (LNIHC) (proxy for labour) are statistically significant in influencing agriculture value added (LNAGVAL) in Nigeria. However, GDP per capita (LNGDPC) is shown to negatively affect agriculture value added while exchange rate (LNREXR), foreign direct investment (LNFDI), and index of human capital per person (LNIHC) exhibit positive impact on agriculture value added in the long run. In the short-run, current value of real exchange rate (D(LNREXR)), current value of foreign direct investment (D(LNFDI)) showed positive effect on agriculture value added. On the contrary, current value of GDP per capita (D(LNGDPC)) displayed an inverse relationship with agriculture value added in the short-run.
Additionally, Table 3 reveals that inflation rate (LNINFR) is negatively signed and insignificant at any standard significance level. Also, gross capital formation (LOGGCF) has a positive but insignificant impact on agriculture value added in the long-run but in the short-run it showed a significantly negative relationship with agriculture value added. Nevertheless, agriculture is a sector of prime importance in every economy. Its economic contributions flow from being a source of livelihood to the majority of workers to serving as a primary source for food and nutrition. Agricultural activity of producing primary commodities is becoming extremely difficult for realizing a decent standard of living beyond subsistence level in this recent global economy. Nigeria must devise policies and actions to increase productivity and export in agriculture sector. As such adding value to agriculture should be the policy direction and focus of the government. In this regard, Nigerian government should promote policies (security issues) that are directed at attracting more foreign direct investment inflow to the agricultural sector so as to boost technology and agriculture value added. Similarly, it is critical to invest in human capital through training and education, given that agricultural technology is rapidly evolving. Invariably, research and development is also necessary to increase agriculture value added. Lastly, through fiscal and monetary policies management, it is also vital for Nigerian government to increase agriculture value added by controlling inflation and building a stable exchange rate that will enhance foreign exchange earnings, encourage flexibility and competitiveness of farmer.
REFERENCES
- Adeyemo, A.O. (2015). Analyses of the Determinants of Palm Oil Production in Nigeria (1971-2010). Greener Journal of Agricultural Sciences, 5 (4), 110-117.
- Ahangar, G.B., Ganie A.H and M. J. Padder (2013). A Study on Institutional Credit to Agriculture Sector in India. International Journal of Current Research and Academic Review, 1(4), 72-80.
- Ali, A., Xia, C., Mahmood, I., and Faisal, M. (2021). Economic and Environmental Consequences of Postharvest Loss Across Food Supply Chain in the Developing Countries. J. Clean. Prod. 323(1), 129146. doi: 10.1016/j.jclepro.2021.129146
- Alwedyan, S., and Taani, A. (2021). Adoption of Sustainable Agriculture Practices by Citrus Farmers and its Determinants in the Jordan Valley: The Case of Northern Ghor. Potravinarstvo Slovak J. Food Sci. 15(1), 768–775. doi: 10.5219/1676
- Anwana, E. O., Udo, A. B., & Affia, S. E. (2019). Agricultural Value Added, Governance and Insecurity in Nigeria: An Empirical Analysis. Asian Business Research Journal, 4, 1–9. https://doi.org/10.20448/journal.518.2019.41.1.9
- Awe, A.A. (2013). Mobilization of Domestic Financial Resources for Agricultural Productivity in Nigeria. Australian Journal of Business and Management Research, 2 (12), 321-340.
- Brown, R.L., Durbin, J., and Evans, J. (1975).Techniques for Testing the Constancy of Regression Relationships over Time. Journal of the Royal Statistical Society Series B, 37, 149-192.
- Marenya, P. P., Usman, M. A., and Rahut, D. B. (2021). Community-Embedded Experiential Learning and Adoption of Conservation Farming Practices in Eastern and Southern Africa. Environ. Dev. 40, 100672. doi: 10.1016/j.envdev.2021.100672
- Mekwe, S. O. P., Bosco,I. E., and Obayori, J. B. (2018).Determinants of Agricultural Output in Nigeria. International Journal of Science and Management Studies (IJSMS), 1(4), 65- 73.
- Mu’azu, A.U., and Lawal, M. (2017).The Impact of Agricultural Financing on Agricultural Output in Nigeria: An Empirical Analysis. Journal of Agriculture and Environment, 13(1), 13-26
- Nnorom, N. (2023).Foreign investment in agric sector down 37.9% to $59.2m. https://www.vanguardngr.com/2023/01/foreign-investment-in-agric-sector-down-37-9-to-59-2m/
- Nugroho, A.D., Istvan, F., Fekete-Farkas, M., and Lakner, Z. (2022). How to improve Agricultural Value-Added in the MENA Region? Implementation of Diamond Porter’s theory in agriculture. https://www.frontiersin.org/articles/10.3389/fsufs.2022.956701/full
- Obilor, S.I (2013). The impact of Commercial Banks’ Credit to Agriculture on Agricultural Development in Nigeria: An Econometric Analysis. International Journal of Business, Humanities and Technology, 3(1), 85–95.
- Udah, S.C., and Nwachukwu, I.N. (2015). Determinants of Agricultural GDP Growth in Nigeria. International Journal of Agricultural Research and Review, 3(3), 184-190.
- Utuk, I. O., Akpan, B. L., Eduno, E. B. & Udo, A. B. (2023) Agricultural Export and Economic Growth in Nigeria: Does Agriculture Value Added Matter? International Journal of Research and Innovation in Social Science Vol. VII Issue XI pp 880-892
- Zobeidi, T., Yazdanpanah, M., Komendantova, N., Sieber, S., and Löhr, K. (2021). Factors affecting Smallholder Farmers’ Technical and Non-Technical Adaptation Responses to Drought in Iran. J. Environ. Manag. 298, 113552. doi: 10.1016/j.jenvman.2021.113552