
Conservation Agriculture Input Costs on Livelihood Outcomes of Farmers in Makueni and Machakos Counties
- Justin M. Kyalo
- Maurice M. Sakwa
- David J. Ndegwah
- 408-423
- Apr 30, 2023
- Agriculture
Conservation Agriculture Input Costs on Livelihood Outcomes of Farmers in Makueni and Machakos Counties
1*Justin M. Kyalo, 2**Maurice M. Sakwa & 3**David J. Ndegwah
1,2Jomo Kenyatta University of Agriculture and Technology 3Jaramogi Oginga Odinga University of Science and Technology
DOI: https://doi.org/10.47772/IJRISS.2023.7431
Received: 11 March 2023; Revised: 25 March 2023; Accepted: 29 March 2023; Published: 30 April 2023
ABSTRACT
There is need to facilitate the growth and productivity of agriculture to reduce poverty and since most poor people are concentrated in rural areas especially in sub-Saharan Africa. This can be achieved by promoting conservation agriculture which has been proven to increase productivity while conserving the environment at the same time in other parts of the world. With limited evidence on the impact of conservation agriculture on livelihood outcomes in Kenya, the current study sought to investigate the effect of input costs of conservation agriculture on livelihood outcomes of smallholder farmers in Makueni and Machakos Counties. The study employed cross-sectional survey as a research design. The Cochran formula was used with a 5% level of significance to obtain sample size of 384 respondents. The study relied on stratified random sampling to achieve a high degree of representation from groups with the desired characteristics. Qualitative data was be subjected to content analysis while quantitative data was analyzed using both descriptive and inferential statistics. Findings show that the cost of inputs attributable to conservation agriculture has a positive influence on livelihood outcomes of smallholder farmers in Makueni and Machakos counties. The costs studied included labour requirements, farm equipment and mulching. It was concluded that conservation agriculture reduces input costs which ultimately increases crop yield and hence, better livelihood outcomes. The study recommended that the government at national and county levels should take responsibly in creating awareness on CA practices across the country and provide any necessary support for the farmers to embrace this noble practice.
Keywords: Livelihood outcomes, Conservation agriculture, Input costs, Labour requirements, Mulching, Farm equipment
INTRODUCTION
Background to the Study
Poor agricultural practices are among the key factors contributing to decline in the agricultural production especially in countries like Kenya, where almost 75% of the population rely on agriculture both directly and indirectly (USAID, 2019). In addition, changes in climate have also affected precipitation and temperature patterns resulting to adverse impact on farming in some areas. In order to enhance the productivity of the farm, the government, and non-governmental organizations have promoted Conservation Agriculture (CA) practices through various initiatives. The United Nations Sustainable Development Goal (SDG) Number 2 envisions a free hunger world and for this to be realized, more emphasis has to be put on best agricultural practices such as CA and use of technology in farming.
According to Food and Agricultural Organization (FAO) conservation agriculture website, CA is defined as an approach of resource-saving crop production whose aim is to achieve acceptable profits coupled with high and sustained levels of production while at the same time conserving the environment. From this definition, CA is not an actual technology but a wide array of specific technologies which are based on application of one or more on the key three principles of CA, that is, minimum soil tillage, adequate cover to soil surface completely or continuously and lastly, diversification of crop rotation. What this implies is that, CA systems comprises of individual set of practices which combine in a lucid manner to enable the three principles to be applied simultaneously to realize what is termed as, full conservation agriculture.
Smallholder farmers in sub-Saharan Africa have practiced conventional farming for several years. This type of farming comprises one or a mixture of activities including harrowing, plowing, and hoeing. These practices are normally associated with soil disturbances leading to erosion and sedimentation of streams and waterways (Mashingaidze and Mudahara, 2006). However, a study by Chiputwa et al., (2011) found that the general perception of farmers in sub-Saharan Africa is that conventional farming escalates mineralization of soil organic matter, controls weed growth and creates a favorable soil structure for seed bed preparation. According to Knowler and Bradshaw (2007), conventional farming compacts soil, depletes soil organic matter and soil nutrients leading to major soil losses of up to 150 tons annually in Africa. Giller et al., (2009) conducted a study on conservation agriculture and smallholder farming in Africa. They found out that conventional norms of farming are still evident in many communities despite farmers acknowledging that conventional farming aggravates depletion of resources.
Studies conducted by Thierfelder and Wall (2010); Chiputwa et al., (2011); Kassam et al., (2010) have supported CA technologies to address erosion and other problems intensified by conventional farming. According to Friedrich and Kassam (2009) CA has the likelihood to maintain or escalate harvests of grains and legumes as it improves soil quality, reduces soil erosion and decreases production costs in the long-term. Studies from various countries show that despite a huge number of small-scale farmers adopting CA practices, the dissemination of these best management practices appears to be relatively slower among small-scale farmers (Friedrich and Kassam, 2009). CA continues to be advocated across various regions over the world, including sub-Saharan Africa where NGOs and international aid agencies spearhead CA adoption.
Several CA practices have been adopted in both Machakos and Makueni counties. These include, rotational cropping, water harvesting, soil conservation as well us intercropping. These counties are arid and semi-arid and thus, get insufficient rainfall. Several CA practices have been introduced by non-governmental organizations. The most notable programme in Yatta Machakos County is one-acre rule quarter system introduced by Christian Impact Mission. Through this initiative, households are supported to build water pans to preserve rain water for irrigating lands during dry season and also training farmers on various CA practices. As a result of the project, small scale farmers have embraced CA practices and can also produce even during dry season. An assessment of the project ten years since its inception has established that most farmers are food secure, they can also afford to pay school fees and medical service and take care of other necessities (Masika, 2020).
Statement of the Problem
Agricultural sector is the engine for growth and development in Kenya. The sustainability of agricultural growth is therefore critical for hunger and poverty reduction. An estimated 80% of Kenyans live in rural areas where farming is their main source of livelihood (FAO,2018). However, there are long standing challenges facing smallholder farmers in the country such as low productivity, production and low profits for commercial farmers. These have been attributed to conventional forms of agriculture which involve a lot of soil inversion and tillage, limited application of soil cover and crop rotation which is associated with poor soil fertility and land degradation that contribute to low crop productivity and eventually food insecurity. This is further compounded by climate change, variability and drought, as well as the depletion and degradation of natural resources (FAO, 2018).
Studies from other countries reveal that conservation agriculture practices improve the livelihoods of farmers (Nkala et al., 2012; Nkala et al., 2011; Uddin and Dhar, 2016; Fao, 2018). Similar observations have been made in the Kenyan context (Yeray, 2012; Masika, 2020). These studies argue that, conservation agriculture produces higher net returns in the long run compared to conventional tillage. The higher returns are as a result of decreased costs of fuel, machinery and labor. In addition, conservation agriculture leads to increased soil fertility, minimized effects of strong winds, minimized effects of drought, increased crop yields, reduced soil erosion and land degradation, reduced crop production costs. Nevertheless, FAO (2018), Yeray (2012) and Masika (2020) studies have paid little attention on human development dimensions notably health and education in regards to CA farmers. These studies have mainly focused on economic and environmental aspects to show a change in livelihoods of CA farmers. Furthermore, even though the effect of cost of inputs is known, it is not clear on how this affects livelihood outcomes. Therefore, this current study sought to investigate the effect of conservation agriculture input costs on farmer’s livelihood outcomes in Makueni and Machakos Counties, Kenya.
Research Objective
The study sought to assess conservation agriculture input costs on livelihood outcomes of farmers in Makueni and Machakos Counties, Kenya.
Research Hypothesis
H01: There is no significant effect of conservation agriculture input costs on livelihood outcomes of farmers in Makueni and Machakos Counties, Kenya.
LITERATURE REVIEW
Minimum tillage and permanent soil cover principles of conservation agriculture contribute immensely to livelihoods outcomes of farmers. Minimum tillage leads to less inputs being utilized implying that the extra income and labour is then invested in non-farm activities resulting to more incomes for the farm households. Permanent soil cover ensures that not much farming activity goes on in the farm as opposed to conventional agriculture whereby labour and fertilizer will be required for clearing the weeds and enriching the soils for more land productivity.
A study of the impact of CA on farmers’ livelihoods, labour and mechanization in Italy (Friedrich & Kienzle, 2007) found that power and time needs for farm operations associated to crop creation and crop gardening are minimized levelling mainly the traditional labour and power barrier during land preparation. Furthermore, labour requirements for weeding are decreased especially if herbicides are used. According to Vastola et al., (2017); LaCanne and Lundgren (2018) even when yield reductions are observed some instances, CA systems can still be more profitable than conventional agricultural systems due to reduced input costs. Additionally, Kumar et al., (2018) and Devkota et al., (2019) observed that where CA leads to similar or greater yields, profitability is generally improved due to reduced costs of land preparation and labor, and reduced water requirements.
The labour input in the CA system can be minimized by 75% since the time saved allows farmers to dedicate more time to other more profitable non-farm occupations for generating income than growing crops. Availability of extra time provides opportunities to farmers for diversification alternatives. Conservation agriculture provides women with opportunities to engage themselves in other income generating and socioeconomic activities while also sparing more time to take care of the family (IFAD/FAO, 2004and FAO, 2012). Uddin & Dhar (2016) reported that farmers adopting conservation agriculture practice could save more time and money to invest in other income generating activities compared to who are not adopting.
Mariki (2003) asserts that the labour is saved by 54% in the fourth year of implementing no-tillage with cover crops. An IFAD/FAO combined study exploring the prospective of CA as a labour saving exercise revealed that when a jab planter is used compared to hand hoe, labour inputs in conservation agriculture arrangement may be reduced by 75%. Farming without ploughing also alleviates the labour deficiencies that influence smallholder farmers in the sub-Saharan region as a result of rural-urban migration as well as the rapid spread of HIV/AIDS (IFAD/FAO, 2004). Farmer surveys in Pakistan and India reveal that zero-till of wheat after rice reduces costs of production by US$60 per hectare ordinarily due to less fuel (60–80 l haK1) and labour (Hobbs et al., 2007). Mhlanga et al., (2021) conducted a study on the crucial role of mulch to enhance the stability and resilienceof cropping systems in southern Africa. They found out that the use of mulch combined with minimum tillage resulted in significantlylower stability variance on maize grain yield andshoot biomass compared with the other cropping systems hence indicating that mulch promoted an increase in the stability ofproduction.
According to Lange (2005) conservation agriculture results to saving time and labour thus majority of the farms introduce substitute such as fruit and vegetable farming, rearing of small animals, bee-keeping, fish farming and the related activities for value addition. Waweru et al., (2013) in a study on Farmers’ perception of conservation agriculture in Laikipia found that there was labour reduction as a result of CA adoption. Teklewold (2013) reported that in farming, women participate in numerous agricultural tasks including mainly cleaning the field during land preparation, transporting inputs to the field, weeding, harvesting, transporting, threshing and storage of the production. Furthermore, they are also involved in managing home garden crops, poultry raising, feeding, watering and cleaning of livestock and milking. Therefore, women would welcome less work at the field and concentrate on housework and other off-farm activities.
Conceptual Framework
Theoretical Framework
The study was guided by Sustainable Livelihood Approach.
Conceptual Framework
Independent variable Dependent Variable
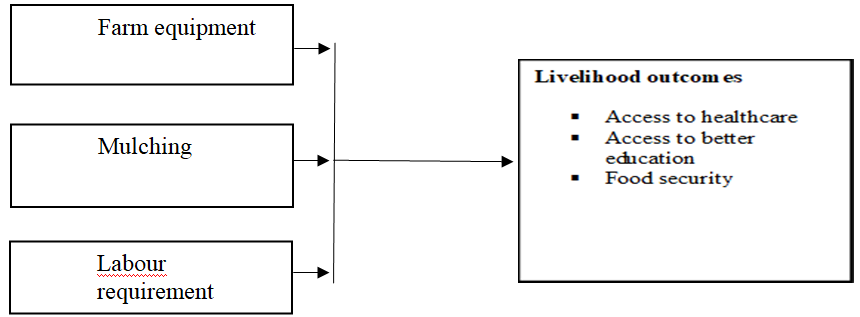
Figure 1: Conceptual Framework
RESEARCH METHODOLOGY
The research design adopted for this study was cross-sectional survey design. The target population for this study was 5091 CA farmers Makueni and Machakos Counties out of which a sample of 384 CA farmers were selected based on the Cochran (1963) formula. Key informants were also selected and they included55 group leaders of farmer group. Stratified sampling was employed to identify the CA farmers by dividing the population into strata or homogenous subgroups and then using systematic sampling to select the nth item by dividing the population in each strata by the sample size. Primary data was collected using face to face questionnaire survey. Piloting of the research instruments was conducted in Machakos county and this was not sampled for the main study. All Likert scale items were reliable since they had coefficients of at least 0.6.Data was analyzed using descriptive and inferential statistics with the help of Statistical Package for Social Sciences.
The study employed descriptive statistics to measure the effects of the inputs associated with conservation agriculture. In this regard, the study measured the mean for access to conservation agriculture farm equipment, cost for labour as a result of applying conservation agriculture and finally the savings accrued from the use of mulching. This study relied on multi regression analysis to examine the effect of independent variables on the dependent variable.
RESULTS AND DISCUSSION
The questionnaire achieved a response rate of 70.29 percent which was considered more than sufficient for data analysis and making inferences regarding the effect of input costs on livelihood outcomes of conservation agriculture farmers in Makueni and Machakos counties. Other participants could not be reached for the entire period of the field work. In addition to questionnaire, 34 out 55 targeted leaders of the groups were interviewed.
Livelihood Outcomes
Table 1: Descriptive Statistics on Livelihood Outcomes (N=269)
| Variable | SA % | A % | N % | D % | SD % | Mean | Std. Deviation |
| Since adopting CA, I have experienced increased food availability | 77.3 | 22.7 | 0.00 | 0.00 | 0.0 | 1.23 | 0.42 |
| Since adopting CA, I have experienced more food varieties | 70.4 | 29.6 | 0.00 | 0.00 | 0.0 | 1.12 | 0.43 |
| Since adopting CA, I have been able to cater for school fees for my children | 77.3 | 22.7 | 0.00 | 0.00 | 0.0 | 1.23 | 0.42 |
| Since adopting CA, I have been able to cater for medical costs for family members | 35.7 | 64.3 | 0.00 | 0.00 | 0.0 | 1.64 | 0.48 |
Mean: Strongly Agreed=1.00-1.80, Agreed=1.81-2.60, Neither Agree nor Disagree=2.61-3.40, Disagree=3.41.4-20, Strongly Disagree=4.21-5.00
Source: Author (2021)
The mean responses ranges between 1.00 to 1.8 which indicates that respondents strongly agreed on all the statements of livelihood outcomes as shown in Table 1 above. These findings are quite similar with Tshuma et al. (2012) in a study on the impact of conservation agriculture on food security and livelihoods where the authors found that conservation agriculture practice extended the range of livelihood on a limited scale through improved yields and income. Furthermore, Masika (2020) in a study on the assessment of CA established that most farmers became food secure, they were also able to afford to pay school fees and medical service and take care of other necessities.
Factor Analysis for Livelihood Outcomes
The study conducted factor analysis of the Likert scale variables with the aim of reducing these variables into a few which retains observed variations from the many variables. In factor analysis, variables with the same characteristics congregate. The reduced variables are used as inputs in the regression and hypothesis analysis. Table 2 below indicates the number of components extracted from a total of four statements. In addition, the table contains eigenvalues, percentage of variance attributable to each component and the total variance of the extracted components.
Table 2: Total Variance Explained on Livelihood Outcomes
| Component | Initial Eigenvalues | Extraction Sums of Squared Loadings | ||||
| Total | % of Variance | Cumulative % | Total | % of Variance | Cumulative % | |
| 1 | 3.220 | 69.027 | 69.027 | 3.220 | 69.027 | 69.027 |
| 2 | 1.032 | 11.471 | 85.600 | 1.032 | 11.471 | 85.600 |
| 3 | .613 | .053 | 99.953 | |||
| 4 | .713 | .047 | 100.000 | |||
Extraction Method: Principal Component Analysis.
Source: Author (2021)
The Principal Component Analysis (PCA) extracted only 2 components where the first component explains 69.03% variance while the second component explains 11.47% of the variance. This brings the total variance explained to 85.6%. The remaining percentage (14.4%) is explained by other variables outside the study. Components 3-4 have eigenvalues of less than 1 meaning that insignificant and hence, discarded in the process.
Table 3 below presents a component (Factor) Matrix which indicates that all the first two statements associated with food availability are substantially loaded to component 1 while the last two variables related to catering for medical costs and school fees are loaded on the second component.
Table 3: Component Matrix on Livelihood Outcomes
| Variables | Component | |
| Availability of food | Catering for education and healthcare | |
| Since adopting CA, I have experienced increased food availability | .988 | .393 |
| Since adopting CA, I have experienced more food varieties | .988 | .070 |
| Since adopting CA, I have been able to cater for school fees for my children | .052 | .988 |
| Since adopting CA, I have been able to cater for medical costs for family members | .123 | .539 |
| Extraction Method: Principal Component Analysis, Rotation Method: Varimax with Kaiser Normalization. | ||
Source: Author (2021)
Table 4 below presents the mean of the extracted component on livelihood outcomes. The findings indicate a mean of 1.221 for availability of food with a standard deviation of 0.30 and 1.30 for catering for social services (such as education and healthcare) with a standard deviation of 0.5. In addition, the statistics on Cronbach Alpha shows that the two extracted components meet the reliability threshold since all the coefficients are 0.7 and above.
Table 4: Descriptive Statistics on Livelihood Outcomes
| Component | Mean | Std. Deviation | Cronbach Alpha |
| Availability of food | 1.22 | .30 | 0.70 |
| Catering foreducation and healthcare | 1.30 | 0.50 | 0.90 |
Mean: Strongly Agreed=1.00-1.80, Agreed=1.81-2.60, Neither Agree nor Disagree=2.61-3.40, Disagree=3.41.4-20, Strongly Disagree=4.21-5.00
Source: Author (2021)
The mean responses of the extracted factors show that study participants strongly agreed to the arguments that CA practices enhances availability of food to farmers as well as catering for social services. These imply that farmers who practice conservation agriculture are likely to reap more from their farms and hence, improve their livelihood outcomes in terms of availability of food and catering for social services like healthcare and education. This is consistent with several other studies. For instance, Uddin and Dhar (2016) conducted a study on CA farmer’s livelihood status in Bangladesh and found that adoption of CA led to a decrease in poverty in terms of deprivation of health, education and living standards. Similarly, Mango et al., (2017) reported that household Food Consumption Scores can be improved indirectly by CA through purchase of other essential food stuffs from income obtained after selling surplus crop outputs.
The findings are also supported by qualitative data as confirmed by an in-depth interview with CA group leaders. 28 leaders out of the 34 who were interviewed argued that farmers who embraced conservation agriculture were more food secure than those who have not. For instance, one participant argued that;
The practice of conservation agriculture has improved food production for some of us. This has in turn ensured that we have more food for our families and can also have surplus to sell to others. (L07)
Input Costs and Livelihood Outcomes
In this sub-section, the study analyses various input costs such as labour, mulching and farm equipment. These are then regressed on livelihood outcome variables. Firstly, descriptive statistics of the input costs are presented followed by factor analysis. To begin with, CA farmers were asked to indicate the cost of both casual and full-time labour force. Table 4.10 below displays summary findings.
Table 4.10: Cost of Labour
| Type of labour/cost | Median cost per season (Kshs) | Cost per day |
| Cost of non-family casuallabour | 6500 | 72.22 |
| Cost of family casuallabour | 2100 | 23.33 |
| Cost of Full-time non-family labour | 15000 | 166.67 |
| Cost of Full-time family labour | 3250 | 36.11 |
Cost per day=median cost per season/90 (90 days in a season)
Source: Author (2021)
In the last 12 months, the median unit cost of non-family casual laborers stood at Kshs. 6500 per season or Kshs. 72.22 per day while that of full-time non-family labourers was Kshs. 15,000 per season or Kshs. 166.67 per day. With regard to unit cost of family labour, the study has established a median value of Kshs. 2100 for casual labour and Kshs. 3250 for full-time family labour per every season. These findings indicate that family labour is much cheaper than non-family labour. This can also be attributed to the fact that most members of the family render their labour on the farm at no cost. In addition, in some cases, family labour is not billed.
The CA farmers were also asked to indicate non-family and family labour force requirement per season. Summary statistics are provided in Table 4.11 below. The median of non-family casual labourers was 3 while that of full-time employees was 1. Indeed, the number of full-time employees is quite low considering that these are small scale farmers and hence, have limited resources to employ many full-time laborers. Statistics show median value of 2 casual family labour force while the median number for full-time family labour force stood at 4 per season. These implies that there are more full-time family labour force than casual. The findings are similar to a study by (Geddes and Scott, 2011) who found out that numerous farms operate on a dual-labour market system, with a small core of permanent staff, magnified by a fluctuating and temporary workforce.
Table 4.11: Labour Force Requirements
| Type of labour | Median labour force per season |
| No of non-family casual labourers | 3 |
| No of family casuallabourers | 2 |
| No of non-family Full-time labourers | 1 |
| No of family full-time labourers (in household/season) | 4 |
When asked about if they had family members providing labour on their farm, all farmers interviewed (269) said yes. On the form of labour provided, majority of the family members (74.3%) were full-time labours. Due to the nature of their small-scale operations, most of these farmers make use of family labour force. When asked about time required to prepare land under CA principle, majority of the farmers (81.1%) argued that it does not require more time to prepare land for CA practice as compared to planting crops not under CA.
The study also analysed use of mulches by farmers. First, respondents were asked to indicate whether they applied mulches as a CA principle and secondly, for those who apply mulches were required to show where they find them. For those who do not apply mulches, they were asked to indicate reasons why. Table 4.11 below presents summary statistics. Findings show that majority of the farmers (77.3%) apply mulching as a CA principle. For those who do not apply mulches, they cited that the process of mulching is time consuming (49.18%) followed by ignorance among them on the perceived benefits of mulching.
Table 4.12: Use of Mulches in CA
| Variable | Frequency | Percentage |
| Do you apply mulches? | ||
| Yes | 208 | 77.3 |
| No | 61 | 22.7 |
| Total | 269 | 100.0 |
| Where do you get mulches? | ||
| From my farm | 179 | 86.06 |
| Neighbor | 20 | 9.62 |
| Others | 9 | 4.32 |
| Total | 208 | 100.0 |
| Reasons for not mulching | ||
| Time consuming | 30 | 49.18 |
| Not aware of the benefits | 20 | 32.79 |
| I don’t know | 11 | 18.03 |
| Total | 61 | 100.0 |
Source: Author (2021)
When asked about where they get mulches, majority of the farmers cited their own farms (86.06%) followed by those who get mulches from their neighboring farms. The implication is that mulches are easily available.
Table 5: Descriptive Statistics on input Cost (N=269)
| Variable | SA % | A % | N % | D % | SD % | Mean | Std. Deviation |
| There is less labour cost for CA crops | 71.7 | 22.7 | 0.00 | 5.6 | 0.00 | 1.39 | 0.76 |
| There is ease of access to labour for CA crops | 71.7 | 28.3 | 0.00 | 0.00 | 0.00 | 1.29 | 0.45 |
| The time saved through use of CA is dedicated to non-farm occupations | 70.02 | 29.98 | 0.00 | 0.00 | 0.00 | 1.29 | 0.45 |
| The use of mulches saves the amount of water used for watering crops | 87.7 | 12.3 | 0.00 | 0.00 | 0.00 | 1.13 | 3.33 |
| The use of mulches saves the time used on the CA farm | 86.6 | 13.4 | 0.00 | 0.00 | 0.00 | 1.13 | 3.34 |
| The use of mulches minimizes the cost incurred in hiring extra labour to work on the CA farm | 81.1 | 11.9 | 0.00 | 0.00 | 0.00 | 1.12 | 3.32 |
| The use of CA farm equipment minimizes the number of times land is prepared; | 66.9 | 33.1 | 0.00 | 0.00 | 0.00 | 1.33 | 0.47 |
| The use of CA farm equipment minimizes the time spent preparing land; | 63.6 | 36.4 | 0.00 | 0.00 | 0.00 | 1.36 | 0.48 |
| The use of CA farm equipment saves on the number of labourers required to prepare land. | 72.1 | 27.9 | 0.00 | 0.00 | 0.00 | 1.28 | 0.45 |
Mean: Strongly Agreed=1.00-1.80, Agreed=1.81-2.60, Neither Agree nor Disagree=2.61-3.40, Disagree=3.41.4-20, Strongly Disagree=4.21-5.00
Source: Author (2021)
The study participants strongly agreed to all the arguments on the input costs such as labour requirement, use of mulches and farm equipment. These findings imply that adoption of CA practices reduces farm input costs which makes farming less costly. For instance, the use of mulches could reduce the amount of labourers on the farm, availability of relevant farm equipment for CA practices is critical towards increasing productivity of the farm. These results tend to be consistent with other studies conducted by Hobbs, (2007); Hobbs et al., (2008) and Wall, (2009) where the authors found that when the three principles of minimum tillage, mulching and crop rotation are adhered to, CA is reported to improve soil quality, optimize crop yields and reduce input costs. Even when yield reductions are observed some instances, CA systems can still be more profitable than conventional agricultural systems due to reduced input costs (Vastola et al., 2017; La Canne and Lundgren, 2018).
Factor Analysis on Input Costs
The study conducted factor analysis for input cost. Table 6 below presents results for variance explained which shows that three components were extracted from the process which had a total of 9 statements. The first component accounts for 19.67% of the total variance while the second component accounts for 16.7% of the variance. The third component accounted for 26.9%.Thus, the three extracted components explain 63.261 % of the variance in the observed variables. The 6-9 components were found not significant and hence, discarded.
Table 6: Explained Variance on Input Costs
| Component | Initial Eigenvalues | Extraction Sums of Squared Loadings | Rotation Sums of Squared Loadings | ||||||
| Total | % of Variance | Cumulative % | Total | % of Variance | Cumulative % | Total | % of Variance | Cumulative % | |
| 1 | 2.973 | 27.031 | 27.031 | 2.973 | 27.031 | 27.031 | 2.164 | 19.673 | 19.673 |
| 2 | 1.548 | 14.074 | 41.105 | 1.548 | 14.074 | 41.105 | 1.836 | 16.689 | 36.363 |
| 3 | 1.434 | 13.036 | 54.141 | 1.434 | 13.036 | 54.141 | 1.769 | 26.899 | 63.261 |
| 4 | .915 | 8.319 | 71.580 | ||||||
| 5 | .765 | 6.958 | 78.538 | ||||||
| 6 | .634 | 5.766 | 84.304 | ||||||
| 7 | .530 | 4.814 | 89.119 | ||||||
| 8 | .451 | 4.104 | 93.222 | ||||||
| 9 | .333 | 3.024 | 100.000 | ||||||
| Extraction Method: Principal Component Analysis. | |||||||||
Source: Author (2021)
Table 7below presents rotated component matrix which shows that the first three statements are substantially loaded on the second component associated with access to labour, the next three variables are loaded on the first component related to use of mulches and the last three variables associated with access to farm equipment are adequately loaded on the third component.
Table 7: Rotated Component Matrix on Input Costs
| Variables | Cost of use of mulches | Access to labour | Access to farm equipment |
| There is less labour cost for CA crops | 0.245 | .758 | 0.245 |
| There is ease of access to labour for CA crops | 0.001 | .660 | 0.109 |
| The time saved through use of CA is dedicated to non-farm occupations | 0.124 | .799 | 0.230 |
| The use of mulches saves the amount of water used for watering crops | .671 | 0.26 | 0.120 |
| The use of mulches saves the time used on the CA farm | .528 | 0.330 | 0.240 |
| The use of mulches minimizes the cost incurred in hiring extra labour to work on the CA farm | .501 | 0.102 | 0.210 |
| The use of CA farm equipment minimizes the number of times land is prepared; | 0.102 | 0.210 | .784 |
| The use of CA farm equipment minimizes the time spent preparing land; | 0.132 | 0.230 | .800 |
| The use of CA farm equipment saves on the number of labourers required to prepare land. | 0.232 | 0.120 | .543 |
Source: Author (2021)
Table 8 below presents descriptive statistics on input costs comprising of the mean and Cronbach Alpha coefficients. The mean statistics indicates that participants strongly agreed on the arguments concerning the cost of labour with a mean of 1.301 with a standard deviation of 0.40. In addition, there was a strong agreement among the farmers on the arguments related to the use of mulches with a mean of 1.312 and standard deviation of 0.46.
Table 8: Descriptive Statistics on Input Costs Components
| Component | Mean | Std. Deviation | Cronbach Alpha |
| Reduced cost of labour | 1.301 | 0.40 | 0.87 |
| Reduced cost of use of mulches | 1.312 | 0.46 | 0.98 |
| Access to farm equipment | 1.22 | 0.20 | 0.71 |
Mean: Strongly Agreed=1.00-1.80, Agreed=1.81-2.60, Neither Agree nor Disagree=2.61-3.40, Disagree=3.41.4-20, Strongly Disagree=4.21-5.00
Source: Author (2021)
The results also reveal that farmers had a strong agreement on the issue of access to farm equipment with a mean of 1.22. Furthermore, all the coefficients of Cronbach Alpha meets the reliability threshold. These findings imply that application of CA practices reduces labour requirements and also minimizes farm equipment needed for farming, and saves on time required to work on the farm. Additionally, the results show that access to mulches saves both cost and time spend on the farm.
From these results, it can be said that mulching reduces the cost of farming which could ultimately lead to higher incomes of the farm. As a result, farmers would be able to access better healthcare and education more easily. These findings are consistent with several others studies. For instance, Farmer surveys in Pakistan and India reveal that zero-till of wheat after rice reduces costs of production by US$60 per hectare ordinarily due to less fuel (60–80 l haK1) and labour (Hobbs et al., 2007). Mhlanga et al., (2021) conducted a study on the crucial role of mulch to enhance the stability and resilienceof cropping systems in southern Africa. They found out that the use of mulch combined with minimum tillage resulted in significantlylower stability variance on maize grain yield andshoot biomass compared with the other cropping systems hence indicating that mulch promoted an increase in the stability ofproduction.
During in-depth interviews, 33 out of 34 group leaders noted that use of mulches is very critical in production. For instance, one group leader in an interview argued that;
Application of mulches preserves water in the soil and therefore, farmers spent little or no time in watering the crops. (L04).
In addition, 32 out of 34 group leaders interviewed were of the view that application of most CA principles reduces the amount of time required to work on the farm. This implies that less labour force is needed to work of CA farms. For example, one leader stated that;
Application of CA practices such mulching minimizes growth of weeds in the farm and as a result, there is less labour force needed during weeding. (L02).
Regression on the Effect of Input costs on Livelihood Outcomes
The study conducted a regression analysis between livelihood outcome variables and the input cost variables. Livelihood outcome variables obtained in the PCA process were regressed on the three independent variables and the results are presented in Table 9 below.
Table 9: Regression Results on the Effect of Input Costs on Livelihood outcome variables
| Independent | Model 1 | Model 2 | ||||||||
| B | Std. Error | Beta | T | Sig. | B | Std. Error | Beta | T | Sig. | |
| (Constant) | -.784 | .239 | -3.28 | .001 | 3.481 | .124 | 28.038 | .000 | ||
| Cost of Labour | 1.081 | .113 | .573 | 9.554 | .000 | .190 | .067 | .137 | 2.836 | .009 |
| Cost of use of Mulches | 1.183 | .217 | .250 | 5.440 | .000 | 1.181 | .200 | .297 | 5.903 | .000 |
| Access to Farm equipment | .992 | .174 | .323 | 5.707 | .000 | 0.24 | .079 | .205 | 3.038 | .000 |
| Dependent | Availability of food | Catering for education and healthcare | ||||||||
| R – squared | 0.036 | 0.626 | ||||||||
| Adj. R squared | 0.029 | 0.6151 | ||||||||
| Std. Error | 1.055 | .761 | ||||||||
| F – ratio (2, 263) | 4.946 | 0.000 | ||||||||
| Prob. > F | 0.008 | 0001 | ||||||||
Source: Author (2021)
The results indicate that the model is statistically significant given the ANOVA (F-statistic) p-value of 0.000. This implies that findings are statistically significant. The R squared value of 0.626 shows that the input cost accounts for 0.626 variation in the farmer’s livelihood outcomes (catering for education and healthcare, and availability of food).
Turning to the estimated coefficients, the study has established a positive and statistically significant influence ofinput costs on the availability of food. This implies that the cost of labour, mulches and access to farm equipment by CA farmers has a positive impact on their farming activities which generate more income that enables the farmers to have an access to food. The increased income can be attributed to reduced amount of time or labour hours spent of the farm/inputs as well as higher farm productivity. Mulches limits the amount of water that evaporates and thus, reducing the crop needs for water. These imply that the plants can flourish even with the little amount of rainfall. This enhances the productivity of the farm which leads to more income to the farmer and hence, better living conditions. Mulching also allows better water and air movement through the soil, some mulches provide nutrients to the soil which ultimately improves production.
The study has also established a positive and statistically significant influence between input costs and catering for education and healthcare. This imply that cost of use of mulches, access to farm equipment and cost of labour by CA farmers is favorable and hence, promotes access to better healthcare and education among. In addition, the results indicate that access to farm equipment increases production of agricultural activities conducted by the CA farmers. Access to relevant farming equipment makes farming easier and more efficient which in turn leads to more production, more income and hence, better livelihood outcomes by the CA farmers. The findings are in line with other studies conducted previously. For example, according to Doets et al., (2000), access to modern farm equipment increases production by about 60% as compared to use of traditional farm equipment. Additionally, Kumar et al., (2018) and Devkota et al., (2019) observed that where CA leads to similar or greater yields, profitability is generally improved due to reduced costs of land preparation and labor, and reduced water requirements.
Hypothesis Testing
The study conducted Hypothesis testing based on regression analysis output. Rejection or acceptance of a hypothesis depends on the p-values. In this study, the null hypothesis was rejected when p <0.05, otherwise accepted. Table 10 shows that the null hypotheses was rejected. This means that there is a significant influence of input costs.
Table 10: Summary of hypothesis testing
| No | Hypothesis | P value | Verdict |
| H01 | There is no significant effect of conservation agriculture input costs on livelihood outcomes of farmers in Makueni and Machakos Counties, Kenya. | 0.000<0.05 | Reject |
SUMMARY, CONCLUSION AND RECOMMENDATION
Summary of the Findings
The study showed that family labour is much cheaper than non-family labour. This was attributed to the fact that most farmers used family labour in their farms as opposed to hired one which would ideally be expensive. Majority of the farmers argued that use of adoption of CA led to reduced labour requirements and also minimized farm equipment needed for farming, and saved on time required for to work on the farm. Furthermore, the results showed that access to mulches saves both cost and time spend on the farm. Leaders during the in-depth interviews argued that application of most CA principles reduced the amount of time required to work on the farm which means less labour force is needed to work of CA farms.
Results for the dependent variable showed that farmers who practice conservation agriculture were likely to reap more from their farms and hence, improved their livelihood outcomes in terms of availability of food and catering for social services like healthcare and education. In-depth interviews with CA group leaders revealed that that farmers who embraced conservation agriculture were more food secure than those who have not.
The regression analysis indicated that the cost of inputs had a positive influence on catering for education and healthcare of CA farmers in Makueni and Machakos counties. This was the case for all the cost of input indicators which included labour, use of mulches and farm equipment. Thus, practices such as mulching, crop rotation, minimum land tillage and intercropping minimizes farm production costs which ultimately leads to more food, income. Increase in the household income arising from more agricultural production enables farmers to take care of their bills such as school fees, electricity, house rent and healthcare. These findings were further complemented by hypothesis test which established a statistically significant effect of input costs on CA farmers livelihood outcomes.
Conclusion
Arising from the summary, several conclusions were made. Firstly, the adoption of conservation agriculture led to reduced labour requirements, minimized farm equipment needed for farming and saved on time required for working on the farm meaning that less labour force is required to work on the CA farms. Additionally, the results indicated that the access to mulches saves both cost and time spend on the farm. Secondly, farmers who embraced conservation agriculture were likely to reap more from their farms and hence improve livelihood outcomes in terms of food availability and catering for social services like healthcare and education. Thirdly, cost of input indicators which included labour, use of mulches and farm equipment minimized farm production costs which eventually resulted to more food and income. Increased household income arising from more agricultural production enabled farmers to take care of their bills such as school fees and healthcare. Therefore, it can be concluded that CA practices enhances crop yields, quality, and hence income as well as livelihood outcomes.
Recommendations
Food security in Kenya has remained a challenge even though majority of the population especially those residing in rural areas depend on the agricultural sector both in terms of food and jobs. This study demonstrated that CA can help to solve some of the challenges experienced by farmers and address food insecurity issues, increase farmers income and ultimately enhance household livelihoods. Thus, the government at national and county levels should take responsibility in creating awareness on CA practices across the country and provide any necessary support for the farmers to embrace this noble practice.
Suggestions for Further Studies
Even though this study largely achieved its objectives, there are some glaring gaps which requires further investigations. For instance, future researchers need to investigate the effect of other input costs on livelihood outcomes, which have not been investigated in this study. This study focused on mulching, farm equipment and labour requirements and did not pay attention to other costs such as the use of chemicals yet this could have an impact on productivity of CA crops.
REFERENCES
- Chiputwa, B., Langyintuo, A.S. and Wall, P. (2011). Adoption of conservation agriculture technologies by smallholder farmers in the Shamva district of Zimbabwe: A Tobit application.”
- Cochran, W. G. (1963). Sampling Techniques, 2nd Ed.,: John Wiley and Sons, Inc. New York.
- Devkota, M., Devkota, K. P., Acharya, S., and McDonald, A. J. (2019). Increasing profitability, yields and yield stability through sustainable crop establishment practices in the rice-wheat systems of Nepal. Agric. Syst. 173, 414–423.doi: 10.1016/j.agsy.2019.03.022.
- Doets C E M, Best G, Friedrich T. (2000). Energy and conservation agriculture. Rome. FAO, sustainable Development and Natural Resources Division Energy Program. Draft unpublished report. 28 p.
- FAO. (2012). Evaluation of FAO’s Contribution to the Conservation Agriculture Thematic Cluster.
- FAO. (2018). Evaluation of FAO’s Contribution to the Conservation Agriculture Thematic Cluster. Food and Agriculture Organization of the United Nations.
- Friedrich, T. and Kienzle, J. (2007). Agriculture: Impact on Farmers’ Livelihoods, Labour, Mechanization and Equipment. Paper presented at the Conservation International Workshop on Conservation Agriculture for Sustainable Land Management.
- Friedrich, F. and Kassam, A.H. (2009). Adoption of Conservation Agriculture Technologies: Constraints and Opportunities. Invited paper, IV World Congress on Conservation Agriculture, 4 – 7 February, New Delhi.
- Geddes A, Scott S. (2011). ‘UK Food Businesses’ reliance on low-wage migrant labour: a case of choice or constraint? In: Ruhs M,Anderson B, eds. Who needs migrant workers?:Labour shortages, immigration and public policy. Oxford: Oxford Scholarship Online.
- Giller, K.E., Witter, E., Corbeels, M. and Tittonell, P. (2009). Conservation agriculture and smallholder farming in Africa: the heretics’ view. Field Crops Research 114 (1), 23–34. doi: 10.1016/j.fcr.2009.06.017.
- Hobbs, P. R., Sayre, K. and Gupta. R. (2007). The role of conservation agriculture in sustainable agriculture. Phil. Trans. R. Soc. B 363: 543 – 555.
- Hobbs, P.R. (2007). Conservation agriculture: what is it and why is it important for future sustainable food production? Journal of Agricultural Science, no.145, pp.127-38.
- IFAD/FAO (2004). Conservation Agriculture as a labour saving practice for vulnerable households, FAO Rome, 73p.
- Kassam A., Friedrich, T. and Derpsch, R. (2010). CA in the 21st Century: A Paradigm of Sustainable Agriculture.” European Congress on CA, Madrid, October. Available at: http://www.marm.es/es/ministerio/serviciosgenerales/publicaciones/Opening_plenary_sessions_tcm7-158496.pdf .
- Knowler, D. & Bradshaw, B. (2007). Farmers’ adoption of conservation agriculture: A review and synthesis of recent research. Food Policy, Elsevier, vol. 32(1), pages 25-48.
- Kumar, V., Jat, H. S., Sharma, P. C., Balwinder, S., Gathala,M. K. and Malik, R. K.,(2018). Can productivity and profitability be enhanced in intensively managedcereal systems while reducing the environmental footprint of production? Assessing sustainable intensification options in the breadbasket of India. Agric. Ecosyst. Environ. 252, 132–147. doi: 10.1016/j.agee.2017.10.006.
- LaCanne, C. E., and Lundgren, J. G. (2018). Regenerative agriculture: merging farming and natural resource conservation profitably. Peerj6:e4428.doi: 10.7717/peerj.4428.
- Lange, D. (2005). Economics and Evolution of Smallholdings Conservation Agriculture in Paraguay. mid-term experiencfes; FAO-GTZ, Asunción/Paraguay, 91 pp.
- Mango, N., Siziba, S. and Makate, C.(2017). The impact of adoption of conservation agriculture on smallholder farmers’ food security in semi-arid zones of southern Africa. Agriculture & Food Security.
- Mariki, W.L., (2003). The Impact of Conservation Tillage and Cover Crops on Soil Fertility and Crop Production in Karatu and Hanang Districts of Northern Tanzania (1999-2003) TFSC/GTZ Technical Report; Selian Agricultural Research Institute (SARI).
- Mashingaidze, A.B. and Mudhara, M. (2006). Non-Governmental Organizations (NGO) efforts to Mexico, and Southern Africa. Journal of Sustainable Agriculture, 36: 180 -206.
- Masika, T. (2020). Impact of One Quarter Rule System on Households Welfare: A case of Yatta, Machakos. A presentation at First Agricultural Industry Forum held at Nairobi Hospital Convention Centre on 4th March 2020.
- Mhlanga, B., Ercoli, L., Pellegrino, E.,Onofri, A., and Thierfelder, C. (2021). The crucial role of mulch to enhance the stability and resilience of cropping systems in southern Africa. Agronomy for Sustainable Development.
- Nkala, P., Mango, N., & Zikhali, P. (2011). Conservation Agriculture and Livelihoods of Smallholder Farmers in Central Mozambique, 757–779. https://doi.org/10.1080/10440046.2011.606492.
- Nkala, P. (2012). Assessing the impacts of conservation agriculture on farmer livelihoods in three selected communities in Central Mozambique. Ph.D. Thesis, University of Natural Resources and Life Sciences, Vienna, Austria.
- Teklewold, T.,Jaleta, M., Kassie, M., Tesfaye, K., Jena, P. R., Marenya, P., et al. (2013). Resource saving and productivity enhancing impacts of crop management innovation packages in Ethiopia. Agric. Econ. 47, 513–522. doi: 10.1111/agec.12251.
- Thierfelder, C. and Wall, P. (2010). Rotation in conservation agriculture systems of Zambia: effects on soil quality and water relations. Experimental Agriculture, vol. 46, no.3, pp.309-26.
- Tshuma, N., Maphosa, M., Ncube, G., Dube, T. and Zenzo L.D. (2012). The impact of conservation agriculture on food security and livelihoods in Mangwe district. Journal of Sustainable Development in Africa.
- Uddin, M. T., & Dhar, A. R. (2016). Conservation agriculture practice and its impact on farmer’s livelihood status in, 14(1), 119–140.
- USAID. (2019). Agriculture and Food Security. Accessed on 24th March 2020 from: http://www.usaid.gov/kenya/agriculture-and-food-security.
- Vastola, A., Zdruli, P., D’Amico, M., Pappalardo, G., Viccaro, M., and Di Napoli,F. (2017). A comparative multidimensional evaluation of conservation agriculture systems: a case study from a Mediterranean area of Southern Italy.
- Wall, P. (2009). Fourth World Congress on Conservation Agriculture, “Strategies to overcome the competition for crop residues in Southern Africa: some light at the end of the tunnel”, New Delhi.
- Waweru, G., Cornelis, W., &Okoba, B. (2013). Farmers ’ percept ion of conservation agriculture in Laikipia East District in Kenya, (October), 1–8.
- Yeray, R.S.G. (2012). Assessment of conservation agriculture (ca) Practices in Bungoma, western Kenya: towards an insight in ca adoption and its constraints. (Unpublished Thesis): Wageningen University.