
Determinants of Solar Energy Demand in Households in Nsukka Area, Enugu State
- Nnaji, C.E.
- Okafor, I.F
- Uzoma, C. C
- Akubue, G. U.
- Adagba C. I
- Onyekaozuru, E. F
- 378-393
- Apr 30, 2023
- Environment
Determinants of Solar Energy Demand in Households in Nsukka Area, Enugu State
Nnaji, C.E.*, Okafor, I.F., Uzoma, C. C., Akubue, G. U., Adagba C. I and Onyekaozuru, E. F
National Centre for Energy Research & Development, University of Nigeria, Nsukka.
*Corresponding Author
DOI: https://doi.org/10.47772/IJRISS.2023.7429
Received: 12 March 2023; Revised: 23 March 2023; Accepted: 29 March 2023; Published: 30 April 2023
ABSTRACT
Household energy survey data collected between middle October and early November 2022 was utilised to investigate the determinants of solar energy demand in households in Nsukka area of Enugu State, Nigeria. The binary logistic regression model was used to analyse the factors affecting the likelihood of demanding for solar energy in the study area. The reasons for not using solar energy were also investigated. The notable socio-economic factors driving demand for solar energy were found to be factors such as higher educational status, age of household, marital status, access to credit facilities, occupation of households, access to media and high household average monthly income. A holistic policy design that will improve the income and sociological status of households in the area would help to propel the demand for solar energy. Easy access to credit facilities and government income stimulating social welfare packages as well as enhancing awareness about the benefits and utilization of solar energy would bring some desired results. Furthermore, the government should create deliberate conditions to make solar energy equipment affordable to many Nigerians with low incomes. Enforcing standard on the quality of solar energy equipment by the government of Nigeria would also go a long way in fostering confidence that will stimulate the demand for solar energy
Keywords: Energy consumption; Solar energy; Binary logistic; Nsukka; Survey; Clean Energy
INTRODUCTION
According to the 2020 data of International Energy Agency (IEA), the number of people each year gaining access to electricity in Africa almost tripled from 8 million between 2000 and 2013 to 24 million people between 2014 and 2019, outpacing population growth. As a result, the number of people without electricity, which peaked at 613 million in 2013, declined progressively to around 572 million in 2019. Much of this progress came in a small number of countries, in particular Kenya, Senegal, Rwanda, Ghana and Ethiopia. According to the data, about half of the Sub-Saharan Africa population living without electricity access is from countries such as Nigeria, the Democratic Republic of Congo and Uganda.
According to the World Bank collection of development indicators, Access to electricity (% of population) in Nigeria was reported at 55.4 % in 2020, indicating a 4.9% decline from 2016 figures. It is disheartening that despite the takeover of the power sector by electricity distribution companies (DISCOS), reliable electricity supply has remained grossly insufficient thereby hampering rapid industrialization and socio-economic development of the country.
World Bank 2020 report indicates that 85 million Nigerians don’t have access to grid electricity. This represents 43% percent of the country’s population and makes Nigeria the country with the largest energy access deficit in the world. It stated that lack of reliable power is a significant constraint for citizens and businesses, resulting on annual economic losses estimated at $26.2 billion (₦10.1 trillion) which is equivalent to about 2 percent of GDP. According to the 2020 World Bank Doing Business report, Nigeria ranks 171 out of 190 countries in getting access to electricity and this is a major obstacle to economic prosperity.
To help address the energy crisis of Nigeria , off-grid solutions including solar home systems, solar lighting, and increasingly mini-grids have become imperative. The government has been emphasizing the inclusion of solar power in their energy mix to lessen the burden on non-renewable and expensive sources of energy (ECN, 2008). More so, In Nigeria, rapid progress has been seen in the propensity of using solar energy over the last few years because of its numerous advantages. Even though Solar energy use has a high initial cost outlay, it has been considered as a reliable alternative energy source for households located in off-grid areas of many developing countries due to its cleanness, energy expenditure savings and simplicity to use ( Chukwu, et al 2020; Rahut, et al 2018,; Ali, et al 2019, Nnaji, et al 2016) . Fossil fuel dependency and carbon emissions reductions can also be greatly enforced by the use of renewable energy such as solar.
Though there are plethora of studies that investigated households’ attitudes and perceptions toward the use of solar energy( Tsaur and Lin 2019, Sun and Spicer 2016, Alrashoud and Tokimatsu 2019, Faiers, and Neame 2006, Adepoju 2019, Mekuria 2006), there are limited studies in most of the developing countries regarding what factors determine solar energy demand, particularly in Nigeria. This study therefore is an attempt to fill the research lacuna.
This study has the following objectives which would assist in achieving the aim of the research.
- To determine the socio-economic attributes of energy users in the area.
- To determine the factors that influence solar energy demand in the area
- To ascertain the reasons why households use solar energy as well as the reasons for not using solar energy
- To suggest policies aimed at improving the demand for solar energy in the area.
REVIEW OF EMPIRICAL LITERATURE
Solar energy is a vital pillar for the socio- economic development of human and for a sustainable environment. Several studies have documented the factors that influence household demand for solar energy as well as perceptions and attitudes towards solar energy technologies. In this regard authors have adopted several methodologies such as descriptive statistics, correlation analysis, logit model as well as other econometrics models to investigate this phenomenon.
Akut (2020) utililised descriptive statistics and correlation analysis to examine the uses and factors that determine the use of solar energy as alternative source of energy in Zaria. The results identified calculators, flash lights and water pumping machines as the major solar energy equipments commonly used. It also revealed that higher income earners constitute a majority of solar energy users. The correlation analysis showed a significant relationship between educational qualification, income and the choice of solar energy.
Mwalule and Mzuza (2022) employed descriptive statistics to establish factors that influence the use of solar energy technology in Machinjiri, in southern Malawi. Results indicated that the level of education attained and availability of income had an influence on the peoples’choices to use solar technology. Some of the reasons for not using solar energy include: low production during winter (55%), not durable (23%), no knowledge (18%) and others mention combined reasons (4%).
In order to investigate the factors influencing lighting energy transitions in rural Ethiopia, Kindeye. F (2019) used both descriptive and inferential statistics. The findings showed that current communication technologies, education level, dwelling type, and area of landholding all have a beneficial impact on the adoption of renewable energy sources like solar. Family size, however, has a detrimental impact on the uptake of solar household systems.
In the Baso Liben District of Ethiopia’s Amhara Regional State, Zeru and Guta (2020) investigated the variables affecting household adoption of solar home systems. The binary logistic regression model’s findings showed that as household income rises, so does the likelihood that they will install solar panels on their homes. Additionally, adoption of SHS was positively connected with participation in off-farm revenue activities, dwelling type, educational status, access to training, media access, and prior knowledge. On the other side, the adoption of SHS is adversely correlated with gender and availability of electricity
De Groote et al (2016) looked into the variation in the uptake of the PV system in the Flanders region (Belgium). According to the author, a solar PV installation is strongly connected with important household factors including house size, roof insulation, and roof quality. He also demonstrated how use of solar home systems declines as a house’s age rises.
In Kenya’s Kapsaret constituency in Uasin Gishu county, Korir (2020) looked into factors influencing consumer acceptance and use of solar energy technology. The study’s conclusions showed that each element, when considered collectively, had a favorable impact on solar energy adoption, with all of the factors together accounting for a variance of 21.6% in solar energy adoption in the Kapsaret constituency.
Waqas et al, (2021) conducted a study to investigate the factors affecting consumer purchase intentions for solar energy applications at domestic level in Pakistan. The result found that consumer purchase intentions is significantly affected from perceived usefulness of the solar energy applications. It further revealed that the the cost of using and purchasing solar energy, perceived ease of use and attitude towards purchase of solar energy positively affected the consumer purchase intentions for solar energy at domestic level.
The extant literature shows deficiency and scanty evidence in the study regarding factors that influence household demand for solar energy in a semi-urban and rural level in Nigeria. In addition, this study fills the gap existing in the literature by extracting some important variables in the literature to examine their influence on household solar energy demand through the dynamic binary logistic model.
THE STUDY AREA
Nsukka is a popular local government in Enugu state, South-East Nigeria. It lies in the Udi Hills at an elevation of 1,300 feet (396 m)(Maplandia). Nsukka is an agricultural-trade centre for the yams, cassava (manioc), corn (maize), cocoyam, pigeon peas, and palm oil and kernels produced by the local Igbo (Ibo) people (Encyclopedia Britannica.) It is located in latitude 6.856 and Longitude 7.39 in the Northern hemisphere of Africa (Maplandia). It is the most populated local government in Enugu state with a population of 309448 according to 2006 population census (NPC,2006) and 444100 according to 2022 projection(city population,2022)
It has a landmass of 486.2km2 and serves as an important center of education and research, with University of Nigeria (1960) and other important health and educational institution such as Bishop Shanahan hospital and the college of education, barracks. Nsukka Local Government Area council is situated in the town of Nsukka and some major communities under the local government are Ede-Oballa, Eha-Alumona, Okpuje, Opi, Nru, Edem, Okutu, Obukpa, Ibagwa, Lejja, and Obimo.
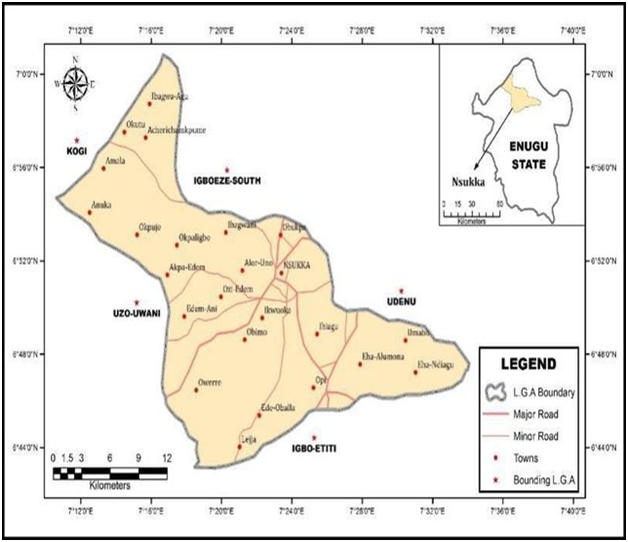
Figure 1. Map of Nsukka Local Government area showing some major communities
Source: Ohanu et al., 2020
DATA AND METHODOLOGY
Data
The project data set is based on a survey conducted by the staff of Energy and Environment Unit (EME) of the National Centre for Energy Research and development, University of Nigeria, Nsukka in which structured questionnaires and oral interviews were administered to households in some parts of Nsukka zone of Enugu State. The survey was conducted for twenty one days from middle October to early November, 2022.
Relevant data concerning factors influencing households’ demand for solar home system/solar energy were collected using both structured and semi-structured data collection tools. The survey questionnaires also include the socio-economic variables, demographic characteristics, utilization of solar energy, reasons to use or reject solar energy, households’ attitudes towards solar energy, and other pertinent variables.
Respondents in the urban and semi-urban sections of the Nsukka Local Government Area were given 500 questionnaires. 14 questionnaires were removed from the data during cleaning procedure, while 19 were discovered to be missing. The remaining 467 respondents’ questionnaires were valid. One or more crucial variables were missing from the 14 questionnaires that were eliminated.
Qualitative response model such as Binary Logistic model as well as descriptive statistics were utilised to analyse the data obtained from the survey.
METHODOLOGY
Model Specification
The Binary logistic model
Demand for solar energy in this study will be modeled as a binary decision whereby a household either use solar energy or not use solar energy. Given this case of binary decision, the dependent variable is a discrete dummy variable (solar energy use =1; and non use of solar energy = 0). The model was chosen because it could carry out discrete choice studies more effectively (McFadden, 1974 and Judge, et al, 1985). Furthermore, because the error term only has two possible values (1 and 0), the variance of the error term is not constant but is heteroskedastic, which violates the assumption of the ordinary least squares regression (OLS), and the probabilities estimated by the linear estimation don’t always fall between zero and one, linear estimation is inappropriate in this situation (Stock and Watson, 2007). As a result, probabilities larger than or equal to one are achievable with linear estimate, which is not acceptable.
The binary logistic model can be expressed as follows
PI=e^(bo+ b1x1+….bvxv)/(1+e(bo+ b1x1+….bvxv)) ………………………………….(1)
The equation used to estimate the coefficients is
In (odds) = In [PI/1-PI ]………………………………….……………..(2)
Where Pi is the predicted probability of the event which is coded with 1 (solar energy use) rather than with 0 (non use of solar), 1- Pi is the predicted probability of the other decision, and the X’s are predictor variables while the b’s represent the coefficients. The quantity Pi/ (1 – Pi) is the odds ratio. In fact, equation 2 has expressed the logit (log odds) as a linear function of the independent factors (Xs). Equation 2 allows for the interpretation of the logit weights for variables in the same way as in linear regressions. For example, the variable weights refer to the degree to which the probability of choosing one choice would change with a unit change in the family size of the respondent. For example, e bv (in equation 2) is the multiplicative factor by which the odds ratio would change if X changes by one unit. To estimate a binary response model, typically, maximum likelihood estimation (MLE) technique (Stock and Watson, 2007) is employed. Thus, the regression employed is nonlinear specifically designed for binary dependent variables.
Table 1 presents the definition of the explanatory variables while Table 2 describes the mean characteristic of the household in the survey
Table 1: Definition of the explanatory variables of the Binary logistic model
| Explanatory Variables (xi ) | Definition |
| Age of household (dummy)a
Marital status of respondent (dummy) Education of respondent (dummy) b Size of household (continuous variable) Credit Access (dummy) House ownership (dummy) Phone (dummy) Media (dummy) Monthly energy bill (continuous variable) Occupation of respondent (dummy) c Income of household (dummy) d |
0=(18-27);1=(28-37); 2=(38-47); 3=(48-57); 4=(58-67) 5=(Above 67)
0-Others; 1-Married (dummy) 1-Primary; 2- Secondary; 3-Tertiary and 4-None; Number of household members 1-Access to credit facilities; 0-othewise 1-own house; 0-otherwise 1 = if the household has a cell phone, 0 -otherwise 1- if HH has media access, 0- otherwise Average monthly energy expenditure 1-Farming; 2-Trading; 3-Civil/public servant;4-others 0=(below N10000);1=(N10000-N30000);2(N31000-50000);3=(N51000-N70000);4=(N71000-N90000); 5=(N91000-N110000); 6=(Above N110000) |
aFor the variable “age of respondent”, households whose variable has “18-27” as outcome are used a s reference
bFor the variable “Education of respondent”, households whose variable has “none” as outcome are used a s reference
cFor the variable “Occupation of respondent”, households whose variable has “others” as outcome are use d as reference.
dFor the variable “Income of household”, households whose variable has “below N10000” as outcome are used as reference.
RESULTS AND DISCUSSION
Table 2. Some descriptive statistics of households in the survey
| Variable name and description | N | Distribution | Mean | ||||||
| HHPOP | 467 | Minimum: | 3 | 5.4 | |||||
| (Household size) | Maximum: | 9 | |||||||
| ROOMS | 467 | Minimum: | 2 | 4.27 | |||||
| (Number of rooms in the house) | Maximum: | 8 | |||||||
| MOBILE | 467 | Yes | 465
2 |
(99.6%)
(0.4%) |
|||||
| Ownership of mobile phones | No | ||||||||
| ENEREXP (Monthly energy expenditure) | 467 | Minimum:
Maximum: |
N2000
N17000 |
N3096 | |||||
| ELESUPPLY (Major source of electricity supply) | 467 | National grid
Generator Solar |
467
0 0 |
(100%)
(0%) (0%) |
|||||
| MEDIA | 467 | Yes | 464 | (99%) | |||||
| (Access to media) | No | 3 | (1%) | ||||||
| WILLING
(Willing to acquire solar energy) |
436 | Yes
No |
100
0 |
(100%)
(0%) |
|||||
| ELECTRIC | 467 | Yes | 467 | (100%) | |||||
| (HH connection to electricity) | No | 0 | (0%) | ||||||
Source: Field survey 2022
Figure 1 Age distribution of respondents
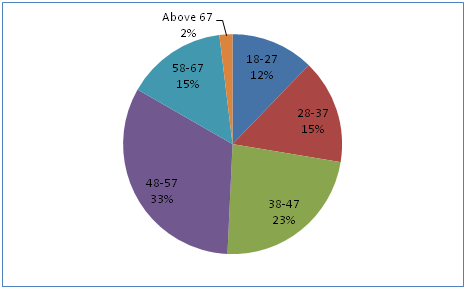
Figure 2 Gender of respondents
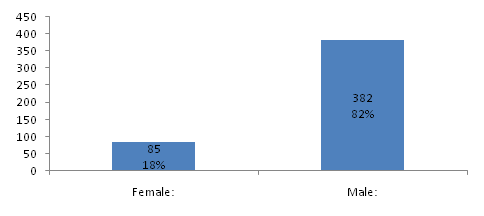
Figure 3 Occupation of respondents
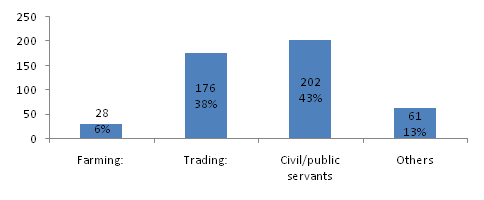
Figure 4 Educational levels of respondents
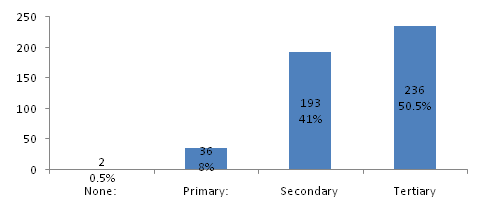
Figure 5 Marital status of respondents
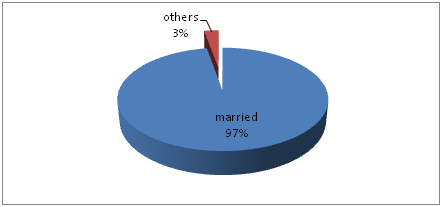
Figure 6 Major need for energy
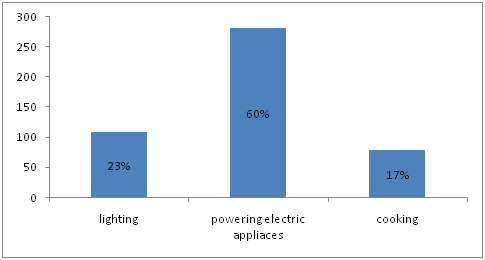
Figure 7 Access to credit facilities
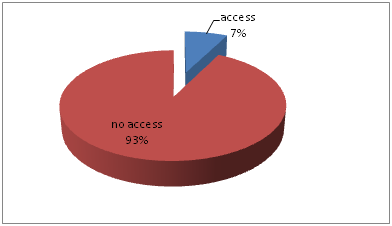
Figure 8 Usage of solar energy
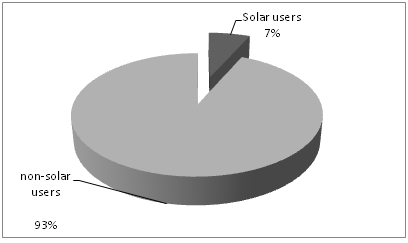
Figure 9 Ownership of dwelling place
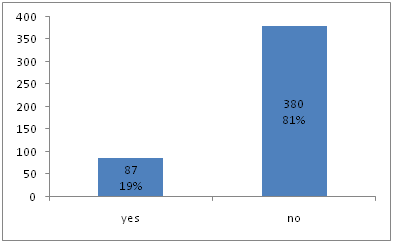
Figure 10 Income levels of respondents
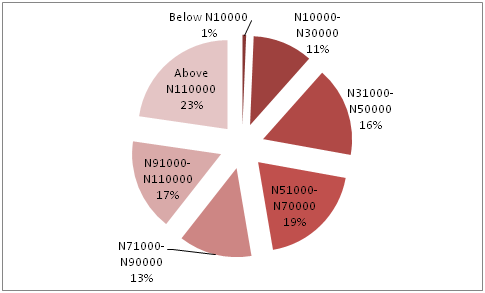
Table 3. Reasons for using solar home system.
| Reasons | Number | Percentage |
| Reliable energy source | 29 | 93.5 |
| Reduces/eliminates energy bill | 31 | 100 |
| Clean energy and health reasons | 27 | 87.1 |
| Others | 10 | 32.3 |
Table 4. Reasons for not using solar home system
| Reasons | Number | Percentage |
| Lack of awareness about solar energy technology | 51 | 11.7 |
| Lack of credit accessibility | 401 | 92 |
| Unable to afford the cost | 436 | 100 |
| Malfunctioning of solar products | 287 | 65.8 |
| lack of attention to implementing solar purchase guarantee | 253 | 58 |
| Low production during rainy season | 59 | 13.5 |
Table 2 and figure1 to figure 10 presents the descriptive statistics of households in the survey. Figure 2 shows that about 82% of the respondents were male and 18% were female. According to information on the respondents’ age distribution as shown in figure 1, majority of them are in their prime working years, with 83% falling between the ages of 18 and 57. Of this number, 27% are between the ages of 18 and 37, and 56% are between the ages of 38 and 57. The majority of the respondents (43%) are civil/public servants, according to their occupation. As shown in figure 3, 44% of people work in agriculture and trade, while 27.6% work in other occupations. In terms of marital status, the survey revealed that 97% of the respondents are married while 3% represent other marital status. As shown in table 2, the average family size of sample households was 5.4.
Regarding educational attainment, figure 4 indicates that the majority of respondents (50.5%) attended post-secondary institutions while 41% obtained post-primary education, indicating that the respondents had a high level of literacy.8% acquired primary education while 0.5% had no formal education. In terms of household average monthly income, figure 10 reveals that1% of the respondents had household incomes below N10, 000, 11% had incomes between N10, 000 and N30, 000, and 48% had incomes between N31, 000 and N90,000. Only 17% had an average monthly income between N91000 and N110000, while 23% had an income above N110, 000.
Information on the use of solar energy as shown in figure 8, indicates a very low level of solar energy adoption as only 7% of the 467 valid respondents use solar and 93% do not use solar energy. While the majority (93%) of the sample homes lacked access to credit facilities, only 7% of respondents had access to credit(figure 7). Nearly all households in the study (99.5%) have a mobile phone. In a similar vein, 82% of sample households had access to the media (either radio or TV). Figure 9 shows that 19% of the households in the sample are home owners, although a higher percentage (81%) lives in rental housing. The survey found that the national grid was the main source of electricity supply, but that powering electrical appliances (60%) and cooking (17%) were the two uses of energy that were most and least necessary(figure 6). Most of the sampled households are connected to electricity while the average monthly expenditure of the respondents on energy was N3096
Reasons for using solar home system
The reasons why households typically use solar energy are presented in Table 3. Families who use solar energy gave their reasons for doing so. As a result, every consumer of solar energy claimed that the technology’s cost effectiveness was a strong reason. Additionally, 98.7% of users stated that it was because solar energy is a dependable energy source. Because of the benefits solar has for the environment and human health, about 87.1% of users adopted it. The adoption of a household solar photovoltaic system is supposedly socially acceptable due to environmental ideals, which is consistent with earlier work (Addai, et al 2022, Chukwu, et al. 2020, Nnaji, et al 2016, Adepoju 2019)
Currently, the rates of conventional energy and electricity from the national grid are rising and beyond what users can afford to pay for their daily needs. But after investing in solar, those adopted households have little to no additional energy costs, in addition to the benefits solar has for the environment and their health. The desire for change to achieve improved living conditions was discovered through discussion with key informants as one rationale for embracing solar energy technology. Its alternatives, such as the usage of generators, drain users’ finances, have an adverse effect on family members’ health, and pollute the environment through noise and air pollution.
Reasons for not using solar home system
Due to a lack of knowledge regarding solar energy use, around 11.7% of non-solar energy users didn’t use it. In Table 4, all of the non-solar users didn’t use solar because they couldn’t afford the costs. This outcome supported a prior study from India that found that the major obstacles to the uptake of solar PV were economic and financial (Eltawil and Zhao, 2010) . 65.8% of the non-user households did so as a result of the solar product they saw or heard about malfunctioning from others who had used it. Table 4 also reveals that 92% of families did not use solar energy since credit facilities were difficult to obtain. The table also revealed that 13.5% of non-solar users didn’t use it because in rainy seasons solar panels do not charge perfectly due to low incoming solar radiation arising from more cloud cover. The conclusion was that, in contrast to other reasons, the inability of the majority of households to adopt solar home systems was due to the high cost and lack of credit facilities. The failure to implement promises made in writing between consumers and the distributors of solar products when those products malfunction was another significant issue. Due to this circumstance, households decide against adopting new technology or stop using it altogether.
This finding is consistent with Zeru and Guta (2021), which found that when solar energy break down quickly after being used, it frequently fosters mistrust among households due to the poor quality and absence of distributor after-sale services.
Econometrics result
The estimates of the coefficients of the binary logistic model are shown in Table 5 along with additional test statistics. The null hypothesis that all estimated coefficients are equal to zero is tested by the χ2 statistic. The model’s χ2 statistic has a value of 375.6 and is significant at the 1% level of confidence. Therefore, we reject the null assumption. Similar to this, the model appears to be reasonably efficient based on the R2 score of 0.684.
Table 5. Binary logistic analysis for solar energy demand
| Variables | Parameter coefficient | P-value | Odds Ratio | |
| INTERCEPT | 1.174 | |||
| AGE
28-37 38-47 48-57 58-67 Above 67 MARITAL(1) |
0.141 0.037 0.049 0.102 0.131 0.218 |
0.674 0.043** 0.021** 0.687 0.982 0.030** |
1.151 1.038 1.050 1.107 1.140 1.243 |
|
| OCCUP FARMING | -1.063 | 0.181 | .345 | |
| TRADING | 0.315 | 0.724 | 1.370 | |
| CIVIL/PUBL SERV | 0.902 | 0.041** | 2.464 | |
| HHPOP | 1.096 | 0.702 | 2.992 | |
| EDU PRIMARY | -0.07 | 0.810 | .933 | |
| SECONDARY | 0.101 | 0.521 | 1.106 | |
| TERTIARY | 1.052 | 0.007*** | 2.863 | |
| HOWNER(1) | 0.502 | 0.814 | 1.652 | |
| CREDIT(1) | 0.018 | 0.000*** | 1.018 | |
| MOBILE | .003 | 0.988 | 1.003 | |
| MEDIA(1) | 0.35 | 0.043** | 1.419 | |
| INCOME N10000-N30000 | -0.324 | 0.000*** | .723 | |
| N31000-N50000 | -0.117 | 0.827 | .890 | |
| N51000-N70000 | -0.085 | 0.634 | .919 | |
| N71000-N90000 | 0.051 | 0.429 | .950 | |
| N91000-N110000 | 0.472 | 0.041** | 1.603 | |
| Above N110000 | 0.928 | 0.032** | 2.529 | |
| χ2 (sig) 23 degree of freedom
Nagelkerke R2 |
375.64(0.000)***
0.684 |
|||
Notes : ***significant at 1% level; **significant at the 5% level
Source: Results from the Binary logistic regression output
Age of Household
The regression results show that age of household are positively related to demand for solar. However, only the age brackets (38-47 and 48-57) are statistically significant at the 5% confidence level. This supports the evidence and assertions from the conducted oral interviews that youths who started work early and worked for up to ten years may save enough finance to acquire solar energy. Moreover, it is believed that as a medium to high income earner tends towards retirement age, the acquisition of products and technologies that improve standard of living would be utmost priority. This affirms the findings of Busola & Olaniyi, (2012) who found that age of household was positively related to expenditure on clean energy sources. The odds ratio indicates that the demand for solar energy increased by a factor of 2.088 by being in the age bracket of 38-57 years.
Marital Status
Being married was found to be one of the important factors of demand for solar home system. The estimated result indicates that being married was statistically significant (P < 0.05) and positively associated with the demand for solar energy. This supports the work of Adeleke, et al (2022) and Birku (2020) who found that married household have a higher likelihood of being willing to pay for RETs than single counterparts as a result of shared responsibilities which come with marriage. This is evident since a married respondent may have more energy use demands in the running of day-to-day activities. Specifically, the odds ratio shows that the odds of demanding for solar energy compared to non demand for solar increased by a factor of 1.243 by being married rather than other marital status.
Occupation of Household
Occupations of household with the exception of farming were found to be positively associated with the demand for solar energy. However, only that of civil/public servants was found to be statistically significant. The reasons for this may be that the deployment and use of solar energy in many government parastatal awakened keen interest and the desire by civil/public servants to own solar energy. The survey area is predominantly a university community with reasonable deployment of solar energy. The odds ratio indicated that the demand for solar energy increased by a factor of 2.46 by being a civil/public servant rather than other occupation.
Level of Education of Households
In terms of level of education of households, it was found that only tertiary level of education was statistically significant at the 1 percent level of confidence. It implies that those who attended tertiary institutions are more likely to demand for solar energy. The reasons may be that those that attended tertiary institution has more knowledge about solar systems and its deployment and would not hesitate to demand for solar for its numerous benefits. This finding is consistent with Mwalule and Mzuza (2022), who found that most solar energy users in the investigated Malawi region attended tertiary institution. In a similar vein, Samad, et al. (2013) discovered that households are more inclined to install solar home systems if they had superior educational resources. More specifically, a high level of education is thought to be associated with a high level of awareness (Maino 2019).The odds ratio revealed that the demand for solar energy increased by a factor of 2.86 by attending tertiary institution rather than not attending any formal education.
Access to Credit Facilities
Access to credit facilities was found to be one of the important factors of demand for solar home system. The estimated result indicates that access to credit facilities by households was statistically significant (P < 0.01) and positively associated with the demand for solar energy. This is in line with the works of Ding, et al (2022) and Addai, et al (2022) which found that access to credit facilities significantly influenced the demand for solar energy. Precisely, the odds ratio shows that the demand for solar energy increased by a factor of 1.02 rather than not having access to credit facilities.
Access to Media
One of the main variables affecting consumers’ demand for solar energy is access to media. According to the findings, access to media has a significant (P< 0.05) and favorable impact on household demand for solar energy. The odds ratio reveals that the probability of asking for solar energy compared to non demand for solar increased by a factor of 1.419 by having access to media .The results are consistent with prior research. For instance, Zeru and Guta (2020) and Abera and Fenta (2019) suggested that media helps to obtain extensive knowledge and information about things that happen and are generated every day, including new technology that may result in a change in attitude. Additionally, it is connected to earlier works that explained how TV and radio are significant media platforms for changing people’s attitudes on contemporary technology like solar power (Sun and Spincer, 2016; Faiers and Neame ,2006)
Household Average Monthly Income
Another important variable affecting consumers’ demand for solar energy is household average monthly income. Household income for this study has mixed coefficient signs of negative and positive. The variable had a negative sign at income groups of N70000 and below and a positive sign at income groups of N71000 and above. Specifically, the estimated result indicates that the coefficient of the income group (N10000-N30000) was statistically significant (P < 0.01) and positively associated with the demand for solar energy. On the other hand, the coefficients of the income groups (N91000-N110000; Above N11000 ) were statistically significant (P < 0.05) and positively associated with the demand for solar energy. This implies that low income earnings discourages households from acquiring solar energy while high income earnings encourages demand for solar energy. This corresponds with the findings of (Olaleye and Akinbode, 2012) and that of Maina et al (2019).
CONCLUSION AND POLICY IMPLICATIONS
This paper employed the binary logistic model and descriptive statistics to investigate the factors that determine household demand for solar energy in Nsukka area of Enugu State. Seven independent variables were found to be statistically significant in the study’s findings from the binary regression analysis of the factors affecting household demand for solar energy . These factors, which had a positive impact, included the average household monthly income, age of households, media access, marital status, household occupation, higher education level, and access to credit facilities.
The study comes to the conclusion that despite being reliable and environmentally benign, solar energy is still not commonly employed in the region. The major deterrent to using solar products, according to results, is their high cost.. Other major reasons are lack of credit facilities and malfunctioning of solar products. A holistic policy design that will improve the income and sociological status of households in the area would help to propel the demand for solar energy.
Increasing awareness of the advantages and utilisation of solar energy, as well as facilitating access to financial facilities and government-sponsored social welfare programs, would all contribute to the intended outcomes. Additionally, the government should take concerted steps to lower the cost of solar energy equipment for many low-income Nigerians. The Nigerian government’s enforcement of standards for the quality of solar energy equipment will also go a long way towards generating confidence that will increase demand for solar energy.
ACKNOWLEDGMENTS
The Researchers gratefully acknowledge the funding of the project by the National Centre for Energy Research and Development, University of Nigeria, Nsukka. The respondents are also highly appreciated for their patience in providing all the necessary information for this study.
REFERENCES
- Abera,Y and Fenta K, (2020) Determinants of lighting energy transitions in rural Ethiopia: lessons from Mida Oromo and Wonisho Districts of Ethiopia, Environ. Manag. Sustain. Dev. (2019) doi:10.5296emsdv8i315151
- Addai , B; Tang, W; Twumasi, A. M; Asante, D and Agyeman, S. A (2022) Access to financial services and lighting energy consumption: Empirical evidence from rural Ghana. Energy Volume 253, 124109
- Adepoju, O.Y(2019) Factors influencing willingness to adopt renewable energy technologies among micro and small enterprises in Lagos State Nigeria, Int. J. Sustain. Energy Plan. Manag. 19, 69–78
- Akut, Y. B (2020) Use of Solar Energy as an Alternative Source of Energy in Zaria Journal of Science Technology and Education 8(1):243-247
- Ali, A., Mottaleb, K. A. and Aryal, J. P. (2019). Alternate energy sources for lighting among Rural Households in the Himalayan region of Pakistan: Energy and Environment. Sagepub.com.
- Alrashoud, K. and Tokimatsu, K (2019) Factors Influencing Social Perception of Residential Solar Photovoltaic Systems in Saudi Arabia, Sustainability 11, 5259 (2019)
- Asmare Mossie Zeru and Dawit Diriba Guta (2021). Factors influencing rural household attitude towards solar home system in Ethiopia. Renew. Energy Environ. Sustain. 6, 42. Available at https://doi.org/10.1051/rees/2021048
- Ayoub S., Dastgir G and Waqas M (2019). Factors Affecting Consumer Purchase Intentions for Solar Energy Application at Domestic Level. International Journal of Economics, Commerce and Management Vol. 7 Issue 10,349-363
- Birku R. E (2020) Analysis of households’ willingness to pay for a renewable source of electricity service connection: evidence from a double-bounded dichotomous choice survey in rural Ethiopia. Journal of Heliyon 6:1-13 https://doi.org/10.1016/j.heliyon .2020.e03332
- Busola, K. O., & Olaniyi, M. A. (2012). Energy consumption of rural farming households in Kwara State, Nigeria. Journal of Sustainable Development in Africa 14(2): 63-76.
- Chukwu, J. O, Iheonu, O.C and Nnaji, C.E (2020) “ Foreign Direct Investment, Financial Deepening, Energy Innovations and Environmental Quality in Selected African Economies” Nigerian Journal of Social Sciences, Vol.14, Issue 2,pp. 1-8
- Citypopulation(2022)https://citypopulation.de/en/nigeria/admin/enugu/NGA014013__nsukka/
- Ding,G; Hua, J; Duan, J; Deng,S; Zhang, W; Gong,Y and Sun, H (2022) Research on the Strategy of Industrial Structure Optimization Driven by Green Credit Distribution. Sustainability 14, 9360. https://doi.org/10.3390/su14159360
- Eltawil, A. M and Zhao, Z.(2010) Grid connected photovoltaic power systems: technical and potential problems − a review, Renew. Sustain. Energy Rev. 14, 112–129 (2010)
- Energy Commission of Nigeria (ECN) 2008, “Assessment of Energy Options and Strategies for Nigeria: Energy Demand, Supply and Environmental Analysis for Sustainable Energy Development, 2000 – 2008”.
- Faiers A and Neame, C (2006) Consumer attitudes towards domestic solar power systems, Energy Policy 1797–1806 (2006)
- IEA (2020). Key world energy statistics 2020. International Energy Agency, Paris
- Korir K. D (2020) Factors Affecting Consumer Adoption ff Solar Energy Technology in Uasin Gishu County In Kenya. Msc dissertation submitted to the Chandaria School of Business, United States International University-Africa.
- Maina, Y. B1; Kyari, B. G. and Maina, M. B (2019). Households’ Clean Energy Demand in Nigeria and Its Implication on the Environment. Journal of Agricultural Economics, Environment and Social Sciences 5(1&2):35–45
- Maplandia-www.maplandia.com
- McFadden D (1974). Conditional logit analysis of qualitative choice behaviour. In: Zarembka P (ed), Economic Theory and Mathematical Economics. Academic Press, New York.
- Mekuria E,(2016) Challenges and Prospects of Solar Home System Dissemination in Rural Parts of Ethiopia, 2016, http:// localhots:80/xmlui/handle/123456789/13346
- Mwalule, G. and Mzuza, M.K. (2022) Factors Influencing the Use of Solar Energy Technology in a Local Township of Blantyre City, Malawi. Open Journal of Energy Efficiency, 11, 1-9.https://doi.org/10.4236/ojee.2022.111001
- National Population Commission (2006). https://nationalpopulation.gov.ng
- Nnaji, C. E., Nnaji , M., Chimah, J.N., Maduekwe, M.C.(2016) “The Energy Intensity of Economic Sectors in MINT Countries: Implications for Sustainable Development. IRA- International Journal of Management & Social Sciences (ISSN 2455-2267), 4(1). doi:http://dx.doi.org/10.21013/jmss.v4.n1.p20
- Ohanu C.,Ekeh F., Ohanu, B.I., aguzie, I., Ivoke N.(2020)Evaluation of some heavy metals and physicochemical properties of public refuse dumpsites in Nsukka metropolis, Nigeria. July 2020 Environmental Monitoring and Assessment 192(7) DOI: 10.1007/s10661-020-08450-8
- Olaleye, S. O. & Akinbode, S. O. (2012). Analysis of households’ demand for alternative power supply in Lagos state, Nigeria. Journal of Social Science 4 (2): 121-127.
- Rahut, D.B., Mottaleb, K.A. Ali, A & Aryal, J. (2018). The use and determinants of solar energy by Sub-Saharan African households International Journal of …, Taylor & Francis
- Samad, H. A.; Khandker, S. R.; Asaduzzaman, M.; Yunus,( 2013) The Benefits of Solar Home Systems : An Analysis from Bangladesh. Policy Research Working Paper;No. 6724. World Bank, Washington, DC. © World Bank. https://openknowledge. worldbank. org/handle/ 10986/16939 License: CC BY 3.0 IGO.
- Stock, J. H., and Watson, M. W., (2007) Introduction to Econometrics (2nd ed). Pearson Education, Inc, Boston
- Sun, Y and. Spincer, S (2016) Exploring residents’ attitudes toward solar photovoltaic system adoption in China, Undergraduate Rev. 12, 148–160
- Thsaur R. C, and Lin, Y (2018) Exploring the consumer attitude of building-attached photovoltaic equipment using revised technology acceptance model, Sustainability 4177
- World Bank., (2020 ) World Bank, World Development Report 2020: Development and the Environment, Oxford University Press Inc., New York (2012).
- Yasin A, Seid E & Mohammed A (2022) Determinants of solar technology adoption in rural households: The case of Belesa districts, Amhara region of Ethiopia. Cogent Economics & Finance (2022), 10:1-12. https://doi.org/10.1080 /23322039 .2022.2087644
- Zeru,A. M and Guta,D (2020) Factors Influencing Household Adoption of Solar Home System in Baso Liben District, Amhara Regional State of Ethiopia, 2020, Available at: https://doi.org/10.21203/rs.3.rs-60920/v1