
Effects of Climate Variation on Food Crop Production in Forestland of South West, Nigeria
- O.J Iseyemi
- J.O Okunlola
- K.E. Owolabi
- H.O Adefisoye
- A.A Balogun
- 01-16
- Apr 23, 2023
- Agriculture
Effects of Climate Variation on Food Crop Production in Forestland of South West, Nigeria
O.J Iseyemi, J.O Okunlola, K.E. Owolabi, H.O Adefisoye, A.A Balogun
Department of Agricultural Extension and Communication Technology, The Federal University of Technology, Akure, Ondo State, Nigeria
DOI: https://doi.org/10.47772/IJRISS.2023.7401
Received: 13 October 2021; Revised: 02 November 2021; Accepted: 03 November 2021; Published: 23 April 2023
ABSTRACT
Rising temperature and erratic rainfall pattern which are attributed to the varying climate has been the bane of the food crop farmers. Nigeria is experiencing adverse climatic conditions with negative effects on food crop production, persistent droughts and flooding, off season rains and dry spells have sent growing season of track. It is in view of this that the study examined the effects of climate variation on farmers’ food crop production in Ogun and Ondo state Nigeria. A multistage sampling technique was used in the selection of respondents (food crop farmers). One hundred and twenty (120) food crop farmers from each state were selected for interview. Findings from the study revealed that majority (65 percent) of the farmers were males, the mean age of the farmers in the study area was 44 years and predominant household size was that of 1-5 persons. Large percentage (83.3 percent) were married,47.9 percent of the respondents identified radio as their major source of information on climate variatioan. The result from the study revealed that there was a significant association between membership of social organisation (χ² = 19.36, p ≤ 0.05), marital status (χ² = 38.48, p ≤ 0.05) of the respondents and the perceived effects of climate variability. Similarly, findings revealed that there was a significant association between farm size (r = 0.27, p ≤ 0.05), farming experience (r = 0.20, p ≤ 0.05) of the respondents and perceived effects of climate variability. There was no significant relationship between farmers’ sources of information (r = 0.090, p < 0.172) and perceived effects of climate variation. There was a positive and significant relationship between farmers awareness about climate variability (r = 0.142, p ≤ 0.05) and perceived effects of climate variation.
INTRODUCTION
Background of the Study
Climate is a renewable resource which varies on all time scales, from year to year, as well as from one decade, century or millennium to the next (Owusu and Sarkodie, 2016). Climate variability refers to the spatio-temporal variation of climatic conditions beyond individual weather events (Philip et al., 2014). Africa is therefore considered to be the most vulnerable region to climate variability because it is exposed to climate risks, reliance on rain fed agricultural and also has low adaptive capacity because of high rate of poverty (Kom et al., 2020). Nigeria has revealed distinctive inter-annual and inter-decadal variability in climatic variables like precipitation and temperature. The total duration of the rainy season is also revealed to have shortened, while dry season and rainy season temperatures have increased by about 1°C and 2°C respectively (Amikuzuno and Donkoh, 2012).
Climatic variability has a direct, often adverse influence on the quantity and quality of agricultural production. The climate of an area is highly correlated to the vegetation and by extension the type of crop that can be cultivated. Temperature, rainfall, (day length) are the important climatic element that influence cropping production. The overall predictability of these climatic elements is imperative for the day-to-day and medium term planning of farm operations (Ayanlade et al., 2018). Climate is a primary determinant of agricultural productivity especially in the developing countries like Nigeria, where agriculture is basically dependent on natural circumstances against the controlled environmental condition in developed countries. Thus, climate would influence crop yield vis-à-vis crop production to a greater extent in developing countries (Ayanlade et al., 2018).
The climate of south-western Nigeria is tropical in nature and it is characterised by wet and dry seasons. The temperature ranges between 21°C and 34°C while the annual rainfall ranges between 1500mm and 3000mm (Agbaje and Oladipo, 2019). The wet season is associated with the southwest monsoon wind from the Atlantic Ocean while the dry season is associated with the northeast trade wind from the sahara desert (Agbaje and Oladipo, 2019). The vegetation in southwest Nigeria is made up of fresh water swamp and mangrove forest at the belt. The low land in the forest stretches inland to Ogun and part of Ondo State, while secondary forest is towards the northern boundary where the derived southern savannah exist (Faleyimu and Oyebade, 2012).
Problem Statement
Rising temperature and erratic rainfall pattern which are attributed to the varying climate has been the bane of the food crop farmers. Nigeria is experiencing adverse climatic conditions with negative effects on food crop production, persistent droughts and flooding, off season rains and dry spells have sent growing season of track (Ologeh et al., 2018). Unfortunately, the south west zone of Nigeria happens to be one of the areas in the country that is vulnerable to climate variability and has suffered reduction in crop yield over the years as a result of the varying climate. Since the reduction in crop production is a threat to food security with the potential to contribute to the risk of famine, there is need for a comprehensive research to explore the extent of the effect of the climatic variability on crop production.
The forest lands in Nigeria are not left out in the threat posed by climate variation. Climate variation affects agriculture and forestry through higher temperature elevated carbon dioxide (CO₂) concentration, precipitation changes, increased weeds and increased pest and diseases of plants. All these adversely affect food production in Nigeria in diverse ways (Agbaje and Oladipo, 2019).
Even though there seem to be much research regarding the impact of climate variation and change on agriculture. Very little information is available in the area of climate variation and food crop production in forest lands, especially in southwest zone of Nigeria which is noted for its large scale production of food and tree crops. It is in view of this that the study attempt to provide answer to the following research questions.
- What are the socio-economic characteristics of farmers in the study area?
- What has been the trend of climate variability over the past 5 years (2015-2019) in the study area?
- What are the sources of information on climate variability to the farmers in the study area?
- What are the effects of climate variability on food crop production in the study area?
- How do farmers perceive the effects of climate variability on their food crop production in the study area?
- What are the adaptation strategies of the farmers in response to the effects of climate variability in the study area?
Objectives of the Study
The general objective of the study is to determine the effects of climate variability on food crop production in forest lands. The specific objectives are to:
- ascertain the socio-economic characteristics of the farmers in the study area,
- examine the trend of climate variability over a period of 5 years (2015-2019) in the study area,
- identify the sources of information on climate variability to the farmers in the study area,
- determine the effects of climate variability on food crop production in the study area,
- assess how farmers perceived the effects of climate variability on their food crop production in the study area and
- assess the adaptation strategies of the farmers in response to the effects of climate variability in the study area.
Hypotheses of the Study
H01: There is no significant relationship between the socio-economic characteristics of the farmers and the perceived effects of climate variability.
H02: There is no significant relationship between the farmers’ sources of information on climate variability and the perceived effects of climate variability.
H03: There is no significant relationship between the farmers’ awareness about climate variability and the perceived effects of climate variability.
Significance of the Study
The study was aimed at analysing how climate variability affects food crop production and to identify the appropriate adaptation measures needed to ameliorate the existing problems and prevent negative effects in the future. The findings of the study will help policy makers such as the Federal Ministry of Agricultural and Rural Development and State Ministries of Agriculture to understand and appreciate the complex interconnections through which climate variability affects food crop production. The findings will also serve as a document that will provide background information on the effects and relationship between climate variability and food crop production.
METHODOLOGY
This study was carried out in Ogun and Ondo states of Nigeria. A multistage sampling technique was used in the selection of respondents (food crop farmers). Two (2) states were purposely selected from six south-western states, considering the two dominant agro-ecological zones (rainforest and savanna) in the region. Ogun, Ondo and Osun states mainly belong to rainforest agro-ecological zone while Ekiti and Oyo state belong mainly to savanna dominated agro-ecological zone. (Lagos state was not included). Ogun and Ondo states were randomly selected from the rainforest agro-ecological zones respectively. For administrative reason, each of the two (2) states was divided into two agricultural zones by Agricultural Development Programme (ADP). Four (4) agricultural zones in the two (2) states were selected. Two (2) extension blocks were randomly selected from each agricultural zone, making eight (8) extension blocks in all. Two (2) farming villages or communities were randomly selected from each extension blocks making a total of 16 (sixteen) farming villages or communities. In each farming village or community, fifteen (15) food crop farmers were randomly selected making a sample size of two hundred and forty (240) food crop farmers, one hundred and twenty (120) from each state were selected for interview. Data for this study was obtained from primary and secondary sources. Primary source was obtained from qualitative and quantitative data. The quantitative data was obtained from validated interview schedule while the qualitative data was obtained from Focus Group Discussion (FGD) and key informant interview (KII). Secondary source was obtained from the Nigeria Metrological Agency (NIMET). Data was obtained from journals, textbooks, internet, reports, well structured, pretested, reliable and validated questionnaire.
RESULTS AND DISCUSSION
Socio Economic Characteristics of Respondents
The results in Table 1 showed that majority (65 percent) of the respondents were males. The mean age of the respondents was 43.9 years which means that farmers were still in their active age and therefore contributing adequately to the sustenance of their household. Result from Table 1 also revealed that 83.3 percent of the respondents were married. The couple and the offspring complemented one another effort thereby reducing the stress working alone. This also reduced the cost incurred on labour. Marital status can also affect the level of climate variation awareness through the knowledge of the household head. The more knowledgeable the household head, the more informed and aware the rest of the household would be. Majority (57.9 percent) of the respondents had household size of 1-5 persons. The mean household size was 6. Large family size is an indicator of labour availability in the family. Household size influence income, farm size and labour hours because the larger the household size the more hands will be available for farm labour, hence increase in farm size (Olushola et al., 2019). The study has also established that majority (90.4 percent) of the respondents had formal education. Respondents’ level of education will assist them to seek information on climate variation and perceived changes that occur in the climate system.
Table 1.Distribution of Respondents According to their Socio-Economic Characteristics
| Socio-economic characteristic | Frequency | Percentage (%) | Mean |
| Sex Male | 156 | 65 | |
| Female | 84 | 35 | |
| Age (years) | |||
| 20-29 | 7 | 2.9 | |
| 30-39 | 54 | 22.5 | |
| 40-49 | 95 | 39.6 | 43.9 |
| 50-59 | 63 | 26.3 | |
| 60-69 | 19 | 7.9 | |
| >70 | 2 | 0.8 | |
| Marital status | |||
| Single | 8 | 3.3 | |
| Married | 200 | 83.3 | |
| Divorced | 15 | 6.3 | |
| Widowed | 5 | 2.1 | |
| Separated | 12 | 5.0 | |
| Household size | |||
| 1-5 | 139 | 57.9 | |
| 6-10 | 82 | 34.2 | 6 |
| 11-15 | 14 | 5.8 | |
| 16-20 | 5 | 2.1 | |
| Level of Education | |||
| No formal education | 23 | 9.6 | |
| Attempted primary school | 14 | 5.8 | |
| Completed primary school | 20 | 8.3 | |
| Attempted secondary school | 23 | 9.6 | |
| Completed secondary school | 116 | 48.3 | |
| Attempted tertiary school | 4 | 1.7 | |
| Completed tertiary school | 40 | 16.7 | |
| Primary Occupation | |||
| Farming | 172 | 71.7 | |
| Public servant | 16 | 6.7 | |
| Private sector work | 10 | 4.2 | |
| Artisanship | 24 | 10 | |
| Trading | 18 | 7.5 |
Source: Field survey, 2020.
Trend of Climate Variability over the Past 5years (2015-2019) in the Study Area
Trend of climate variables are analysed on a seasonal basis to coincide the growing season of the crops considered for the study.
Average Summer Maximum Temperature Variation and Trend
Figure 1 presents the average summer maximum temperature in the study area. The average summer maximum temperature from 2015 to 2019 fluctuates between 29.8°C and 30.8°C over the years with a mean value of 30.5°C. The trend equation and the trend line of the average summer maximum temperature generally shows a decreasing trend (-0.06x) which means that the average summer maximum temperature over the year (2015-2019) has been decreasing. This may directly affects absorption of water and nutrients of plants (Fosu-Mensah, 2012). The degree of variation (R² = 0.072) shows that the variability in average summer maximum temperature in the area was less than 1 percent. (Onkongor et al., 2021). According to Onkongor et al. (2021) cassava and yam grow best in areas with a mean maximum temperature of 25ºC-30ºC.
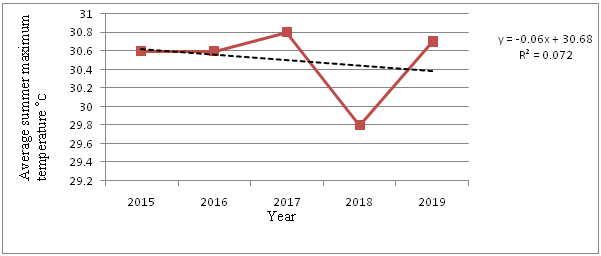
Figure 1 Average Summer Maximum Temperature from 2015 to 2019 in the Study Area.
Note: Summer season includes the months of April – October
Source: Raw data from Nigeria Metrological Agency (NIMET), Abuja.
Average summer minimum temperature variation and trend
Figure 2 shows the average summer minimum temperature in the study area. The average summer minimum temperature from 2015 to 2019 fluctuates between 22.8°C to 23.3°C over the years with a mean value of 23.1°C. The trend equation and the trend line of the average summer minimum temperature shows a decreasing trend (-0.12x) which means that the average summer minimum temperature over the year (2015 – 2019) has been decreasing. The degree of variation (R² = 0.038) reveals that the variability in the average summer minimum temperature in the study area was less than 1 percent). According to Onkongor et al. (2021) below the temperature of 10ºC, cassava may stop growing. Temperature below 20ºC impedes the growth of yam and maize may stop growing at a temperature of 14ºC.
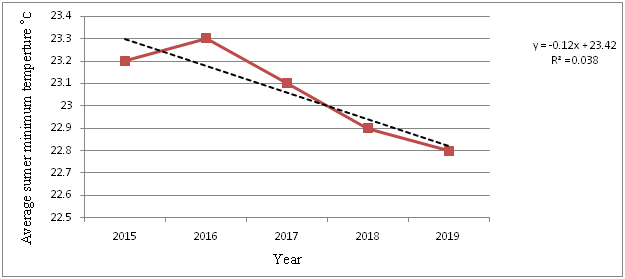
Figure 2: Average Summer Minimum Temperature from 2015 to 2019 in the Study Area.
Note: Summer season includes the months of April – October
Source: Raw data from Nigeria Metrological Agency (NIMET), Abuja.
Average Summer Rainfall Variation and Trend
Figure 3 gives a detailed account of the rainfall variability trend in the study area. The average summer rainfall amount portrays an increasing trend. From the graph, rainfall experienced a number of variations over the period under consideration (2015 to 2019) with the mean value of (193.1mm). The trend equation and the trend line of the average summer rainfall show a gradual increasing trend (3.74x) which means that the average summer rainfall over the year (2015 – 2019) has been increasing in a steady rate. The general increase in summer rainfall may be due to the fact that, some years recorded very high rainfall which might have generally influenced the overall trend. The average summer rainfall recordings in the area showed the following figures, 2015(179.7mm), 2016(211.3mm), 2017(171.8mm), 2018(196.9mm), 2019(205.6mm). This implies that even though average rainfall increased over the period, the rate of increase was also gradual. The high recordings of rainfall in some periods of the year may be favourable for crop production as crops generally requires certain amount of rainfall during growth periods for maximum production. The degree of variation (R² = 0.367) shows that the variability in average summer rainfall in the area was less than 1 percent.
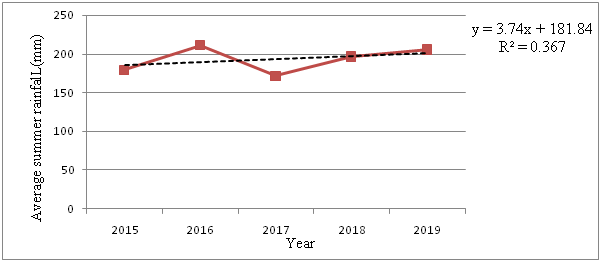
Figure 3: Average Summer Rainfall from 2015 to 2019 in the Study Area.
Note: Summer season includes the months of April – October
Source: Raw data from Nigeria Metrological Agency (NIMET), Abuja.
Respondents’ Sources of Information on Climate Variation
Figure 4 showed that 47.9 percent of the respondents identified radio as their major source of information on climate variation, 24.7 percent identified television as sources of information on climate variation, 13.8 percent identified extension agents as sources of information, 8.3 percent identified neighbours as sources of information, 4.2 percent identified village leaders as sources of information, while 1.7 percent identified development agents as sources of information to them. Majority used radio and television as sources of information on climate variation. This could be because of the affordability of the gadget as the farmers are seen holding different pocket size radio.
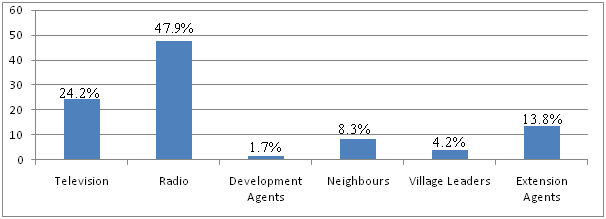
Source: Field survey, 2020.
Figure 4. Distribution of Respondents According to Sources of Information on Climate Variation
Regression Result for Maize Production
The result from the regression analysis in Table 2 showed that the regression coefficient of determination R² was 0.167. It can be noted that about 16.7% of variation in maize could be explained by means of summer maximum temperature, summer minimum temperature and summer rainfall. The remaining 83.3% were largely due to other variables outside the regression model that also have effect on maize production. The summer rainfall (p < 0.036) was statistically significant at 5% and positively contributes to maize production. The result therefore implies that a 1% increase in summer rainfall holding other variables constant leads to 0.3% increase in maize production. The regression statistics of summer rainfall variability and maize production indicate that as summer rainfall increases, maize production begins to increase. This agreed with the findings of Okeowo et al. (2015) that maize production is affected by summer rainfall. According to them as summer rainfall increases, maize production also increases. Summer maximum temperature and summer minimum temperature were not statistically significant. This may be attributed to less variation in summer maximum temperature (coefficient of variation = 0.072) and summer minimum temperature (coefficient of variation = 0.038) during the study period (2015-2019). The estimation therefore shows that maize production in Ogun and Ondo was largely dependent on rainfall.
Table 2. Regression Statistics for Maize Production
| Variable | B | Standard Error | t-value | p-value |
| Constant | -7.743 | 54.667 | -0.142 | 0.892 |
| Summer maximum temperature | 0.317 | 2.318 | 0.137 | 0.896 |
| Summer minimum temperature | 1.235 | 3.817 | 0.323 | 0.757 |
| Summer rainfall | 0.280 | 0.290 | 0.965 | 0.036 |
R Squared = 0.167, Significant at 0.05
Source: Field Survey, 2020
Regression Result for Cassava Production
The result from the regression analysis in Table 3 showed that the regression coefficient of determination R² was 0.440. It can be noted that about 44% of variation in cassava could be explained by means of summer maximum temperature, summer minimum temperature and summer rainfall. The remaining 56% were largely due to other variables outside the regression model that also have effect on cassava production. The summer minimum temperature (p < 0.039) was statistically significant at 5% and positively contributes to cassava production. The result therefore implies that 1% increase in summer minimum temperature holding other variables constant leads to 0.1% increase in cassava production. The regression statistics of summer minimum temperature variability and cassava production indicate that as summer minimum temperature increases, cassava production also increases. Result of the study support the findings of Orimoloye and Adigun (2015) that as summer minimum temperature increases, cassava production also increases. Summer maximum temperature was not statistically significant. This may be attributed to less variation in summer maximum temperature (coefficient of variation = 0.072) during the study period (2015-2019). Summer rainfall was not statistically significant. This implies that rainfall was adequate for cassava production because the water requirement of cassava was always met. The estimation therefore shows that cassava production in Ogun and Ondo state was largely dependent on summer minimum temperature.
Table 3. Regression Statistics for Cassava Production
| Variable | B | Standard Error | t-value | p-value |
| Constant | -214.756 | 119.885 | -1.791 | 0.111 |
| Summer maximum temperature | 1.287 | 1.148 | 1.121 | 0.295 |
| Summer minimum temperature | 0.100 | 3.500 | 0.028 | 0.039 |
| Summer rainfall | 8.550 | 4.945 | 1.729 | 0.122 |
R Squared = 0.440, Significant at 0.05.
Source: Field Survey, 2020.
Regression Result for Yam Production
The result from the regression analysis in Table 4 showed that the regression coefficient of determination R² was 0.699. It can be noted that about 69.9% of variation in yam could be explained by means of summer maximum temperature, summer minimum temperature and summer rainfall. The remaining 30.1% were largely due to other variables outside the regression model that also have effect on yam production. The summer minimum temperature (p < 0.047) was statistically significant at 5% and positively contributes to yam production. The result therefore implies that 1% increase in summer rainfall holding other variables constant leads to 0.2% increase in yam production. The regression statistics of summer minimum temperature variability and yam production indicate that as summer minimum temperature increases, yam production also increases. This agreed with the findings of Francis (2017) that summer minimum temperature has positive effects on yam output followed by rainfall and lastly by summer maximum temperature. Summer maximum temperature was not statistically significant. This may be attributed to less variation in summer maximum temperature (coefficient of variation = 0.072) during the study period (2015-2019). Summer rainfall was not statistically significant. This implies that rainfall was adequate for yam production because the water requirement for yam was always met. The estimation therefore shows that yam production in Ogun and Ondo state was largely dependent on summer minimum temperature.
Table 4. Regression Statistics for Yam Production
| Variable | B | Standard Error | t-value | p-value |
| Constant | 75.965 | 29.983 | 2.534 | 0.127 |
| Summer maximum temperature | 2.279 | 1.188 | 1.918 | 0.195 |
| Summer minimum temperature | 0.160 | 0.250 | 0.640 | 0.047 |
| Summer rainfall | 5.032 | 2.358 | 2.134 | 0.166 |
R Squared = 0.699, Significant at 0.05.
Source: Field Survey, 2020.
Respondents’ perceived effects of climate variation on food crop production.
Result in Table 5 showed that farmers agreed that climate variation causes low yield in production (4.15), causes reduction in farm income and revenue ( = 4.13), increases frequency of floods and farms destruction ( = 3.80), increases frequency of drought and crop failures ( = 3.75), reduce cropping (growing) season (3.73), does not cause desertification ( 2.38), does not reduce soil fertility (2.35), does not increase the prevalence of diseases ( 2.34), does not increase pest invasion (= 2.32), does not reduce supply of raw materials (= 1.83). This implies that farmers are well aware of climate variation but they have unfavourable perception of climate variation. This is because food crop production is inherently sensitive to climate variability, and crop yield are predicted to decrease from the negative impacts of climate variation (Mark, 2011).
Result in Table 5 also showed that farmers disagreed that climate variation does not increases growth of weeds ( = 3.70), does not cause abrupt change in growing season (= 3.60), does not cause stunted growth in plants ( = 3.58), does not cause loss of water from the soil (= 3.53), causes post-harvest losses ( 2.22), causes extinction of crop and crop varieties (= 2.14), leads to food insecurity (= 1.99), increases the price of food crop production (= 1.94), and does not reduce supply of raw materials (=1.83). The result implies that such perception may be insufficiently understood despite the increasing frequency and magnitude of climate variation effect. Understanding climate variability issues encompasses high cognitive scientific knowledge, which most researchers and scientist possess (Ashworth et al., 2011). A study by Ashworth et al. (2011) showed that people were aware of climate variability but were uncertain and lack knowledge and understanding of its causes.
Table 5. Distribution of respondents’ according to their perceived effects of climate variation on food crop production.
| S/N | Statement | SA F (%) | A F(%) | U F (%) | D F (%) | SD F (%) | Mean |
| 1 | Climate variation causes low yield in production | 112(46.) | 92(38.3) | 11(4.6) | 11(5.8) | 14(5.8) | 4.15 |
| 2 | Climate variation causes reduction in farm income and revenue | 109(45.5) | 90(37.5) | 15(6.3) | 16(6.7) | 10(4.2) | 4.13 |
| 3 | Climate variation increases frequency of floods and farms destruction | 81(33.8) | 95(39.6) | 24(10.0) | 15(6.3) | 25(10.4) | 3.80 |
| 4 | Climate variation increases frequency of drought and crop failures | 86(35.8) | 73(30.4) | 41(17.1) | 15(6.3) | 25(10.4) | 3.75 |
| 5 | Climate variation reduces cropping (growing) season | 92(38.3) | 72(30.0) | 21(8.8) | 29(12.1) | 26(10.8) | 3.73 |
| 6 | Climate variation does not increase growth of weeds | 44(18.3) | 12(5.0) | 9(3.8) | 83(34.6) | 92(38.3) | 3.70 |
| 7 | Climate variation does not cause abrupt change in growing season | 49(20.4) | 19(7.9) | 5(2.1) | 74(30.8) | 93(13.8) | 3.60 |
| 8 | Climate variation does not cause stunted growth in plants | 53(22.1) | 17(7.1) | 2(0.8) | 73(30.4) | 95(39.6) | 3.58 |
| 9 | Climate variation does not cause easy loss of water from the soil | 46(19.2) | 22(9.2) | 21(8.8) | 60(25.0) | 91(37.9) | 3.53 |
| 10 | Climate variation does not cause desertification | 86(35.8) | 89(37.1) | – | 19(7.9) | 46(19.2) | 2.38 |
| 11 | Climate variation does not reduce soil fertility | 94(39.2) | 74(30.8) | 11(4.6) | 18(7.5) | 43(17.9) | 2.35 |
| 12 | Climate variation does not increase the prevalence of diseases | 82(34.2) | 82(34.2) | 20(8.3) | 24(10.0) | 32(13.3) | 2.34 |
| 13 | Climate variation does not increase pest invasion | 94(39.2) | 83(34.6) | 4(1.7) | 11(4.6) | 48(20.0) | 2.32 |
| 14 | Climate variation causes post-harvest losses | 33(13.8) | 19(7.9) | 11(4.6) | 80(33.3) | 97(40.4) | 2.22 |
| 15 | Climate variation causes extinction of crops and crop varieties | 9(3.8) | 13(5.4) | 30(12.5) | 85(35.4) | 103(42.9) | 2.14 |
| 16 | Climate variation leads to food insecurity | 20(8.3) | 11(4.6) | 17(7.1) | 90(37.5) | 102(42.5) | 1.99 |
| 17 | Climate variation increases the price of food crop production | 15(5.0) | 22(9.2) | 18(7.5) | 112(46.7) | 75(31.7) | 1.94 |
| 18 | Climate variation does not reduce supply of raw materials | 93(38.8) | 65(27.1) | 13(5.4) | 19(7.9) | 50(20.8) | 1.83 |
Source: Field Survey, 2020
Note: Grand mean score = 2.97 SA= Strongly Agreed, A= Agreed, D= Disagreed, U= Undecided, SD= Strongly Disagreed.
Table 6. Respondents’ current adaptation strategies in response to the effects of climate variation.
Result in Table 6 revealed that farmers agreed that they use herbicides to reduce the high rate of weed infestation ( = 4.43), pray to God ( = 4.33), carry out early planting of crops ( = 4.29), weed more frequently than before to put the increased weed under check ( = 4.13), harvest early when adverse dry weather is expected ( = 4.03), use different planting dates for the crops (= 3.92), undertake other non-farm income generating activities ( = 3.48), increase their farm size (= 3.44) as adaptation strategies in response to the effects of climate variation. The respondents to a large extent have been able to develop their adaptation strategies in a way that enables them to constantly cope and adapt to the varying climate condition. While noticing the manifestation of climate variation, respondents adopted these strategies and it has been helping their farming activities. They claimed that they did not learn the practices from anywhere but are indigenous to them.
Result in Table 6 also revealed that farmers disagreed that they do not apply indigenous knowledge in combating climate variability effects ( = 4.28), do not plant different varieties of crops ( = 4.26), do not increase the quantity of materials use for mulching ( = 4.25), use available credit facilities to increase their production ( = 2.24), apply pesticides to plants ( = 2.16), increased the planting of cover crops to reduce heat stress on crops ( = 2.13), secure insurance for their farm enterprise ( = 1.98), resort to information from agricultural extension agents to combat climate variability effects ( = 1.93), use more drought tolerant species of crops ( = 1.92), move to a better farm land ( = 1.79), do nothing ( = 1.75), increase the use of fallowing to enable my farmland replenish ( = 1.73), increase planting by the river side ( = 1.58), increase the use of farm yard manure to improve the soil fertility ( = 1.58), use weather forecasts ( = 1.46) and make use of the available irrigation facilities ( = 1.45) as adaptation strategies in response to the effects of climate variation. This implies that those adaptation strategies employed by respondents in response to the effects of climate variation may not be readily accessible and affordable because adaptation process is knowledge and resource intensive, it may not be implemented easily given the limited awareness and resource endowment of farmers. Respondents’ ability to adapt to the effects of climate variation depends on factors such as wealth, technology, education, information, infrastructure, access to resources and management abilities.
Table 6. Distribution of Respondents According to Current Adaptation Strategies in Response to the Effects of Climate Variation.
| S/N | Statement | SA F (%) | A F (%) | U F (%) | D F (%) | SD F (%) | Mean |
| 1 | I use herbicides to reduce the high rate of weed infestation | 152(63.3) | 66(2.5) | 1(0.4) | 14(5.8) | 7(2.9) | 4.43 |
| 2 | I pray to God | 116(48.3) | 100(41.7) | 10(4.2) | 10(4.2) | – | 4.33 |
| 3 | I carry out early planting of crops | 111(46.3) | 95(39.6) | 28(11.7) | 4(1.7) | 2(0.8) | 4.29 |
| 4 | I don’t apply indigenous knowledge in combating climate variability | 4(1.7) | 22(9.2) | 5(2.1) | 90(37.5) | 121(50.4) | 4.28 |
| 5 | I do not plant different varieties of crops | 4(1.7) | 4(1.7) | 14(5.8) | 121(50.4) | 97(40.4) | 4.26 |
| 6 | I do not increase the quantity of materials for mulching | 1(0.4) | 8(3.3) | 24(10.0) | 104(43.3) | 103(42.9) | 4.25 |
| 7 | I weed more frequently than before to put the increased weed under check | 105(43.8) | 115(47.9) | 3(1.3) | 8(3.3) | 9(3.8) | 4.25 |
| 8 | I increased the use of fertiliser | 108(45.0) | 95(39.6) | 8(3.3) | 17(7.1) | 12(5.0) | 4.13 |
| 9 | I harvest early when adverse dry weather is expected | 103(42.9) | 84(35.0) | 22(9.2) | 18(7.5) | 13(5.4) | 4.03 |
| 10 | I use different planting date for crops | 92(38.3) | 83(34.6) | 32(13.3) | 19(7.9) | 14(5.8) | 3.92 |
| 11 | I undertake other non-farm generating activities | 85(35.4) | 68(28.3) | 33(13.8) | 26(10.6) | 28(11.7) | 3.65 |
| 12 | I increase reliance on family labour to reduce cost of production | 68(28.3) | 60(25.0) | 52(21.7) | 38(15.8) | 22(9.2) | 3.48 |
| 13 | I increase my farm size | 85(35.4) | 69(28.8) | 7(2.9) | 24(10.0) | 55(22.9) | 3.44 |
| 14 | I use available credit facilities to increase my production | 17(7.1) | 18(7.5) | 41(17.1) | 93(38.8) | 71(29.6) | 2.24 |
| 15 | I apply pesticides to plants | 18(7.5) | 48(20.0) | 4(1.7) | 54(22.5) | 116(48.3) | 2.16 |
| 16 | I increase the planting of cover crops to reduce heat stress on crops | 5(2.1) | 38(15.8) | 29(12.1) | 82(34.2) | 86(35.8) | 2.13 |
| 17 | I secure insurance for my farm enterprise | – | – | 59(24.6) | 116(48.3) | 65(27.1) | 1.98 |
| 18 | I resort to information from agricultural extension agents to combat climate variability effects | 12(5.0) | 14(5.8) | 24(10.0) | 84(35.0) | 106(44.2) | 1.93 |
| 19 | I use more drought tolerant species of crops | 2(0.8) | 4(1.7) | 54(22.5) | 92(38.3) | 88(36.7) | 1.92 |
| 20 | I move to a better farmland | 8(3.3) | 8(3.3) | 28(11.7) | 77(32.1) | 119(49.6) | 1.79 |
| 21 | I do nothing | 14(5.8) | 3(1.3) | 3(1.3) | 108(45.0) | 112(46.7) | 1.75 |
| 22 | I increase the use of fallowing to enable my farmland replenish | – | 2(0.8) | 37(15.4) | 96(40.0) | 105(43.8) | 1.73 |
| 23 | I use more pest and disease resistance species of crop | 11(4.6) | 3(1.3) | 18(7.5) | 85(35.4) | 123(51.3) | 1.73 |
| 24 | I increase planting by the river side | – | – | 30(12.5) | 78(32.5) | 132(55.0) | 1.58 |
| 25 | I increase the use of farm yard manure to improve soil fertility | 3(1.3) | 7(2.9) | 6(2.5) | 92(38.3) | 132(55) | 1.58 |
| 26 | I use weather forecasts | 5(2.1) | 5(2.1) | 4(1.7) | 67(27.9) | 159(66.3) | 1.46 |
| 27 | I make use of the available irrigation facilities | – | – | 2(0.8) | 103(42.9) | 132(56.3) | 1.45 |
Source: Field Survey, 2020
Note: Grand mean score = 2.90. SA= Strongly Agreed, A= Agreed, D= Disagreed, U= Undecided, SD= Strongly Disagreed.
Hypothesis Testing
Hypothesis 1 (H01):There is no significant association between socio-economic characteristics of respondents and perceived effects of climate variability.
The result of Chi-square analysis as presented in Table 7 showed that there was a significant association between membership of social organisation (χ² = 19.36, p ≤ 0.05), marital status (χ² = 38.48, p ≤ 0.05) of the respondents and perceived effects of climate variation. But there was no significant association between sex (χ² = 4.88, p < 0.05), education (χ² = 5.40, p < 0.05), and religion (χ² = 11.42, p < 0.05). This implies that climate variability is influenced by membership of social organisation and marital status. Respondents could easily mobilise and have access to information towards adopting one innovation or the other to solve problems which might arise from climate variability (Apata and Adekunmi, 2013). Farmers who are single could easily acquire climate variation adaptation strategies than their married counterpart. Married farmers had to consider their family welfare before investing on climate variation adaptation strategies.
The Pearson Product Moment Correlation (PPMC) in Table 7 shows that farm size (r = 0.27, p ≤ 0.05) and farming experience (r = 0.20, p ≤ 0.05) had a significant association with perceived effects of climate variability. This implies that farm size and years of farming experience of the farmers influence climate variation adaptation strategies. Farmers with large farm size adopted climate variation adaptation strategies more than their counterparts with smaller farm size. As one farms for a reasonable period of time, he tends to gather more experience on climate variation (Apata and Adekunmi, 2013). There is no significant association between age (r = 0.06, p < 0.05), income (r = 0.02, p < 0.05) and perceived effects climate variability. This implies that both old and young farmers utilize different adaptation methods on their farm.
Table 8: Chi-square Analysis of the Association between Respondents’ Personal Characteristics and the Perceived Effects of Climate Variability.
| Socio-economic versus perceived effects of climate variability | Chi-square calculated value | df | p-value | Decision |
| Sex | 4.88 | 1 | 0.56 | Not significant |
| Education | 5.40 | 6 | 0.49 | Not significant |
| Marital status | 38.48 | 4 | 0.03 | Significant |
| Religion | 11.42 | 2 | 0.49 | Not significant |
| Membership of social organisation | 19.36 | 1 | 0.04 | Significant |
Significant at 0.05, df = degree of freedom
Source: Field survey; 2020
Table 9: Pearson Product Moment Correlation of the Association Between Socio-Economic Characteristics and the Perceived Effects of Climate Variability.
| Socio-economic versus perceived effects of climate variability | r-value | p-value | Decision |
| Age | 0.06 | 0.33 | Not significant |
| Income | 0.02 | 0.98 | Not significant |
| Farm size | 0.27 | 0.00 | Significant |
| Farming experience | 0.20 | 0.00 | Significant |
Significant at 0.05
Source: Field survey; 2020
Hypothesis 2 (H02):There is no significant relationship between farmers’ sources of information on climate variability and the perceived effects of climate variability. The result of Pearson Product Moment Correlation (PPMC) in Table 10 revealed a non-significant relationship between farmers sources of information (r = 0.090, p < 0.05) and perceived effects of climate variation. This implies that farmers will continue to perceive the effects of climate variation regardless of whether they obtain information or not. This is because some agricultural related technology information may not be available for the farmers to make farming decision which could contribute to increasing production, reduced environmental impacts and improved livelihood (FAO, 2019).
Table 10. Relationship between Farmers Sources of Information and Perceived Effects of Climate Variability.
| Farmers sources of information versus perceived effects of climate variability | r – value | p – value | Decision |
| Farmers sources of information and perceived effects of climate variability | 0.090 | 0.172 | Not Significant |
Significant at 0.05
Source: Field survey; 2020
Hypothesis 3 (H03):There is no significant relationship between farmers’ awareness about climate variability and perceived effects of climate variability.
The result of Pearson Product Moment Correlation (PPMC) in Table 11 revealed a positive and significant relationship between farmers awareness about climate variability (r = 0.142, p ≤ 0.05) and perceive effects of climate variation. This implies that the more the farmers are aware about climate variability, the effects of climate variability also increases. This might be attributed to the complexity in understanding climate variability by ordinary farmers which according to Ensor and Berger (2009) are influenced by level of education. This is in agreement with Emmanuel (2017) that farmers seem to be aware of changes in weather and climate but largely fail to contextualize a clear relationship between global warming and the envisaged impacts in their respective localities.
Table1 11: Relationship between Farmers’ Awareness about Climate Variability and Perceived Effects of Climate Variability.
| Farmers awareness about climate variability versus perceived effects of climate variability | r – value | p-value | Decision |
| Farmers awareness about climate variability and perceived effects of climate variability | 0.142 | 0.028 | Significant |
Significant at 0.05
Source: Field survey; 2020
SUMMARY, CONCLUSION AND RECOMMENDATIONS
The study examined the effects of climate variation on food crop production in southwest Nigeria. The study revealed that the mean age of the farmers in the study area was 44 years and predominant household size was that of 1-5 persons. Majority (65 percent) of the respondents were males. Large percentage (83.3 percent) were married, 90.4 percent of the farmers were literate while non-literate was 9.6 percent. 47.9 percent of the respondents identified radio as their major source of information on climate variation. The result from the study revealed that there was a significant association between membership of social organisation (χ² = 19.36, p ≤ 0.05), marital status (χ² = 38.48, p ≤ 0.05) of the respondents and the perceived effects of climate variability. Similarly, findings revealed that there was a significant association between farm size (r = 0.27, p ≤ 0.05), farming experience (r = 0.20, p ≤ 0.05) of the respondents and perceived effects of climate variability. There was no significant relationship between farmers’ sources of information (r = 0.090, p < 0.172) and perceived effects of climate variation. There was a positive and significant relationship between farmers awareness about climate variability (r = 0.142, p ≤ 0.05) and perceived effects of climate variation.
The study showed that there were variations in climatic parameters (temperature, rainfall and extreme climatic events) over the past five years of study (2015-2019). There was also variation in the output of crops under study (Cassava, yam and maize) during the same period with cassava having the highest output mean value of 4145.7kg/ha, this was closely trailed by maize having the mean value of 3449.9kg/ha and yam having the lowest output mean of 1220.8kg/ha. From the result of the analysis, it was concluded that climate variability had a 16.7% effect on maize, 44.0% effect on cassava and 69.9% effects on yam in Ogun and Ondo state during the five years of study. However, the empirical evidence established strong credibility that climate variability adversely had impact on production of major food crops in Ogun and Ondo state. The research also shows that some other factors affect the output of crops in Ogun and Ondo state Nigeria. On the basis of the findings of the study, the following measures are recommended.
- There is need to make food crop farmers participate in programmes that address adaptation policies in the country.
- For food crop farmers to be more efficient technically, government and non- government organisation should help them in the provision of input-based adaptation strategies (e.g multiple crop varieties) so that their production can be enhanced.
- Research institution should come up with measures in which the rural/local farmers will be able to cope with climate variation challenges.
- More extension agents should be posted to the local communities to educate people on climate variation and measures to get adapted to climate variation challenges and
- Government should focus on provision of functional credit facilities to help the food crop farmers in the area of climate variation adaptation especially the input based ones.
REFERENCES
- Agbaje, B.I. and Oladapo, E.O. (2019). Recent changes in the temperature and rainfall conditions over kaduna state Nigeria. Ghana Journal of Geography Vol. 11(2), Pages 127-158.
- Amikuzuno, J. and Donkoh, S. A. (2012). Climate variability and yields of major staple food crops in northern Ghana, African Crop Science Journal, Vol. 20 No. 2, pp. 349 – 360.
- Apata, O.M. and Adekunmi, A.O.(2013). Assessment of Knowledge level and adaptation strategies to effect of climate change by arable crop farmers in south western Nigeria. G.J.B.A.H.S., vol.2(1) 2013: 61-66
- Ashworth, P., Jeanneret, T., Gaedner, J., and Shaw, H. (2011). Communication and climate change: What Australian public thinks National Research Flagships Energy Transformed, CSIRO (http: //www.csiro.au)
- Ayanlade, A., Radeny, M. and Akin-Onigbinde, A.I. (2018). Climate variability change and attitude to adaptation technologies: a pilot study among selected rural farmers’communities in Nigeria. Geo Journal 83, 319-331. http://doi-org/10.1007/s10708-017-9771-1.
- Building Nigeria’s Response to Climate Change (BNRCC),(2011). National Adaptation Strategies and Plan on Action Climate Change for Nigeria (NASP-CCN). Climate Adaptation Strategy Technical Reports, Ibadan, Nigeria.
- Ensor, J. and Berger, R. (2009). Understanding climate change adaptation: lessons from community-based approaches. Warwickshire, Uk: Practical Action Publishing.
- Emmanuel, E. (2017). Farmers’ Awareness and Understanding of Climate Change and Variability in Central Semi-arid Tanzania. University of Dar es Salaam Library Journal Vol 12, No 2 pp 124-138
- Faleyimu, O.I. and Oyebade, B.A. (2012). Land tenure motivations for sustainable forest conservation in southwest. Nigeria. Journal of Agriculture an Social Research (JASR) Vol. 12, No. 1, 2012 89.
- Food and Agricultural Organisation of the United Nation (FAO), (2019). Digital Technology in Agriculture and rural areas. Rome. Briefing paper.
- Francis, I.U.(2017). Impact of climate variability on yam production in Benue state: an empirical Analysis. International Journal of Innovative Research in Social Sciences Management Techniques IJIRSSSMT vol.4, No.2 September, 2017
- Kom, Z., Nethengwe, N.S. and Mpandeli, N.S. (2020). Determinants of small scale farmers’ choice and adaptive strategies in response to climate shocks in Vhembe District, South Africa. Geo Journal. http://doi-org/10.1007/s10708-020-10272-7.
- Maponya, P. and Mpandeli, S. (2012). Climate change and agicultural productionin south Africa: impacts and adaptation options.
- Mark, D. (2011). Climate change and Thailand: Impact and response contemporary southeast Asia, 33(2), pp. 229-258
- Obot, N., Emberga, T., Ishola, K.S. (2011). 22 Years of characterise trends of rainfall in Abeokuta, Nigeria. Res. J. Appl. Sci.6(4):264-271.
- Okeowo. T.A., Ogunbameru, A.J., and Ogunyemi,O.I.(2015). The effects of rainfall variability in maize production in Lagos state Nigeria. Nigeria Journal of Agricultural Economics (NJAE). Volume 5(1), 2015: page 12-16
- Okunlola, J.O., Adekunle, V.A.J., Oke, D.O., Owolabi, K.E. (2018). Effects of climate change and copping strategies among crop farmers in South West, Nigeria. Agroforestry systems 93(8): 1-10.
- Okongor, G.C., Njoku, P., Efiong, J. (2021). Climate variability and yam production: Nesus and projections. Sarhad Journal of Agriculture 37(2):406-418.
- Ojo, J.S., Ajewole, M.O., Sarkar, S.K. (2018). Rain rate and rain attenuation prediction for satellite communication in ku and ka bands over Nigeria, ‘’ Prog. Electromag. Res. B. 5:207-223.
- Olaniran, O. (2019). Rainfall Anomalies in Nigeria. The Contemporary Understanding . Ilorin, Nigeria: Department of Geography, University of Ilorin.
- Ole, M., Kirsten, H.J., Jorgen, E., Olesen, K. (2019). Adaptation to climate change in developing countries. Environmental Management 43(5): 43-52.
- Ologeh, I.O., Akarakiri, J.B., Adesina, F.A.(2018). Constriants and limits to climate change adaptation efforts in Nigeria. Limits to climate change adaptation ,springe, chaw, pp 159-174.
- Olushola, F., Portia, A.W., Fairdan, S.N.(2019). Perceived livelihood impacts and adaption of vegetable farmers to climate variability and change in selected sites from Ghana, Uganda and Nigeria. Environment, Development and Sustainability 22, 6831-6849.
- Owusu, A.P. and Sarkodie, S.A. (2016). A review of renewable energy sources, sustainable issues and climate change mitigation, Cogent Engineering, 3:1, DOI:10.1080/23311916.2016.1167990.
- Philip, K.T., Polly, J.E. and Andrew, J.C. (2014). Climate variability and vulnerability to climate change: a review Glob Change Bio. 2014 Nov; 20(11): 3313-3328.
- Robert, I. (2009). The capability approach: a theoretical survey, Journal of human development, Vol.6 No.1, pp.93-117.