
Evaluation of Physiochemical Qualities and Microbiological Profile of Selected Hand Dug Well in Ado – Ekiti.
- Falade Joseph Damilola
- 1196-1209
- May 18, 2023
- Psychology
Evaluation of Physiochemical Qualities and Microbiological Profile of Selected Hand Dug Well in Ado – Ekiti.
Falade Joseph Damilola
Department of Geography and Planning Science, Faculty of the Social Sciences, Ekiti State University, Ado – Ekiti, Nigeria
DOI: https://doi.org/10.47772/IJRISS.2023.7499
Received: 31 December 2022; Revised: 10 March 2023; Accepted: 15 April 2023; Published: 18 May 2023
ABSTRACT
Water is vital and one of the most important resources to the survival of all livings (both plants and animals). About 97% of the world’s 1.4 billion Cubic km of water is ocean water. Quality water is essential for economic development and ecological balance. However, the scarcity of water is on the increase, hence the need for proper and adequate planning, standard monitoring and proper management of water as one of natural resources. This research evaluates the effect of anthropogenic activities and domestic wastes on surface water quality in Ekiti State University Students’ Residential Area. The study determines water contaminants and the effects of water contamination to the health of students and all other residents in the study area. Primary and secondary sources of data collection were employed in the study. A total of 18 water samples (nine for microbial and physiochemical testing respectively) were obtained from the study area for laboratory analysis where physiochemical and microbiological tests were conducted. For the physiochemical tests, the organoleptic parameters include colours, turbidity, and odours, while the inorganic parameters include nitrate, Conductivity, pH, total dissolved solid, total hardness, total alkalinity, total acidity, chloride, Sulphate (SO4 ), Calcium, Magnesium (Mg +2 ), Arsenic (As), Cadmium (Cd), Chromium (Cr 6+), Copper (Cu+2 ), Iron (Fe+2 ), Lead(Pb), Manganese(Mn+2), Zinc (Zn), Dissolved Oxygen, Total Suspended Solid. Color and Odour of all samples were unobjectionable, pH values ranged from 6.03 – 6.17 with mean of 6.50, Conductivity values ranged from 135.4 – 607µs/cm with a mean value of 282µs/cm, turbidity values ranged from 1.0 – 8.0 NTU with the mean value of 3.8, Total Dissolved Solid (TDS) concentrations ranged from 30.5 – 376 mg/L having a mean of 180 mg/L, Total Hardness , Alkalinity and Total Hardness had respective values which ranged from 26.9 – 102.4 mg/L and 29.4 – 122 mg/L with the mean of 63mg/L and 75g/L respectively, chloride, Sulphate (SO4), Calcium, Magnesium(Mg+2), Arsenic(As), Cadmium (Cd), Chromium (Cr6+), Copper (Cu+2), Iron (Fe+2), Lead(Pb), Manganese(Mn+2), Zinc (Zn), Dissolved Oxygen values ranged from 3.24mg/L to 5.86mg/L, Total Suspended Solid values ranged from 0.058mg/L to 0.628mg/L. All the parameters were lower than limit as recommended by the World Health Organization (WHO) and Nigerian Standard for Drinking Water Quality (NSDWQ).
Keywords: Microbial Parameters, Physiochemical Parameters, Water Quality, Heavy Metals, Anthropogenic Activities
INTRODUCTION
One of the most essentials of life is water, either to man, plants and other animals. Man requires water for many purposes apart from drinking, washing and body functions. Water is an indispensable natural resource on earth. All life including humans and ammonal depends on water. Water is essential for the development and maintenance of the dynamics of every facet of the society. (Oyebode et al, 2015).
Water is one of the important resources to man as it is determined, this shows the need for water for the survival of both plants and animals. Ayoade and Oyebade (1987) affirmed that 97% of the world 1,400,000,000 Cubic kilometre of water is ocean water. Water, most especially quality one, is essential for ecological balance and economic development. Scarcity of water is on the increase; hence the need for adequate and proper planning, advanced monitoring and careful management of water as a natural resource (Bamgbose and Arowolo, 2007). Water is one of the essential elements for human survival, it occupies over 71% of the total earth’s surface, yet a dangerous and fast-spreading element in the transmission of diseases (Falade, 2019).
Good, potable and quality water is becoming scarce as human population continues to grow and demand for high quality water for domestic purposes and economic activities, (Bamgbose and Arowolo, 2007). Surface Water quality, measured by assessing the physicochemical, physical and biological properties of water against a set of standards, is used to determine whether water is suitable for human consumption, uses or safe for the environment (Bamgbose and Arowolo, 2007).
Water has many uses which includes its uses for domestic and industrial purposes, agricultural and hydro-electric power generation and production, mining and forestry activities, cause deterioration of water and its quality and quantity.
Anthropogenic activities and dumping/disposal of wastes in places around the water bodies also results to surface water quality contamination, water may also be contaminated by micro-organisms e.g. the presence of fecal coliform, protozoa, coliform bacterial etc. when its store in large quantities for prolonged period of time without been treated, this can cause health problem (WHO, 2004; Shelton, 2003; Onyeagba and Isu, 2003), this shows a correlating and peculiar relationship between health, diseases causation and water.
Nigeria is one of the nations of the world that adopted Millennium Development declaration with its main objective of poverty reduction (UNDP, 2008). This has resulted in prioritizing an advanced access to improved water demand and supply. Prior research has revealed that access to clean water, sanitation and hygiene are the significant elements for poverty alleviation (Water Aid, 2009). According to an ADF (2005) report, the Millennium Development Goals (MDG) objective of Nigeria is to increase the safe water sources coverage from 2004 levels of 25% water supply and 8% sanitation to 62% for water supply and 54% sanitation by 2020. As a consequence, governmental and nongovernmental organizations made efforts to construct improved sources to provide access to safe and potable drinking water. Despite these efforts, improved water sources are often located far from user households, and due to the undulating nature of the country. It is common that people who are most vulnerable to water-borne diseases are those who use polluted drinking water sources. (ADF, 2005)
Bankole in 2015 also submitted that Ekiti State Government and some non-governmental organizations’ efforts in the State, a large percentage of the water supply schemes are malfunctioning, forcing residents of the state to use unprotected sources that pose health hazards, diseases and problems and which thus seriously affect their health and productivity. It is necessary to ensure that the water supply and sanitation services are available, potable, affordable and reliable. Consequently, water borne diseases related cases has been seen to be the cause of many health hazards. Hence there is need to ascertain the physical, chemical and biological quality of water to ascertain whether it is safe for human consumption (WHO, 2004; EPA, 2002).
According to the Directorate of ICT Ekiti State University, the population of students is not defined as at 2019/2020 academic session, but as at 18th March 19, 2020, not less than 9,000 students have registered on the University portal. Ekiti State University page of Wikipedia as at 2019 shows Ekiti State University has the population of 25,000 undergraduates and 2,000 postgraduate students, judging by the figures provided by the ICT and Wikipedia (September, 2016), it is very clear the population of students is too cumbersome to the capacity of the accommodation provided by the management of the University, hence most of the students’ lives outside the University Community (Author’s Pilot Survey, 2020). As a result of the school management non – provision of water to students outside the university campus, water of different sources are used by the students to meet their domestic and other water uses.
MATERIALS AND METHODS
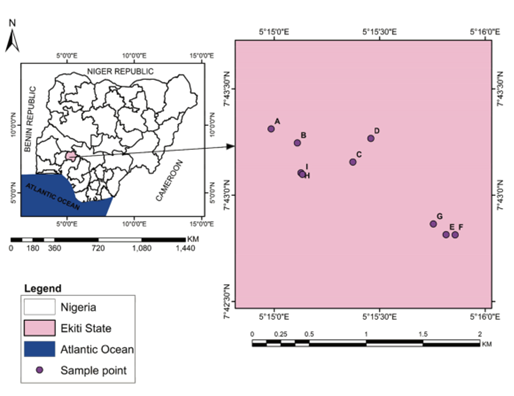
Ekiti State University is located in Ado-Ekiti which is known to be the political and administrative capital of the Ekiti State since 1996.. Ado Ekiti has evolved and continued to enjoy urban status and adequately qualify to be called a city as it reflects a political, economic, social and cultural identity than many modern urban areas lack. It is located between latitudes 7031l North and 7047l North of the equator and between longitudes 50 05l East and 5023l East of the Greenwich meridian (see figure 1). Ado Ekiti has length and breadth of 32kilometres and 28kilometres respectively and share boundaries with six (6) of the administrative divisions of Ondo State. It is about 199kilometres to the northern Ekiti and Erio to the north (43.5kilometres), Ijero to the north east (7.5kilometres), southern and south eastern to the south (59kilometres) and Western Ekiti of the west (9kilometres).
Figure 1: Study Location
Research Designs
Research designs according to Asika (2006), are plans set aside for the execution of a research project. Research design varies depending on the particular problem of the study. However, these studies adopts the use of case study research design and make use of both primary source of as its sources of data collection, i.e. water samples were collected from various points within the study area. Considering the nature, study aim and objectives, the merits/demerits of various approaches, laboratory analysis combined with observation were adopted.
Water Sampling
Before waters were samples, pilot survey was carried out to select the best location for samplings points using Garmin Geographical Positioning System. Water samples were collected from hand dug well source of water that are majorly used by the students and other residents. During the superficial survey, it was observed that some hostels do not have any source of water, some have but they only have water in it during rainy season. Due to this, there are some hostels with abundant water throughout the year, most especially the ones with hand dug well source of water. Our samples were taken from these types of well because a large number of students do fetch water there. As mentioned earlier that EKSU students’ areas are famous for residential and commercial activities of students, therefore it was significant to see the water quality and anthropogenic activities affecting water in such areas.
A total of Eighteen (18) samples (nine for physiochemical and microbiological tests respectively) were collected for laboratory analysis. The samples collected from hand dug wells only which were taken to the laboratory for analysis (see figure 1). Based on the water quality of the samples investigated, the status of the existing water quality was compared with the standards of the World Health Organization, 2004. The field work for the collection of water samples was carried out between the hours of 06:00am to 08:00am of Wednesday March 24th, 2021 to Thursday May 25th, 2021 all before the water is tempered by students.
Water Sources Characterization and Temperature Readings
Figure 1 shows detailed characteristics of all collected water samples, i.e. the location where the samples were collected usually the name of hostel, the code on the bottles used to collect sample, type of water source whether well, bore hole, stream etc., description of the water source whether its protected or not protected, the distance from the soak away or waste disposal areas, always in metres, the GPS location of water sources, usually Latitude and Longitude, taken with Garmin GPS device and also the temperature of each sample taken was taken with the use of a thermometer.
Table 1: Sources Characterization
| Location of Water Source | Sample Code | Type of Water Source | Description of the Water Source | Distance from Contaminated Area
(Metres) |
GPS Location of Water Sources | Temp.
(°C) |
||
| Waste | Soak Away | N | E | |||||
| Phase Two | A | Hand-Dug Well | Unprotected | 20 | 20 | 7° 43.311 | 5° 14.986 | 26 |
| Phase Two | B | Hand-Dug Well | Unprotected | – | 10 | 7° 43.245 | 5° 15.110 | 27 |
| Osekita | C | Hand-Dug Well | Unprotected | 5 | 14 | 7° 43.155 | 5° 15.373 | 27 |
| Osekita | D | Hand-Dug Well | Unprotected | – | 14 | 7° 43.266 | 5° 15.458 | 26 |
| School Gate | E | Hand-Dug Well | Unprotected | 3 | 12 | 7° 42.814 | 5° 15.815 | 27 |
| School Gate | F | Hand-Dug Well | Unprotected | 3 | 15 | 7° 42.813 | 5° 15.858 | 27 |
| School Gate | G | Hand-Dug Well | Unprotected | – | 1 | 7° 42.864 | 5° 15.755 | 27 |
| Satellite | J | Hand-Dug Well | Unprotected | 2 | 4 | 7° 43.104 | 5° 15.127 | 27 |
| Satellite | K | Hand-Dug Well | Unprotected | 3 | 3 | 7° 43.097 | 5° 15.134 | 28 |
Physiochemical Test and Parameters
The assessment of selected physicochemical parameters, namely pH, Turbidity, TDS, COD, DO, TOC, Electrical Conductivity, TSS, Total Alkalinity, Sulphate, Nitrate, Magnesium, Manganese and Heavy Metal Concentrations (Iron, Copper, lead, Nickel, and Zinc) were carried out as per the method described in APHA and guide manual. The instruments used were in the limit of precised accuracy, (APHA, 1985) (See table 2 and 3)
The chemicals used were of AR grade. Due care was taken during sampling to avoid any possibility of contamination. Temperature was measured in situ by the use of Glass Thermometer (Mercury). Known buffer solutions of pH 4, pH 7, and pH 10 were prepared and used to standardize the equipment, and the pH readings of the water samples were immediately taken before the laboratory analysis.
All field meters and equipment like Global Positioning System (GPS), Measurement Tape, Camera and thermometer were inspected and calibrated according to the manufacturer’s specifications and instructions. Sampling bottles were sterilized with the use of methylated spirits. Total dissolved solid was determined by subtracting the values of the suspended solids from the corresponding total solids of the samples. Alkalinity values are determined by titration methods. 50 ml of the water samples was taken in a clean 150 mL conical flask, and three drops of the phenolphthalein indicator were added.
After that, it was titrated with 0.05m H2SO4 until colour disappeared. To the colourless solution, three drops of the Methyl orange indicator were added and titrated further until colour changed from yellow to permanent reddish or orange red, and then titrevalues were recorded, and alkalinity was calculated.
Dissolved Oxygen was determined using Azide modification of Winkler’s method. 200 mL of the water sample was carefully transferred into a 300 ml BOD bottle. 1 mL of manganese sulphate solution was added followed by 1 mL of the alkaline alkali-iodide-azide reagent. The resulting mixture was titrated against 0.025 N sodium thiosulphate to the end point where there was colour change. The titre value was recorded as DO.
Heavy metal concentration was determined analytically and spectrophotometrically and its results were correlated and compared with the World Health Organization Standard.
Table 2: Chemical /Inorganic Analysis
| PARAMETERS | UNIT | A | B | C | D | E | F | G | J | K | LIMIT |
| Nitrate | mg/L | 0.64 | 0.52 | 0.45 | 0.76 | 0.92 | 1.08 | 1.22 | 0.86 | 1.02 | 15 |
| Conductivity | µS/cm | 178.0 | 135.4 | 241 | 238 | 228 | 319 | 607 | 368 | 221 | 500 |
| Ph | – | 6.12 | 6.32 | 6.03 | 6.62 | 6.78 | 6.95 | 6.98 | 6.22 | 6.50 | 6.5-8.5 |
| TDS | mg/L | 132.0 | 96.1 | 171.5 | 172.8 | 30.5 | 223 | 376 | 261 | 153.8 | 500 |
| Total Hardness | mg CaCO3 /L | 63.7 | 58.8 | 29.4 | 44.1 | 117.6 | 83.3 | 122.0 | 93.1 | 58.8 | 100 |
| Total Alkalinity | mg CaCO3 /L | 44.4 | 52.8 | 34.8 | 26.9 | 88.4 | 48.9 | 102.4 | 92.6 | 76.8 | 100 |
| Total Acidity | mg CaCO3 /L | 10.20 | 5.20 | 12.48 | 8.20 | 4.80 | 3.90 | 5.30 | 16.40 | 10.90 | 100 |
| Chloride | mg/L | 3.82 | 2.64 | 4.25 | 3.86 | 4.20 | 6.90 | 12.80 | 9.56 | 5.80 | 250 |
| Nitrate(NO2) | mg/L | 0.64 | 0.52 | 0.45 | 0.76 | 0.92 | 1.08 | 1.22 | 0.86 | 1.02 | 5.0 |
| Sulphate(SO4) | mg/L | 3.50 | 3.60 | 4.10 | 4.40 | 2.90 | 3.10 | 4.20 | 5.18 | 3.90 | 100 |
| Calcium | mg/L | 19.2 | 34.3 | 12.3 | 9.80 | 14.7 | 9.80 | 49.0 | 19.6 | 19.2 | 100 |
| Magnesium(Mg+2) | mg/L | 7.6 | 3.2 | 5.6 | 4.2 | 7.8 | 3.8 | 16.8 | 8.3 | 3.2 | 3.0 |
| Arsenic(As) | mg/L | N.D. | N.D. | N.D. | N.D. | N.D. | N.D. | N.D. | N.D. | N.D. | 0.01 |
| Cadmium (Cd) | mg/L | N.D. | N.D. | N.D. | N.D. | N.D. | N.D. | N.D. | N.D. | N.D. | 0.003 |
| Chromium (Cr6+) | mg/L | N.D. | N.D. | 0.02 | N.D. | 0.09 | N.D. | 0.12 | 0.08 | N.D. | 0.05 |
| Copper (Cu+2) | mg/L | 0.02 | N.D. | N.D. | 0.03 | 0.10 | 0.06 | 0.18 | 0.06 | 0.04 | 1.0 |
| Iron (Fe+2) | mg/L | 0.63 | 0.28 | 0.45 | 0.73 | 1.80 | 1.20 | 0.85 | 0.52 | 0.36 | 0.3 |
| Lead(Pb) | mg/L | N.D. | N.D. | N.D. | N.D. | N.D. | N.D. | N.D. | N.D. | N.D. | 0.01 |
| Manganese(Mn+2) | mg/L | ND | ND | 0.02 | ND | 0.04 | 0.06 | 0.08 | 0.12 | 0.09 | 0.2 |
| Zinc (Zn) | mg/L | 0.13 | 0.08 | 0.08 | 0.15 | 0.12 | 0.17 | 0.23 | 0.34 | 0.12 | 3.0 |
| Dissolved Oxygen | mg/L | 4.45 | 5.86 | 5.02 | 4.98 | 4.04 | 4.18 | 3.40 | 3.24 | 5.28 | – |
| TSS | mg/L | 0.088 | 0.058 | 0.420 | 0.280 | 0.560 | 0.628 | 0.302 | 0.180 | 0.092 |
Data Analysis
Data for several physicochemical, heavy metal, and microbiological parameters were gathered for each sampling location. The data were analyzed using descriptive and inferential statistics with the World Health Organization standard being used as a comparison.
RESULTS AND DISCUSSION
pH
The pH of all water samples ranged from 6.03 – 6.17 with mean of 6.50. The mean value was not above the WHO (2011) permissible range of 6.5- 8.5 (see table 2). The results showed that water samples from the area were basic. Sample G recorded the maximum value while sample C recorded the least. This might be due to atmospheric influence which usually results from anthropogenic activities. High carbonate, bicarbonate and hydroxide might probably be responsible for the high hydroxide potential in Sample G. An increased pH can disrupt the body’s delicate balance, which can lead to the development of bacteria, viruses, fungi, yeasts and parasites (Eskawater, 2020)
Electrical Conductivity
The conductivities of the sampled hand dug well water were generally low with values ranging from 135.4 – 607 µs/cm with a mean value of 282µs/cm. This value was lower when compared with permissible level of 500 µs/cm.
Total Dissolved Solids (TDS)
Total Dissolved Solids (TDS) concentrations ranged from 30.5 – 376 mg/L having a mean of 180 mg/L. Sample G recorded highest electrical conductivity and total dissolved solid, while sample B recorded the lowest electrical conductivity and sample E recorded lowest total dissolved solids. These values were very low compared to the recommended value (500 mg/L) by WHO (2011) for drinking water. This is an indication that the tested water samples were good and could be used as potable water. The study showed that Sample G has the tendency to increase EC and TDS of water.
Well water quality is a function of the activities going on around its immediate location, soil and other factors (NSDQW, 2007).
Alkalinity and Total Hardness
Alkalinity and total hardness had respective values which ranged from 26.9 – 102.4 mg/L and 29.4 – 122 mg/L with the mean of 63mg/L and 75g/L respectively. Alkalinity and total hardness of the collected water samples were below the WHO permissible limit of 100 mg/L and 200 mg/L for drinkable water. Sample G also recorded the highest for alkalinity and total hardness probably as a result of anthropogenic activities (see table 2).
Sulphate and Chloride ranged from 2.9 – 5.18 mg/L and 2.64 – 12.8 mg/L with mean values of 3.9 and 5.9 mg/L respectively. The values were lowered compared with WHO (2011) permissible limit of 3.0 and 250 mg/L respectively. Sulfate minerals can cause scale buildup in water pipes similar to other minerals and may be associated with a bitter taste in water that can have a laxative effect on humans and young livestock. Elevated sulfate levels in combination with chlorine bleach can make cleaning clothes difficult. Sulfur-oxidizing bacteria produce effects similar to those of iron bacteria. They convert sulfide into sulfate, producing a dark slime that can clog plumbing and/or stain clothing. Blackening of water or dark slime coating the inside of toilet tanks may indicate a sulfur-oxidizing bacteria problem. Sulfur-oxidizing bacteria are less common than sulfur-reducing bacteria (Water Research Center, 2013).
Heavy Metals
The concentrations of Iron, Nitrate, Chromium and Lead were highest in sample G though lower than the recommended limits (NO2; 5.0mg/L, Cr6+; 0.05mg/L Pb; 0.01). An increased Nitrate values have no effects on adults but can cause Cyanosis and asphyxia (blue-baby syndrome) which is capable of affecting infants under three months (NSDQW, 2007). In this same vein, an increased Lead values would have caused cancer, interference with vitamin D Metabolism which will definitely affect mental development of infants, toxic to the central and peripheral nervous systems. An increase the values of Chromium are disastrous as it is capable of causing Cancer of any type (NSDQW, 2007).
The levels of heavy metals in sampled hand dug well also showed that the concentration ranged from 0.08 – 0.34 mg/L (Zn) with the mean of 0.15 mg/L; 0.28 – 1.8mg/L (Fe) with the mean of 0.8 mg/L; 12.3– 49 mg/L (Ca) with the mean of 20.9 mg/L; Lead (not detected) and not detected – 0.18mg/L (Cu) with the mean of 0.05 mg/L respectively. These mean values are however lowered compared with the WHO (2011) recommended limits for potable water with limits of 5.0 mg/L (Zinc), 0.3 mg/L (Iron), 75 mg/L (Calcium), 0.01 mg/L (Lead), 1.0 mg/L (Copper), 30 mg/L and mg/L respectively.
Zinc is an essential element, yet it gives undesirable astringent taste to water at levels above the standard limit (5.0 mg/L). The low level of Zinc in the analyzed water was probably due to the zero industrial and less heavy motor vehicular activities in the study area.
Magnesium and Manganese
Magnesium concentration was higher than the recommended limit of 3.0 mg/L, its parameter ranged from 3.2–16.8 mg/L and 7.5mg/L as its mean value. (WHO, 2011).
Magnesium concentration was high in all the water samples above the recommended limit (0.3 mg). Results showed that all students’ activities contributed to higher concentration of magnesium in the water samples. High concentration of magnesium has been associated with neurological disorder (Anna et al., 2018), showing the urgent need to pay close attention to type of water for drinking and manufacturer’s adherence to standards.
Dissolved Oxygen
DO is an important water quality parameter and it is an indicator of water contamination. A small amount of DO in water indicates microbial contamination or corrosion of chemical substances. The DO values of well water samples varied between 3.42 m/gL to 5.86m/gL which are all acceptable within WHO limits (500mg/L).
Table 3: Physical /Organoleptic Analysis
| PARAMETERS | UNIT | A | B | C | D | E | F | G | J | K | LIMIT |
| Colour | TCU | Clear | Clear | Clear | Clear | Clear | Clear | Clear | Clear | Clear | 15 |
| Odour | – | Odourless | Odourless | Odourless | Odourless | Odourless | Odourless | Odourless | Odourless | Odourless | Unobj |
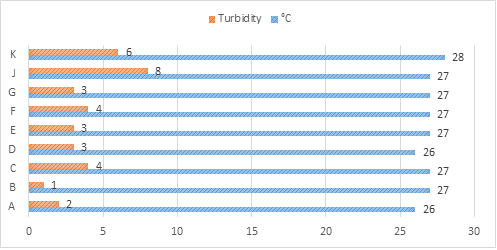
The result shown in table 3 shows the physical/organoleptic parameters of the physiochemical analysis, as experimented, all physical parameters such as colour, odour and appearance of the analyzed samples were unobjectionable. The temperature ranges from 26°C to 28°C, (see figure 2)
Turbidity
Turbidity values ranged from 1.0 – 8.0 NTU with the mean value of 3.8. This mean value was lower in comparison to the WHO limit of 5.0 NTU. High turbidity reflects the presence of particulate matter in the atmospheric air that is highly influenced by anthropogenic activities such as unorganized and wrong method of waste disposal. Low turbidity values recorded in this study might be due to the fact that the water were sampled from students’ communities with minimal or low mining activities or other major particulate producing anthropogenic activities (Ovrawah and Hymone, 2001). Although turbid water is not inherently unhealthy, it contains some kind of particles that are unhealthy to the life of living things (plants and animals). Some of these problematic particles can include metals or other types of sediment that can negatively affect human health, (Analytic Technology, 2012).
Figure 2: Turbidity and Temperature
Bacteriological Analysis
Total and faecal coliform bacteria are classified based on their characteristics and source. In the intestines of warm-blooded animals and humans, as well as bodily waste, animal droppings, and soil, Escherichia coli (E. coli) and other forms of coliform bacteria are naturally found. Because no faecal contaminants were discovered in the samples, (table 4) (A-K) are free of E. coli (faecal contaminants), indicating that the water sources are safe to drink. According to Adekunle et al, (2011), bacteria in groundwater can be caused by wells being close to waste dumps and toilets. Nausea, vomiting, diarrhoea, stomach pain, vapidity, and headaches are health concerns, which may develop from continued usage of groundwater without effective bacterial treatment.
Table 4: Microbiological Analysis
| PARAMETER | UNITS | A | B | C | D | E | F | G | J | K | LIMITS |
| Coliform | CFU/mL | 0 | 0 | 2 | 0 | 0 | 0 | 8 | 33 | 24 | 0 |
| E.coli | CFU/mL | 0 | 0 | 0 | 0 | 0 | 0 | 0 | 0 | 0 | 0 |
| Aerobic Mesophilic Count | CFU/mL | 11 | 0 | 16 | 21 | 2 | 7 | 13 | 238 | 29 |
The microbiological analysis of all collected water samples as shown in table 4 E. Coli is zero throughout which is not below or above the WHO limit 0. If E. Coli was high, it could caused Urinary track infections, bacteraemia, meningitis, diarrhea (one of the main cause of morbidity and mortality among children), acute renal failure and Haemolytic Anaemia (NSDQW, 2007).
In the same vein, Coliform values from Samples A, B, D, E and F is not more than WHO limit (0 CFU/mL) but Samples G (8.0 CFU/mL), J (8 CFU/mL) and K (24.0 CFU/mL) had their values more than WHO limits. According to WHO (2011), the reasons may be due to anthropogenic activities, dumping of waste materials close to the water source or an indication of faecal contamination. Also, as shown in table 3.1 (chapter three), the description of all water sources were unprotected.
Aerobic Mesophilic count values of the microbiological analysis varied from 0 CFU/mL to 238 CFU/mL.
SUMMARY OF FINDINGS
This research evaluates the effect of anthropogenic activities and domestic wastes on water surface quality of those areas where students resides in Ekiti State University.
By analyzing sampled waters, the major water contaminants in the study locations were determined. If we were to use mere observation to determine or assume that the activities of students and other residents in the study locations like unorganized waste disposal method, closeness of source of water to toilet or drainage etc, had contribute immense negative effects which leads to water pollution, making some sources of water unpotable and because most of the water sources were not protected, we will be wrong and inaccurate. Hence, there are needs for proper evaluation and examinations. All the parameters were lower than limit as recommended World Health Organization and Nigerian Standard for Drinking Water Quality, this shows great evidences that the water is good for drinking, and in carrying out other domestic activities.
The research also evaluates the effects of those contaminants to the health of students and considering various effects, the pH values were within WHO’s limit but an increased values could have caused body’s delicate balance, which can lead to the development of bacteria, viruses, fungi, yeasts and parasites. The concentrations of heavy metals like Iron, Nitrate, Chromium and Lead were lower than the recommended limits. An increased Nitrate values have no effects on adults but can cause Cyanosis and asphyxia (blue-baby syndrome) which is capable of affecting infants under three months.In this same vein, an increased Lead values would have caused cancer, interference with vitamin D Metabolism which will definitely affect mental development of infants, toxic to the central and peripheral nervous systems.
An increase the values of Chromium are disastrous as it is capable of causing Cancer of any type.
Magnesium concentration was high in all the water samples above the recommended limit (0.3 mg). Results showed that all students’ activities contributed to higher concentration of magnesium in the water samples. High concentration of magnesium has been associated with neurological disorder, showing the urgent need to pay close attention to type of water for drinking and manufacturer’s adherence to standards.
RECOMMENDATIONS
Having thoroughly examined the results presented above; I hereby make the following recommendations.
- Since all water samples have a very low acidic constant (pHs), it should be used for domestic purposes or dinking, it is potable.
- It has low Nitrate and Calcium constant, therefore it can be used for washing clothes since it has potentials of forming lather with soap that is to say that it is soft water.
- Even though it is potable, it should be more treated adequately either by boiling or by adding water treatment reagents like Chlorine.
- Subsequent and consistent surveillance and monitoring of the drinking water should be taken up by the appropriate local authorities even the school authority to ensure the maintenance of a good water quality.
- There should be an effective health education programme for the community of students to enlighten them on the effects of using contaminated water to human health.
- More of this study should be conducted at interval to ensure the effects of the evaluation of anthropogenic activities and domestic waste on water surface quality, either the undergraduates, postgraduates, school authority, as well as the State Government.
CONCLUSION
Water samples studied in different locations within study area revealed that almost all of the physiochemical parameters and microbiological indicators are in good status, expressing its suitability for drinking purpose.
In conclusion, assurance of drinking-water safety is a foundation for the prevention and management of waterborne diseases. Installation of good household water treatment gargets to boreholes, boiling and filtering of drinking-water as well as improved sanitary conditions and personal hygiene have been advocated for. The Government School authority and concerned landlords and landladies, as well as all the occupants should as a matter of urgency ensure gross reduction in the level of pollution of waters through routine evaluation and monitoring of groundwater and anthropogenic activities within the students’ community.
The importance of regular monitoring of hand dug well water and all other sources of drinking water are emphasized.
ACKNOWLEDGEMENTS
The author acknowledge the authority of Ekiti State University, Nigeria, for providing platform for carrying out this study.
Compliance with Ethical Standard
This study is an original work conducted by the author and has not been published anywhere neither is it under review.
Disclosure statement
No potential conflict of interest was reported by the author.
Author’s ORCID
https://orcid.org/0000-0002-0272-9765
REFERENCES
- Alamgir, M. A. Khan, J. Schilling, S. S. Shaukat, and S. Shahab (2016) Assessment of groundwater quality in the coastal area of Sindh province, Pakistan Environmental Monitoring and Assessment, vol. 188(2)78-85
- Adamolekun O.S. (2016). Access to improved water supply for domestic use in Ootunja in Ikole Local Government, Ekiti State. Pp 28 – 31: unpublished M. Sc projected submitted to Water Resources Department, FUTA.
- Addiscott T.M and Benjamin N, (2004). Nitrate and human health. Soil Use and Management 20: 98–104. Environmental Monitoring Assess, Springer Business Mediapp. 473- 478
- Addisie M. (2012), Assessment of drinking water quality and determinants of household- potable water consumption in Simada district, Ethiopia, Ethiopian Journal of Health Development (8):114-123
- Admasu M., Kumie A. and Fentahun M. (2003), Sustainability of Drinking Water Supply Projects in Rural of North Gondar, Ethiopia, Ethiopian Journal of Health Development (3):221-229.
- African Development Fund (ADF) (2005), Ethiopian rural water supply and sanitation appraisal report. Infrastructure department north, east and south Onin Agriculture and Rural Development. Cornell University, Ithaca NY USA. Dietrich A.M
- African Development Fund (ADF) (2005), Ethiopian rural water supply and sanitation appraisal report. Infrastructure Department North, East and South Onin Agriculture and Rural Development. Cornell University, Ithaca NY USA. Dietrich A.M
- Ajewole, G. (2005). Water an overview: Nigerian Institute Food Science Technology, 4: 15.
- Anna, E; Kirkland, GLS; Kathleen FH (2018). . The Role of Magnesium in Neurological Disorders, Nutrients, 10(6): 730. Ethiopian, J. Health Dev. (3) (3):221-230.
- APHA, (1985), Standard Methods for Examination of Water and Wastewater, 20th Edition, American Public Health Association, Washington D. C.
- Asika, N. (2006). Research Methodology in Behavior Sciences. Longman Nigeria Plc, Lagos.
- AWWA. (1990), Water Quality and Treatment (4th edition). Published for American Water Works Association by McGraw-Hill Inc.
- AWWA. (2004), Problem Organisms in Water: Identification and treatment – manual of water supply practices. AWWA Manual M7. Denver CO: American Water Works Association.
- AWWA. (2014), Groundwater: Manual M21 (4th edition). Denver CO: American Water Works Association. Cat No. 30021-4E, 296 pp.
- Ayoade J.O. and Oyebade B.L. (1978) Water Resources: In Oguntoyinbo J.S., Areola .O. and Filani. J. (eds). A Geography of Nigerian Development. Ibadan, Heinemann Educational books (Nig). Ltd.
- Bamgbose, O.O. and Arowolo, T.A. (2007) Water Quality Assessment of Ogun River, South West Nigeria. Environmental Monitoring Assess, Springer Business Mediapp. 473- 478.
- Bankole B.O. (2006): A Geographical Analysis of the Distribution of Selected Rural Infrastructure in Ekiti State, Nigeria; An Unpublished Phd Thesis, University of Ado-Ekiti (Now Ekiti State University).
- Baroni L, Cenci L, Tettamanti M, Berati M. (2007). Evaluating the environmental impact of various dietary patterns combined with different food production systems. Europian Journal of Clinical Nutrition. 61:279–286.
- Clasen T, Roberts I, Rabie T, Schmidt W, Cairncross S.(2006), Interventions to improve water quality for preventing diarrhoea. Cochrane Database System CD004794.
- Demeke A. (2009), Determinants of household participation in water resource management; Acheferworeda, Amhara region, Ethiopia.
- Doria 2010: https://iwaponline.com/wp/article-abstract/12/1/1/19560/Factors-influencing-public-perception-of-drinking?redirectedFrom=fulltext [Accessed Date; June 2021]
- Fathi, R. Zamani-Ahmadmahmoodi, and R. Zare-Bidaki (2018), Water quality evaluation using water quality index and multivariate methods, Beheshtabad River, Iran Applied Water Science,8(7), 210-222
- Environmental Protection Agency (EPA). (2001). Parameters of Water Quality: Interpretation and Standards. Published by EPA Ireland pp. 1- 132.
- EPA, (2002): Groundwater and drinking water. Current Drinking water standard united State Environmental Protection Agency, (EPA), 1-5pp.
- EPA, (2005): Protecting water quality from agricultural runoff, United State Environmental Protection Agency, fact sheet. No. EPA-841-f-05-001.
- Ezzati M, Hoorn SV, Rodgers A, Lopez AD, Mathers CD, Murray C.J. (2003), Estimates of global and regional potential health gains from reducing multiple major risk factors;362:271–280.Archived from the original on 2012-07-24. Retrieved 2011-08-09
- F. Misaghi, F. Delgosha, M. Razzaghmanesh, and B. Myers (2017). Introducing a water quality index for assessing water for irrigation purposes: a case study of the Ghezel Ozan River,” Science of the Total Environment, vol. 589, no. 4, pp. 107–116.
- Fewtrell L, Kaufmann RB, Kay D, Enanoria W, Haller L, Colford JM., Jr (2005), Water sanitation, and hygiene interventions to reduce diarrhoea in less developed countries: A systematic review and meta-analysis ;5:42–52, National Library of Medicine
- Global Water Supply and Sanitation Assessment Report (2000) WHO, United Nations Children’s Fund (UNICEF), and Water Supply and Sanitation Council, New York
- Health (Drinking Water) Amendment Act 2007″. Drinking Water.co.nz. Drinking water for New Zealand. 2007. Archived from the original on 2012-07-24. Retrieved 2011-08-09.
- https://en.wikipedia.org/wiki/Drinking_water_quality_standards (Accessed 2020-03-09)
- https://en.wikipedia.org/wiki/Ekiti_State_University (Accessed 2020-03-09)
- ISO (in preparation) Standard ISO 13164-2: Water quality—Measurement of the activity concentration of radon-222 and its short-lived decay products—Part 2: Direct measurement by gamma spectrometry. Geneva, International Organization for Standardization.
- ISO (in preparation) Standard ISO 13165-1: Water quality—Measurement of radium 226 activity concentration—Part 1: Liquid scintillation counting method. Geneva, International Organization for Standardization.
- Falade J. D. (2019): Field trip report on the physical and environmental settings of Ibadan region, submitted to the Department of Geography and Planning Science, EKSU. Available on Academia.edu.(https://www.academia.edu/41480404/physical_and_environmental_settings_of_ibadan_region_oyo_state)
- M. Kavurmaci and A. K. Üstün (2016), Assessment of groundwater quality using DEA and AHP: a case study in the Sereflikochisar region, Turkey Environmental Monitoring and Assessment,188(4)258
- M. Terrado, D. Barceló, R. Tauler, E. Borrell, S. D. Campos, and D. Barceló (2010), “Surface-water-quality indices for the analysis of data generated by automated sampling networks,” TrAC Trends in Analytical Chemistry, 29 (1) 40–52.
- Ochei, J.O. and Kolhatkar, A.A. (2007). Medical Laboratory Science: Theory and practice. MCGraw-Hill, New York, 637-745pp.
- Ovrawah, L; Hymone, F. K. (2001). Quality of water from hand-dug well in the Warri environs of Niger Delta. Afri. J. Environ. Stud. 2 (2),169-170.
- Oyedele, E.A. and Olayinka, A.I (2012): Statistical evaluation of groundwater potential f Ado-Ekiti, Southwest, Nigeria. Transnational Journal of Science and Technology, 2(6), 110-127
- Pauline, Y. (1960). Scientific social surveys and research 3rd ed. New York: prentice hall.
- Prüss-Üstün A, Bos R, Gore F, Bartram J. World Health Organization (2008). Safer water, better health: costs, benefits and sustainability of interventions to protect and promote health, Geneva
- Shabbir and S. S. Ahmad (2016), “Use of geographic information system and water quality index to assess groundwater quality in Rawalpindi and Islamabad,” Arabian Journal for Science and Engineering, 40 (7) 2033–2047.
- Das, M. Majumder, D. Roy, and A. Mazumdar (2010), “Determination of urbanization impact on rain water quality with the help of water quality index and urbanization index,” in Impact of Climate Change on Natural Resource Management, 131–142, Springer, Berlin, Germany.
- Schiffler M. (2002) Global Water and Food Scarcity: Are the Gloomy Prediction Right Agricultural and Rural Development Journal, 9(2)26-35.
- Sinton L. (1984). The macro invertebrates in a sewage-polluted aquifer, Hydrobiology 119: 161–9.
- Sinton L. (1986). A Guide to Groundwater Sampling Techniques. National Water and Soil Conservation Authority, Water and Soil Miscellaneous Publication No. 99.
- Stewart, F. (1985): Planning to meet basic Needs. London: The Macmillan Press.
- Ugwu, A.I., and Wakawa R.J. (2012). A Study of Seasonal Physicochemical Parameters in River Usman. American Journal of Environmental Science, 8 (5): 569-576.
- UN Millennium Development Goals. [Accessed June 2020]. Available at: http://www.un.org/millenniumgoals (Date of Accessed:30-6-2020)
- UN_2001:http://data.un.org/Glossary.aspx?q=Population#:~:text=Population%203%20definitions,of%20a%20country%20or%20area. (Date of Accessed:30-6-2020)
- UNEP (United Nations Environment Programme) (2002). Convention on Biological Diversity. United Nations.
- UNICEF (2008). Hand book on water quality. 3UN plaza, New York..
- World Bank (1997) Ghana Second Community Water and Sanitation Project in Support of the First Phar of the Community Water and Sanitation Programme: Project Appraisal Documents Report No. 19594, Ghana, August 5
- World Health Organization (2004). Guidelines for Drinking-water Quality, World Health Organization, Geneva.
- World Health Organization (WHO). (2004). Guidelines for Drinking Water Quality. 3rdedition, Recommendations, World Health Organization, Geneva, 1:1-8. (https://www.who.int/publications, Date of Accessed:30-6-2020)
- World Health Organization (WHO). Guideline for Drinking Water Quality (GDWQ), 2004
- World Health Organization (WHO).Guideline for Drinking- Water Quality Recommendation. 1, 2006. (https://www.who.int/publications, Date of Accessed:30-6-2020)
- World Health Organization (WHO). Guideline for drinking water quality 2nd Ed. Recommendation. World Health Organization general 1: 30-113, 2008. (https://www.who.int/publications, Date of Accessed:30-6-2020)
- www.landcareresearch.co.nz/science/soils-and-landscapes/ecosystem-services/factsheets
MEAN VALUE
| PARAMETERS | A | B | C | D | E | F | G | J | K | ∑FX | X̄ |
| Nitrate | 0.64 | 0.52 | 0.45 | 0.76 | 0.92 | 1.08 | 1.22 | 0.86 | 1.02 | 7.47 | 0.83 |
| Conductivity | 178 | 135.4 | 241 | 238 | 228 | 319 | 607 | 368 | 221 | 2535 | 281.7 |
| pH | 6.12 | 6.32 | 6.03 | 6.62 | 6.78 | 6.95 | 6.98 | 6.22 | 6.5 | 58.52 | 6.502 |
| TDS | 132 | 96.1 | 171.5 | 172.8 | 30.5 | 223 | 376 | 261 | 153.8 | 1617 | 179.6 |
| Total Hardness | 63.7 | 58.8 | 29,4 | 44.1 | 117.6 | 83.3 | 122 | 93.1 | 58.8 | 641.4 | 71.27 |
| Total Alkalinity | 44.4 | 52.8 | 34.8 | 26.9 | 88.4 | 48.9 | 102.4 | 92.6 | 76.8 | 568 | 63.11 |
| Chloride | 3.82 | 3.82 | 3.82 | 3.82 | 3.82 | 3.82 | 3.82 | 3.82 | 3.82 | 34.38 | 3.82 |
| Nitrate (NO2) | 2.64 | 2.64 | 2.64 | 2.64 | 2.64 | 2.64 | 2.64 | 2.64 | 2.64 | 23.76 | 2.64 |
| Sulphate (SO4) | 4.25 | 4.25 | 4.25 | 4.25 | 4.25 | 4.25 | 4.25 | 4.25 | 4.25 | 38.25 | 4.25 |
| Calcium | 3.86 | 3.86 | 3.86 | 3.86 | 3.86 | 3.86 | 3.86 | 3.86 | 3.86 | 34.74 | 3.86 |
| Magnesium (Mg+2) | 4.2 | 4.2 | 4.2 | 4.2 | 4.2 | 4.2 | 4.2 | 4.2 | 4.2 | 37.8 | 4.2 |
| Arsenic (As) | N.D. | N.D. | N.D. | N.D. | N.D. | N.D. | N.D. | N.D. | N.D. | 0 | 0 |
| Cadmium (Cd) | N.D. | N.D. | N.D. | N.D. | N.D. | N.D. | N.D. | N.D. | N.D. | 0 | 0 |
| Chromium (Cr6+) | N.D. | N.D. | 0.02 | N.D. | 0.09 | N.D. | 0.12 | 0.08 | N.D. | 0.31 | 0.034 |
| Copper (Cu+2) | 0.02 | N.D. | N.D. | 0.03 | 0.1 | 0.06 | 0.18 | 0.06 | 0.04 | 0.49 | 0.054 |
| Iron (Fe+2) | 0.63 | 0.28 | 0.45 | 0.73 | 1.8 | 1.2 | 0.85 | 0.52 | 0.36 | 6.82 | 0.758 |
| Lead (Pb) | N.D. | N.D. | N.D. | N.D. | N.D. | N.D. | N.D. | N.D. | N.D. | 0 | 0 |
| Manganese(Mn+2) | ND | ND | 0.02 | ND | 0.04 | 0.06 | 0.08 | 0.12 | 0.09 | 0.41 | 0.046 |
| Zinc (Zn) | 0.13 | 0.08 | 0.08 | 0.15 | 0.12 | 0.17 | 0.23 | 0.34 | 0.12 | 1.42 | 0.158 |
| Dissolved Oxygen | 4.45 | 5.86 | 5.02 | 4.98 | 4.04 | 4.18 | 3.4 | 3.24 | 5.28 | 40.45 | 4.494 |
| TSS | 0.088 | 0.058 | 0.42 | 0.28 | 0.56 | 0.628 | 0.302 | 0.18 | 0.092 | 2.608 | 0.29 |
| Turbidity | 2 | 1 | 4 | 3 | 3 | 4 | 3 | 8 | 6 | 34 | 3.778 |