
Human Capital Development, Employment and Economic Growth in Nigeria
- Gaius M. ASOMBO
- Dr. Gbatsoron ANJANDE
- Dr. Dennis Terpase NOMOR
- Andrew Avalumun SHEMBER
- Victor Ushahemba IJIRSHAR
- 52-64
- May 27, 2023
- Economics
Human Capital Development, Employment and Economic Growth in Nigeria
Gaius M. ASOMBO1, Dr. Gbatsoron ANJANDE2, Dr. Dennis Terpase NOMOR3, Andrew Avalumun SHEMBER4, and Victor Ushahemba IJIRSHAR5
2Department of Economics, University of Kampala, Kampala-Uganda
1, 3, 4, 5Department of Economics, Benue State University, Makurdi-Nigeria
DOI: https://doi.org/10.47772/IJRISS.2023.70506
Received: 09 April 2023; Revised: 22 April 2023; Accepted: 27 April 2023; Published: 27 May 2023
ABSTRACT
Human Capital Development has been the crux of any nation’s development and it has lasting benefits and spiral effects. Nigeria has witnessed increased economic growth without a corresponding increase in employment and human capital development indicators. It is on this ground that, the study set to examine the effect of human capital development on economic growth through employment in Nigeria from 1986-2021. The study is anchored on four theories viz; the Solow growth, the Keynes employment model, the Endogenous growth model, and Human Capital Theory. The study relies strictly on secondary data sources further, the study used descriptive and inferential statistics methods. Using the Augmented Dickey-Fuller test (ADF), stationarity test results show that all variables were stationary at first difference. The study further employed variance decomposition, impulse response Structural Vector Autoregressive (SVAR) model to test for Hypotheses. The study found a positive and weak transmission between human capital development and economic growth through employment the result is significant at 5% significant level. The study concluded that there is insufficient funding of human capital to spur economic growth through employment. Therefore the study recommends that government should increase expenditure on education and encourage and promote academic excellence with appropriate remunerations such as granting scholarships, employment, training, and re-training of excellent students.
Keywords: Human Capital, Employment And Economic Growth In Nigeria.
INTRODUCTION
In every country on the planet, human capital is regarded as a driver of national growth. One of the most important strategies to improve the quality of human resources is to provide education and other services to individuals. Development human, in addition to being socially important, supplies an economy with the healthy and trained human resources needed for job creation and overall economic growth. (Wakeel and Alani, 2015).
Academic and other research institutes in Europe and America demonstrate their social significance not only through esoteric research, but also by contributing to satisfying economic needs through job creation. However, in Africa, human capital development is given less relevance and as a result, Africa has remained underdeveloped. The countries of Africa constitute most of the poorest societies in the world as they show the lowest indicators of socio-economic development (World Bank, 1998). While the level of poverty in the continent has been attributed to many interrelated causes, the low level of human capital development has in the past decades begun to emerge as a major cause of Africa’s underdevelopment. It is also argued that the recent rapid economic development of the countries of Southeast Asia in the latter part of the 20th century has been due largely to their deliberate policy on human capital development through capacity building (Oni, 2000).
In recognition of the role of human capital development in employment generation and economic growth, Nigerian governments have worked hard throughout the years to ensure that the level of human capital development continues to rise. In absolute terms, government expenditure on education has increased. In Nigeria, for example, the education sector was funded for ₦18.402 million from 1970 to 1975. However, between 1976 and 1980, the education budget increased by almost 100 percent, from ₦18.402 million to ₦37.7 million (CBN, 2000). It rose to ₦58.733 million from 1981 to 1986. From 1987- 1991 education budgetary provisions rose to ₦75.279 million and recorded a phenomenal rise to ₦87.341 million from 1992-1995. It jumped to ₦102.285 billion between 1996 and 2000. From 2001 to 2008, it rose to ₦605.899 billion, about five hundred percent increase in seven years (CBN, 2013).
Thus, with effort demonstrated by the Nigerian economy in terms of economic growth the impact on employment still remain unclear. Sodipe and Ogunrinola (2011) viewed relationship between unemployment and several macroeconomic variables in Nigeria and it was concluded that the shift in the composition of unemployment in Nigeria since the year 2000 is very instructive, as it has highlighted the shortcomings of the accepted theory in explaining the unemployment phenomenon in Nigeria. Nigeria’s national unemployment statistics reflect this. The national unemployment rate fell marginally from 14.8 percent in 2003 to 13.4 percent in 2004, 11.9 percent in 2005, 14.6 percent in 2006, and then dropped significantly to 12.7 percent in 2007. In 2008, it increased by 14.9 percent, 19.7 percent in 2009, 21.4 percent in 2010, and 23.9 percent in 2011. (NBS, 2011). According to ILO (2010) and NBS (2011), graduate unemployment increased from 25.6 percent in 2003 to 38.0 percent in 2004, then remained stable at 32.3 percent in 2005, 32.2 percent in 2006, and 32.1 percent in 2007. It then increased to 37.5 percent in 2008, 39 percent in 2009, 43.5 percent in 2010, and 42.7 percent in 2011.
However, despite the immense efforts by the Nigerian government improve quality of people’s lives and human capital development; it has not yielded the desired results basically, this may be liken to institutional weakness and policy somersault among other societal ills. The increase in investment in education and other aspects of human capital development at all levels has not yielded the desired result in employment creation yet economic growth has over time maintained an upward trained (Kanayo, 2013). It is on this background that this study intends to examine the transmission of human capital development through employment on economic growth in Nigeria.
Conceptualisation
Economic Growth
This is viewed as the continuous increase in the production of economic goods and services, comparing at least two periods. It can be measured in nominal or real terms (adjusted for inflation). Increases in human capital, labour force, technology and capital goods can all contribute to economic growth.
Employment
This is the direct opposite of unemployment, it is an economic situation where a trained labour who is in active work force age bracket that is seeking for work and there is an opportunity for the labour to work and add economic value for the growth and development of the society.
Human Capital Development
Human capital refers to a country’s ability to improve its human resources, whereas human capital formation refers to the process of obtaining and expanding the number of people with the skills, education, and experience necessary for a country’s economic growth and development. It is a crucial aspect in transforming all resources to the benefit of humanity. Actual government education spending is used as a proxy for human capital development in this study.
Theoretical Review/Linkage
This research made use of four theories: these theories are; human capital model, Keynes employment model, endogenous growth models, and Solow’s growth model. However, the crux of this research is anchored on Keynes’s model. The human capital model stresses the fact that the decision to invest in human capital is based upon an examination of net present value of the cost and benefits of such an investment this implies that the national output must commensurate the investment in human capital. Further, this theory suggest that the benefit accrue from on human capital development should out run its cost thus the cost in this context refers to input factor incur in the course of training or developing human capital while the benefits connote the positive contributions of human to national economy this could be in terms of increase labour productivity and improve standard of living. Keynes model is the major theory which this research work hinged on, the theory emphases the link between effective demand, national income and national output, more so the theory stresses that investment in human capital should be efficient and effective to burst employment which in turn reflect in the national income. Thus, the theory pose that investing on human will enhance or increase effective demand this will result to increased aggregate demand hence increase national income. The theory further stresses that any decrease in employment level or national output will result in unemployment or a decrease in national income.
The endogenous growth model emphasizes that if productivity is to rise, the labour force must be given greater resources on a continual basis. Physical capital, human capital, and knowledge capital are all resources in this scenario (technology). Solow model focuses on a functional link between input and output given capital and labour which are substitutable. Both the endogenous growth model and Solow’s model emphasis labour and capital as factors of productivity however they lay emphases that more increased productivity factor labour or factor capital must be given attention. Further there exist a trade-off between labour and capital thus an investor choose the factor which will minimise cost and maximise profit however the choose of any factor of production also depend on nature or structure of the economy for example; for developing it is more cheaper using labour intensive techniques ahead of capital intensive. Despite this, for efficiency and effectiveness labour factor need to training and improve it mental ability physicality.
EMPIRICAL REVIEW
Aluthge, Jibir, and Abdu (2021) investigated the impact of Nigerian government expenditure (disaggregated into capital and recurrent) on economic growth using time series data for the period 1970-2019. The study employs Autoregressive Distributed Lag (ARDL) model. The outcome of the study shows that capital expenditure has positive and significant impact on economic growth both in the short run and long run while recurrent expenditure does not have significant impact on economic growth both in the short run and long run. Thus, the recommends that government should increase the share of the capital expenditure especially on meaningful projects that have direct bearing on the citizen’s welfare.
Keji (2021) examined the relationship between human capital and economic growth in Nigeria. The study employed vector autoregressive and Johansen techniques. The results reveals that human capital have long-run significant impact on economic growth in Nigeria. Interestingly, results from normality test, VEC residual serial correlation LM tests and VEC residual heteroskedasticity tests confirm the justification and validity of the estimated results obtained in this research. This study suggest the need to sustain economic in Nigeria through increase budgetary allocation to education and health sector to boost human capital skills needed to drive knowledge-based economy.
Charles, Nenbee and Krama (2018) Between 1980 and 2016, researchers looked into the impact of governmental spending in the social sector on job creation in Nigeria. To estimate the model, the researchers employed Stock-(1993) Watson’s Dynamic OLS technique of analysis. Government Expenditure on Education (EDU) is correctly signed and statistically significant, whereas Government Expenditure on Health (HTH) and Government Expenditure on Other Social and Community Services (COM) are incorrectly signed but statistically significant at the 5% level.
Okumoko, Omeje and Udoh (2018) investigated the impact of human capital development on industrial growth in Nigeria was studied empirically. Both descriptive and econometric techniques were used to analyse time series data on key variables from 1976 to 2016. The variables were tested for stationarity using ADF techniques. The results reveal that in the long run, the variables got closer to equilibrium. The findings also demonstrate that recurrent education and health expenditures have a negative influence on industrial growth.
Ajakaiye, Afeikhena, David and Olufunke (2016) examined the relationship between employment and growth in Nigeria in order to better understand the country’s contradiction of strong economic growth and rising poverty and inequality. To estimate the model, the study used the World Bank’s stepwise decomposition methodology with the Shapley decomposition method (World Bank 2010). The findings suggest that Nigeria’s growth has been ‘jobless’ over the last decade, supported mostly by factor reallocations rather than productivity improvement. The employment elasticity of growth was positive but not very high, reflecting the country’s weak overall job creation performance, particularly in manufacturing.
MODEL SPECIFICATION
According to Keynes’ model, the level of employment is determined by national income output. Furthermore, Keynes argued that an increase in national income would lead to an increase in employment, and vice versa. As a result, the research model can be defined as follows;
HCD→EMP →GDP
Given the controversies surrounding the proxy of HCD leading to contentions, the study has considered the use GEE as a proxy for HCD.
However, it is argued that economic growth is determined by employment generation and human capital development. Further Walterskirchen (1999), Vistrand (2006) supported Keynes view of employment generation as a determinate of economic growth while Schultz (1961) recognized human capital as one of important factors that determines economic growth. Incorporating these determinates in Keyenes model then, the model can be re-specified as;
inGDP=∫(lnEMP,lnHCD)……………………………………………………………1
Where
GDP = Gross Domestic Product, proxy for economic growth
EMP = Employment generation, proxy as employment
HCD = Human Capital Development
in = Natural Logarithm (the model is transformed to reduce skewness and produce nearly equal spread)
HDC=∫(GEE) ………………………………………………………………………….….2
Where
GEE = Government Expenditure on Education
Incorporating the HCD proxies into the growth model, expressing the model in it deterministic form as;
inGDP=∫(lnEMP,lnGEE)………………………………………………………………………….….3
Hence expressing the model in its stochastic form as;
inGDPt=a0+a1 lnEMPt+a2 lnGEEt+⋯+Ut ………………………………………………………………………….….4
Where
a0 = intercept
a1-a2 = parameter coefficients to be estimated
Ut = disturbance term
Applying Structural Vector Autoregressive (SVAR) form of the model as stated below
A0 Yt=A1 Yt-1 +A2 Yt-2+⋯+Ap Yt-p+ ∈t……………………………………………..……5
The transmission channel
GEE→EMP →RGDP
SVAR model:
GDPt = f(GDPt-1EMPt-1GEEt-1)……………………………………………………………6
EMPt= f(GDPt-1 EMPt-1 GEEt-1 )…………………………………………………………….7
GEEt= f(GDPt-1EMPt-1GEEtt-1)…………………………………………………………….8
Assuming a (p) optimal lag length model (1) SVAR becomes
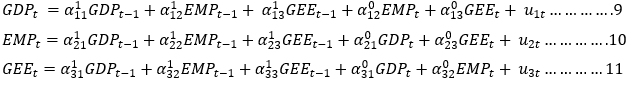
Following the recursive approach, the SVAR model (1) becomes
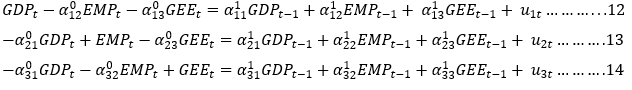
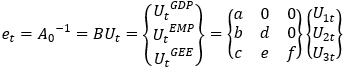
The recursive equations (12, 13 and 14) can be expressed in matrix form as:
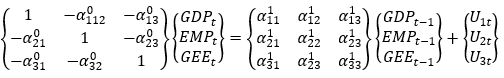
To determine shock spill overs, the researcher remove the actual spill overs from the correlated errors. The matrix is therefore specified as:
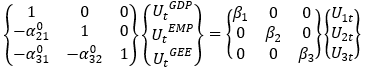
Thus, the matrix form of the variance forecast can be specified as:
Where:
a is the response of GDPt to own shocks, b is the response of EMPt to GDPt shocks, d is the response of EMPt to own shocks, c is the response of GEEt to GDPt shocks. e is the response of GEEt to EMPt shocks. f is the response of GEEt to own shocks
DESCRIPTIVE STATISTICS
Table 1: descriptive statistics
| Variable | Mean | Standard deviation | Minimum value | Maximum value | Jarque-bera/probability |
| GDP | 31.7 trillion | 3.94 trillion | 95.9 billion | 127.0 trillion | 2.237488/ 0.054213 |
| EMP | 51.98 % | 1.06% | 49.00% | 53.10% | 1.333851/0.642133 |
| GEE | 1.32 billion | 140 billion | 1.14 billion | 4.67 billion | 0.930222/0.049270 |
Source: Author’s computation from E-views 10 output.
Table 1: Shows that the mean rating of GDP is ₦31.7 trillion with a corresponding standard deviation of 3.94 trillion, the minimum observation and the maximum observation of GDP under study is ₦95.9 trillion and ₦127.0 trillion respectively, the jarque-bera statistic is 2.237488 with a probability value of 0.054213. Further, the mean rating of GDP is higher than other variables; the robustness of this mean could be traced to the fact that GDP contained all the value of economic activities within a specified year. EMP has a mean rating of 51.98% with a corresponding standard deviation of 1.06%, the lowest level of employment is 49% while the highest level of employment is 53% under the time of study while the jarque bera is 1.33 with 0.64 associated probability value. This implies that the employment level in Nigeria over time is moderate. 1.32 billion naira is the mean rating of GEE with the corresponding standard deviation of 140 billion, the minimum value of GEE is ₦1.14 billion while the maximum value of GEE is ₦4.67 billion. When the Jacque-bera probability value is greater than 0.05 or when the Jacque-bera value is closer to zero, reject the null hypothesis implying the data has good goodness-of-fit, note that Jacque-bera value is non-zero. All the variables included in the model are statistically significant at 5% level of significance given their various jacque-bera probability values.
Unit Root Tests
Table 2: ADF Unit Root Test Result
| variables | At levels | First difference | Order of integration | ||
| t-stat | Prob. Value
0.005 |
t-stat | Prob. Value
0.005 |
||
| D(GDP) | -1.713729 | 0.4150 | -6.654028 | 0.0000 | I(1) |
| D(EMP) | 2.256645 | 0.1915 | -4.350346 | 0.0017 | I(1) |
| D(GEE) | 0.500105 | 0.8785 | -6.518485 | 0.0000 | I(1) |
Source: Author’s computation from E-views 10 output.
Table 2 shows the stationarity properties of GDP, EMP and GEE it could be inferred that, all the variables are integrated of order one (that is first difference) at 5% level of significance.
Lag Order Selection
Table 3: Lag Order Selection for SVAR Model One (GDP-EMP-GEE)
| Lag | LogL | LR | FPE | AIC | SC | HQ |
| 0 | -48.01006 | NA | 0.006019 | 3.400671 | 3.540790 | 3.445496 |
| 1 | 70.23947 | 204.9658* | 4.15e-06* | -3.882631* | -3.322152* | -3.703329* |
| 2 | 74.13932 | 5.979775 | 5.96e-06 | -3.542621 | -2.561783 | -3.228843 |
| 3 | 77.11620 | 3.969173 | 9.40e-06 | -3.141080 | -1.739883 | -2.692825 |
Source:outputE-views10
Tables 3 shows the optimal order selection, the study made use of Akaike information criterion (AIC) in selecting the optimal lag length hence it is the most appropriate criterion for a model less than or equals to four variables. Base on AIC judgment the optimal lag is one.
Diagnostic Tests
To ensure unbiased estimates the study carried out diagnostic tests such as autocorrelation test, normality test and heteroskedascity test and the results table 4.
Table 4: Diagnostic Test Results
| transmission channels | Diagnostic test | F-stat. | df. | Chi-Square Stat. | Prob. |
| GDP-EMP-GEE | Serial correlation | 0.26982 | 9 44.0 | Nill | 0.9821 |
| Residual Normality | nill | 1 | 48.32928 | 0.0000 | |
| Residual Heteroskedascity | nill | 72 | 56.67136 | 0.9074 |
Source: output E-views 10
Table 4: Shows the results of diagnostic tests reviewed that, variables in the models are measured without serial correlation and heteroskedascity as seen from the probability values (serial correlation; 0.9821), and (heteroskedascity; 0.9764) at 5% level of significance. However, the residual normality test is not significant at 5% level as seen from the probability values (residual normality; 0.0000). However, this has no serious threat to the estimates but rather reduced the forecasting power of the model, stability test is reconsidered given a good impulse response result.
Stability Test
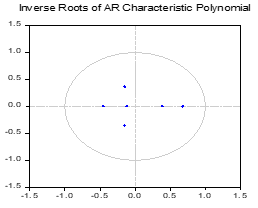
Figure 1: output from E-views 10
Figure 1 shows the results of the Inversely Rule of Autoregressive Characteristic Polynomial, given the misbehaviour of the residual normality test, the models still have the power to bring out good estimates and good forecast given that, all the dots falls within the safe region of the circle.
Co-Integrating Test
Co-integration test is used to identify scenario where two or more non-stationary time series are integrated together in a way that they cannot deviate from equilibrium in the long run. To test for the long run relationship between variables in the equation of model one, two and three the results from appendix vii are presented in the table 5
Table 5: Trace/Max-Eigen test result model one
| Hypothesized | Trace | 0.05 | Max-Eigen | 0.05 | ||
| No. of CE(s) | Statistic | Critical Value | Prob.** | Statistic | Critical Value | Prob.** |
| None * | 40.65775 | 29.79707 | 0.0019 | 23.22513 | 21.13162 | 0.0250 |
| At most 1 * | 17.43263 | 15.49471 | 0.0252 | 13.36015 | 14.26460 | 0.0691 |
| At most 2 * | 4.072479 | 3.841466 | 0.0436 | 4.072479 | 3.841466 | 0.0436 |
Source: output E-views 10
Table 5a reveals the Johensen co-integration test results for both the trace test and the max-eigen value. Following the decision rule that at least there should exist evidence of co-integration in one of the equations. Further, when the probability value is less than 0.05% critical value do not accept the null hypothesis implying that, there exists evidence of co-integration in other words there exists a long run relationship among the variables in the various equations. Judging based on the decision rule, both the trace value and the eigen value reveals a long run relationship among the variables in the three models respectively.
Impulse Response
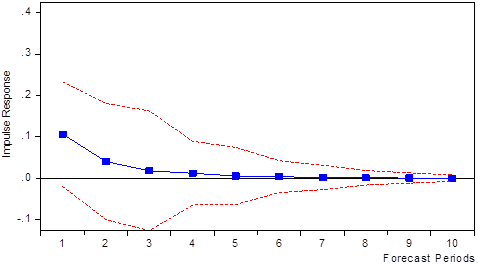
Figure 2 Response of employment to an innovation in government expenditure on education
Figure 2 shows the response of employment to one standard deviation shock in government expenditure on education. This implies employment respondent positively initial period but decreased gradually to the origin permanently. This means that employment would impact positively on government expenditure on education permanently.
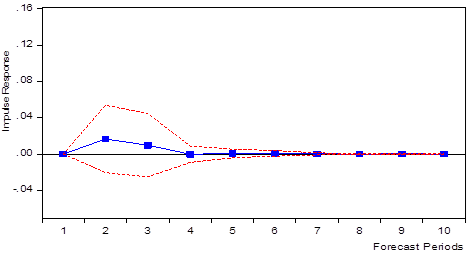
Figure 3: Response of Economic Growth to an innovation in Employment
Figure 3 shows that one standard deviation shock in employment will have no response on economic growth in the first period but will gradually increase in the second period; however, it will decline in the third period to converge at the origin and will fizzle out in the seventh period. This implies that a shock in employment will have a positive impact on economic growth but temporally, this also means that in the long run, other factors will account for changes in economic growth rather than employment.
Variance Decomposition Analysis
Table 6: Variance Decomposition Analysis of model one (GEE-EMP-GDP) Variance decomposition of economic growth
| Period | SE | GDP | EMP | GEE |
| 1 | 0.131 | 100.00 | 0.00 | 0.00 |
| 3 | 0.136 | 94.718 | 1.434 | 4.527 |
| 6 | 0.137 | 93.717 | 1.577 | 4.704 |
| 10 | 0.137 | 93.715 | 1.578 | 4.707 |
| Variance Decomposition of Employment | ||||
| Period | SE | GDP | EMP | GEE |
| 1 | 0.364 | 3.130 | 96.869 | 0.000 |
| 3 | 0.379 | 6.803 | 93.175 | 0.021 |
| 6 | 0.380 | 6.799 | 93.174 | 0.026 |
| 10 | 0.380 | 6.799 | 93.173 | 0.027 |
| Variance Decomposition of Government Expenditure on Education | ||||
| Period | SE | GDP | EMP | GEE |
| 1 | 0.132 | 13.136 | 7.741 | 79.122 |
| 3 | 0.143 | 11.572 | 10.389 | 78.038 |
| 6 | 0.146 | 11.307 | 10.660 | 78.032 |
| 10 | 0.146 | 11.252 | 10.718 | 78.029 |
Source: E-view 10 output.
The results in Table 6 show that, 100% variations in economic growth in the first period is due to own shock. In the third-period economic growth would change by 94.718% to own shock while employment and government expenditure on education would have no initial influence on economic growth, further employment and government expenditure on education would account for 1.434% and 4.527% variation in economic growth in the third period, all of these are in the short term. Further, economic growth would change decreasingly and sluggishly and would account for 93.715% variations to own shock in the tenth period. While both employment and government expenditure on education would contribute to changes in economic growth in the tenth period by 1.578% and 4.707%. This means that both employment and government expenditure on education have minimal increasing influence on economic growth. Also comparatively, government expenditure on education is a good predictor of economic growth given the forecast period.
Table 6 reveals that, 96.869% and 93.175% variations of employment would be accounted by own shock in the first and third period respectively. While economic growth and government expenditure on education would account for variation in employment by 3.130% and 0.000% and 6.80% and 0.021% in the first and third period respectively, this connote short run with emphasis to first and third period. However, employment decrease gradually and in the tenth period would account for own variation by 93.173% while economic growth and government expenditure on education would account for variation in employment in the tenth period by 6.799% and 0.027% respectively. This connote long run forecast, this also means that during the forecast period the impact of employment outweigh economic growth and government expenditure on education variations also, economic growth is a better predictor of employment comparatively.
Table 6 shows the influence of economic growth and employment to the innovation of government expenditure on education as 13.136%, and 7.741% however government expenditure on education would account for own shock by 79.122% in the first period which connotes short term. Over time government expenditure on education would decrease gradually to own shocks by 78.029% during the forecast period while economic growth and employment would have an increasing influence on government expenditure on education, hence in the tenth period would account for 11.252% and 10.718% variations in government expenditure on education respectively. This implies that economic growth and employment have an increasing but sluggish powers to predict government expenditure on education during the forecast period also economic growth is a better predictor of government expenditure on education.
Short run/Long run SVAR estimates
Table 7: Short run/Long run SVAR estimates in model one (GDP→EMP→GEE)
| GDP | EMP | GEE | GDP | EMP | GEE | |
| GDP | 0.134 | 0 | 0 | 0.122 | 0 | 0 |
| Prob. | (0.000) | 0 | 0 | (0.000) | 0 | 0 |
| EMP | 0.130 | 0.355 | 0 | 0.116 | 0.456 | 0 |
| Prob. | (0.019) | (0.000) | 0 | (0.001) | (0.000) | 0 |
| GEE | 0.064 | 0.047 | 0.071 | 0.243 | 0.001 | 0.080 |
| Prob. | (0.040) | (0.09) | (0.000) | (0.004) | (0.004) | (0.000) |
Source: E-views 10
The result from Table 7 shows that a unit innovation in employment will lead to a 0.130% change in economic growth positively in a short run while a unit innovation in employment in the long run will lead to a 0.116% positive change in economic growth, this result is statistically significant at 5% critical level. This implies that employment will impact economic growth positively but the impact will decrease gradually in the long run, further the impact is negligibly low. Also, a unit innovation in government expenditure on education will lead to a 0.064% change in economic growth positively in the short run and would lead to a 0.243% change in government expenditure on education positively in the long run. This means that the impact of government expenditure on education on economic growth is positive that is to say that increases in government expenditure on education will precipitate increases in economic growth the short run and long run. However, the impact in the short run is very minimal. Similarly, a unit innovation in government expenditure on education will impact 0.047% on employment in the short run and 0.001% in the long run. This result is not statistically significant at 5% level of significance in the short run; however, it is statistically significant at 5% level of significance in the long run. This entails that, innovations in employment can impact positively on government expenditure on education in the short run however in the long run a unit innovation in employment would impact positively and minimally on government expenditure on education.
DISCUSSION OF RESEARCH FINDINGS
This study is to examine the impact of government expenditure on education through economic growth through employment. From the impulse response function, it could be inferred that employment rate responded to one standard deviational shock in government expenditure on education positively in short run however converges to the origin and remain permanent also economic growth responded positively to innovation in employment rate in the short run. On the other hand, the forecast variance decomposition reviews that, there is a weak and sluggish response running from government expenditure on education to employment rate during the forecast period. Also, economic growth has weak and sluggish impact on the innovation of employment rate.
Further, the Structural Vector Autoregressive (SVAR) result reviews that, in the short run economic growth responded to shock in employment by 0.130% however the impact decreased to 0.116% in the long run. Also, government expenditure on education impacted employment rate in the short run by 0.064%, while in the long run a unit shock in government expenditure on education would be responded to by employment rate by 0.001%.
This result is consistent with the findings of Ajakaije, Afeikhena, David, and Olufufunke (2016) who found out that, employment is positively signed to growth however, the impact is very low also Charles, Nenbee, and Karma (2018) found out that, government expenditure on education and employment are rightly signed on the other hand Okumoko, Omeje and Udoh (2018) found out that, government expenditure on education is wrongly signed this is not consistent with the findings of this research. However, this result reflects economic realities and economic theory inherently; government expenditure on education have the capability of increasing employment which may in turn impact positively on the volume of economic activities which may precipitate economic growth. However the transmission running from government expenditure to economic growth through employment is weak, this is possible because the funds allocated to the sector have been inadequate and have not been able to measure to world indicator standard for instance; United Nations Educational Scientific and Cultural Organisation (UNESCO) has recommended about 26% of country’s budgetary allocation should be allocated to the educational sector, however, Nigeria over time have not been able to allocate 15% of the budget to the educational sector, also, the system is characterised with institutional weakness. This has seriously hampered the quality of output from the sector.
Recommendations
First, the government should increase the budgetary allocation to critical sectors like education to meet the standard of the international community and also ensure strict adherence to implementation and avoid budget misappropriation. Further, much emphasis should be given to the quality of education since it is showing a weak effect on employment in Nigeria. This is because the sector has the potentials in the long run to impact positively to economic growth. Second, the government should enshrine practical entrepreneurial studies in the Nigerian educational curriculum starting from the basic level. Hence government should also ensure a good business environment for the entrepreneurial activities to strive by given soft loans, minimal taxes, ensure stable security, local content law, and hosts of other incentives that will encourage local entrepreneurs. This will enable or help reduce high level of redundancy among workforce-age people and reduce over-concentration on government jobs or white-collar jobs but rather boost individual capacity which will add positively to employment levels. Finally, the government should encourage and promote academic excellence with appropriate remunerations such as granting scholarships, employment, training, and re-training of excellent students.
REFERENCE
- Ajakaiye, O., Afeikhena, T. J., David, N., & Olufunke, A. A. (2016). Understanding the relationship between growth and employment in Nigeria. Africa Growth Initiative development Research Unit, 1-32.
- Aluthge, C., Jibir, A. & Abdu, M. (2021). Impact of Government Expenditure on Economic Growth in Nigeria, 1970-2019. CBN Journal of Applied Statistics. 12(1):139-174, DOI: 10.33429/Cjas.12121.6/6
- Central Bank of Nigeria (2000). Annual Report and Statement of Account, 11(8), 45-51.
- Central Bank of Nigeria (2013). Statistical Bulletin. Central Bank of Nigeria, Abuja. 14(2), 155-166.
- Charles, D., Nenbee, S. G. & Krama, I. J. (2018) public investment in the social sector and employment generation in Nigeria,1980-2016: Greener Journal Of Social Science 8(1):001-011.
- Kanayo, O. (2013). The impact of human capital formation on economic growth in Nigeria. National Institute for Legislative Studies, National Assembly, Nigeria and Statistics Population Studies, Department, University of Western Cape, Cape town, South Africa.
- Keji, S. A. (2021). Human capital development and economic growth in Nigeria, future business journal. 7(1):1-8, https://doi.org/10.1186/s43093-021-00095-4
- Oni, B. (2000). ‘Capacity building efforts and brain drains in Nigerian Universities’. A paper presented at the Regional Conference on Brain Drain and Capacity Building in Africa, 22 – 24 February, 2000, Addis Ababa, Ethiopia.
- Okumoko, T. P., Omeje, D.& Udoh, F. M. (2018). The dynamics of human capital development and industrial growth in Nigeria, International Journal of Developing and Economic Sustainability, 6(2):41-51.
- Sodipe, O. A. & Ogunrinola, O. I. (2011). Employment and economic growth nexus in Nigeria: International Journal of Business and Social Sciences, 2(11), 30-46.
- Wakeel, A. I. & Alani, R. A (2015). Human capital development and economic growth: Empirical evidence from Nigeria. Asian Economic and Financial Review, 2(7):813-827.
- Walterskirchen, E (1999) “The relationship between growth, employment and unemployment in the EU,” in European Economist for an Alternative Economic Policy Workshop.
- World Bank, (1998). Knowledge for Development: World Development report, 1998/99, Washington,D.C.