
Investigating the Effect of Agricultural Crops on Agricultural GDP in Bangladesh
- Md. Idris Ali
- 2093-2098
- Oct 23, 2023
- Agriculture
Investigating the Effect of Agricultural Crops on Agricultural GDP in Bangladesh
Md. Idris Ali
Assistant Professor (Statistics), North Bengal International University, Rajshahi, Bangladesh
DOI: https://dx.doi.org/10.47772/IJRISS.2023.71070
Received: 06 October 2023; Revised: 12 October 2023; Accepted: 16 October 2023; Published: 23 October 2023
ABSTRACT
The main purpose of this study is to investigate the relationship between boro price, aman price, wheat price, potato price and GDP per capita income and then this study is to analyze the effects of per capita income and prices on the agricultural GDP. This study used Pearson correlation and the panel data fixed effect regression model from 2009 to 2021. The data was collected from the Bangladesh Bureau of Statistics. The results showed that the relation between GDP per capita income and the price of all products are positively correlated. Finally, the results disclosed production, price and GDP per capita income are significant at 1% level of significance as well as Boro price and wheat price is significant at 5% level of significance. But aman price and potato price are not significant at 5% level of significance. Therefore, GDP per capita income, production, price of boro rice and wheat price affected sufficiently on agricultural GDP.
Keywords: Agricultural GDP, Price, Trend line, Fixed Effect Regression Model, Panel Data.
INTRODUCTION
Based on the gross domestic product, the world rank of Bangladesh is 32nd out of 207 countries (World Development Indicators database, World Bank, 2023). There are several GDP sectors of Bangladesh among them agriculture sector is the most important sector. The agricultural sector plays a main role in the total economic development of Bangladesh (National Accounting Wing, BBS). This is a raising sector in creating livelihood, and new employment.
Poverty alleviation is a main objective of the government, in rural areas especially. It can be completed to a large extent by achieving growth in the agricultural sector and increasing employment in this sector. The country’s economy is mainly dependent on agriculture. In 37.09 percent of the labor force in Bangladesh are activated in the agricultural sector, 21.71 percent and 41.2 percent of the labor force in Bangladesh are activated in industry and in the service sector respectively (employment economic sector Bangladesh 2021-statista, www.statista.com). Since Bangladesh depends upon mainly agricultural sectors so unemployment’s mostly have to emphasize on the agricultural sector.
There are several sectors of agriculture in low leveled, medium level and high-level land such as Cereals, Pulses, Oil Seeds, Vegetables and Cash Crop etc. Although rice, wheat and jute are the main crops, maize and vegetables are assuming greater importance. Due to the expansion of irrigation networks, some wheat producers have switched to cultivation of maize which is used mostly as poultry feed. Tea is grown in the northeast of the country. Because of Bangladesh’s fertile soil and normally sufficient water supply, rice can be grown and harvested three times a year in many areas. In comparison to rice, wheat and maize production also play significant role in cereal production. Potato, a significant production in vegetables was found in FY 2019-20 (BBS).
LITERATURE REVIEW
Murshid et al., (2016), investigated that the agricultural sector contributes 14.23% of the gross domestic product (GDP) and almost 70% of the agricultural gross domestic product (AGDP) of Bangladesh. Nonetheless, because of industrialization, the amount of land devoted to agriculture is decreasing year by year. Agricultural land took up 70.6% of the land area in Bangladesh (World Bank 2018). Rehman et al. (2015), examined the economical impacts of main field crops, such as wheat, sugarcane, rice, maize, and cotton in Pakistan from 1950 to 2015. This study used annual time series data and the results of this study reveals that wheat, cotton, rice and maize is a positive influence on the agricultural GDP of Pakistan. Kyomugisha, et al., (2018) investigated a study to identify the factors limiting farmers’ market entrance, the break-even point for potato farmers in Uganda. This study selected two exoteric potato-producing areas in Uganda, Kabale and Mbale, and randomly selected potato farmers and traders from the two districts. Their study found that having contracted with purchasers, land area owned, number of forked hoes owned and diversity of produce have a positive and significant impact on farmers’ market access. Authors also indicated that adding value to potatoes on the farm generates comparatively more revenue for growers which affect agricultural GDP. Market chains where farmers sell to local rural traders were indicated to be sufficient effective than other selling options. Rice cultivation accounts for 48% of total rural employment – a figure that will rise even more if rice trading, transport and processing activities are also taken into account. It also provides two-thirds of the calorie needs of the nation along with half the protein consumed. Its contribution to agricultural GDP is about 70% while its share of national income is one-sixth. In other words, rice continues to play a critical role in Bangladesh even though the long-term trajectory is one of decline (Faruqee, 2012).The impact on growth, poverty reduction and food security has occurred mainly through rice production and yields, despite declining terms of agricultural trade and declining trend in relative price of rice. GDP growth was positively affected due to the large share of food production in the national economy and the indirect contribution through downstream trade, milling and processing. In fact the rice–based Green Revolution was a major breakthrough for the rural economy creating jobs, employment and demand. Economy–wide effects of cheap food also helped in industrialization through low wages, low inflation and a stable macro economy (FAO-2017). Rehman et al., (2017) investigated the relationship between rice, cotton, sugarcane, wheat, tubers, corn and agricultural gross domestic product (AGDP) in china in the period 1980–2015. The ordinary least squares technique and annual time-series data is used to analyze the relationship. The results illustrated that wheat, cotton, tubers, sugarcane and corn have a positive and significant effect on AGDP. On the contrary, rice production has an insignificant and negative impact on AGDP. Rahman el at., (2017), to determine agricultural crops jute’s future potentiality and compare with agricultural GDP and GDP growth the authors considered its growth performance, profitability, and production proficiency. The results of the study demonstrated that the jute sector has experienced significant growth in area, production, productivity, prices, and exports. Furthermore, authors opined that customary agricultural crops jute cultivation is universally competitive, but the financial profitability of agricultural crops jute was relatively higher. Land, irrigation and labor all play a main role in agricultural crops jute production, and farmers were comparatively inefficient. Which is comparatively affects agricultural GDP and GDP growth.
In the above literature review it found out that most of the authors did not include the agricultural GDP as a dependent variable. An econometric analysis-based study of the impacts of GDP per capita income, rice, wheat and potato production and price on agricultural GDP has never been carried out before in the Bangladeshi context. Therefore, this study paper will fill the study gap in the research literature.
OBJECTIVES
The main objectives of this study are as
- Exploring the relationship among per capital income and price of some agricultural factors.
- To investigate the affects of agricultural GDP on agricultural production prices.
DATA AND RESEARCH METHODOLOGY
The information on rice prices, wheat price, potato price and their productions are collected from Bangladesh Bureau of Statistics (BBS) in 2009-2021 as well as agricultural GDP and GDP per capita income are also collected from World Bank which is secondary data. The data are collected by using purposing sampling. This study has used a fixed effect regression model to investigate the effect of the prices of agricultural productions for panel data. In order to study the effect of the prices of agricultural productions, many fixed effect regression model is estimated with explanatory variables. Maulana et al. (2020) indicated that the combination of time-series data and cross-section data is called panel data.
RESULTS DISCUSSION
This study has considered GDP per capita income, rice prices that is Aman Price, Boro Price and wheat price and potato price and agricultural GDP in this research. Now the Summary statistics of the variables have been shown in Table 1.
Table 1: Summary statistics of study variables
| Variables | sample size | Minimum | Maximum | Mean | Std. Deviation | Skewness | Kurtosis |
| Agricultural GDP | 13 | 2.50 | 5.20 | 3.6992 | 0.86117 | 0.509 | -0.777 |
| Aman Price | 13 | 978 | 2850 | 1578.85 | 602.605 | 1.26 | 0.742 |
| Boro Price | 13 | 906 | 2762 | 1530.62 | 614.273 | 1.028 | -0.200 |
| Wheat Price | 13 | 1739 | 2892 | 2217.92 | 305.245 | 0.833 | 0.746 |
| Potato Price | 13 | 585 | 2188 | 1295.62 | 604.048 | -0.6960 | 0.270 |
| GDP Per Capita Income | 13 | 698.52 | 2457.92 | 1444.55 | 619.817 | 0.328 | -1.553 |
It is noticed from the results of Table 1 that the mean Agricultural GDP is 3.6992, std. deviation is 0.86117 maximum is 5.20, minimum is 2.50, skewness is 0.509 and kurtosis is -0.777. For aman price the mean is 1578.85 tk. per quintal, standard deviation is 602.605, maximum is 2850, minimum is 978, skewness is 1.260 and kurtosis is 0.742. The mean value of boro price is 1530.62 tk. per quintal, standard deviation is 614.273, maximum is 2762, minimum is 906, skewness is 1.028 and kurtosis is -0.200. Wheat and potato prices the mean are 2217.92 tk. per quintal and 1295.62 tk. per quintal, standard deviation are 305.245 and 604.048, maximum are 2892 and 2188, minimum are 1739 and 585, skewness are 0.833 and -0.696 also kurtosis are 0.746 and 0.270 respectively. The mean value of GDP per capita income is $1444.55, standard deviation is 619.817, maximum is 2457.92, minimum is 698.52, skewness is 0.328, and kurtosis is -1.553. Therefore, It is clear that the kurtosis is not greater than 3 (three) so the selected variables in this study are non-normally distributed.
Fig. 1: The trend line shows the relationship between agricultural GDP, prices of aman, boro, wheat, potato and per capita income.
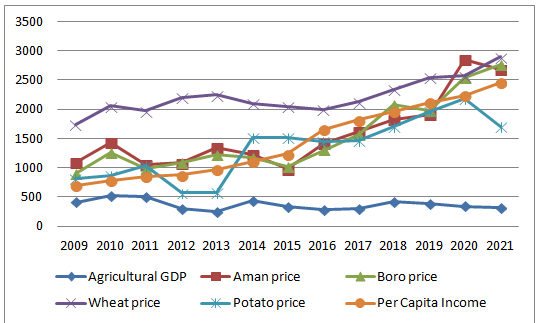
Note; Agriculture GDP = 100*trend of agriculture GDP.
From the fig-1, it is reveals the agricultural GDP is decreased from 2009 to 2021. But it was highly increasing in 2010. The change of agricultural GDP is not affected on the GDP per capita income. The result in the above trend lines shows that the prices aman, boro, wheat and potato increased from 2009 to 2021 but suddenly decreased in 2015. On the other hand, GDP per capita income always increased from 2009 to 2021.
Statistics Test
This test has been guided to find out how the relationship between the dependent variable and the independent variable in the study. This study uses statistical tests in the form of F tests, t tests, and coefficients of determination.
Table 2: F-test
| Statistical Test | Values |
| Value F-statistic | 6631.569 |
| P-values | 0.000 |
| Results | Significant |
On the basis of the results of the F test above, obtained F Statistic is 6631.569 with probability (F-Statistic) is 0.0000 which is smaller than α at 5% level of significance. So it can be decided that the GDP per capita income, rice prices, potato price, and wheat price have a significant effect at 1% level of significance on agricultural GDP.
Table 3: t- test.
| Model | Coefficient | Standard Error | t-Statistics | Significance |
| Production | -72837.621 | 12528.237 | -5.814 | 0.000 |
| Price | -73005.553 | 12772.071 | -5.716 | 0.000 |
| Per Capital Income | -73408.115 | 12116.246 | -6.059 | 0.000 |
| Amon Price | -0..760 | 1.501 | -0..506 | 0.615 |
| Boro Price | 3.165 | 1.441 | 2.196 | 0.033 |
| Wheat Price | -2.587 | 1.194 | -2.167 | 0.036 |
| Potato Price | 0.087 | 0.208 | 0.420 | 0.676 |
From the results of the t-test above, this study disclosed production, price and GDP per capital income are significant at 1% level of significance as well as Boro price and wheat price are significant at 5% level of significance. But aman price and potato price are not significant at 5% level of significance. So, the GDP per capita income, production, price of boro price and wheat price affected sufficiently on agricultural GD.
Table 4: Coefficient of Determination
| Weighted Statistic | |
| R-Square | 0.998 |
| Adjusted R-Square | 0.998 |
The R2 value for this model is 0.99 and the Adj R2 value is 0.99. Therefore, the predictor variables can explain about 99% of total variation by R2 and about 99% of total variation by Adj.R2 .
CONCLUSION
The study is measured the prices of agricultural crops effect on the agricultural GDP using fixed effect regression model. Any change in the prices and productions of agricultural crops is transmitted to GDP per capita income and Agricultural GDP. The relationship between prices of agricultural crops movements that impact on the agricultural GDP in several times, such as 2010-2022. This condition illustrates that the prices of aman, boro and potato are highly upward and downward on the contrary agricultural GDP is slowly upward and downward. The fixed effect regression model reveals that the amounts of production, crops prices and GDP per capita income have been affected sufficiently on agricultural GDP. Therefore the prices of aman, boro, potato and wheat price significantly affect agricultural GDP in Bangladesh. So this study gives emphasis to the need to strengthen technical progress and need to concern production in every crop.
REFERENCES
- Abdlaziz, R. A., Rahim, K. A., & Adamu, P. (2016). Oil and food prices co- integration nexus for Indonesia: A non-linear autoregressive distributed lag analysis. International Journal of Energy Economics and Policy, 6(1), 82–87.
- Azyan Z. U., Gunawan R. S., Arifin A., Setiawan W. (2023), Determinant of Food Security in the Ten Highest Rice E-producing Provinces IN INDONESIA, Midyear International Conference, Indonesia.
- Chen Y., Chien H., Furuya J. Koyama O.(2009), The impact of Rinminbi Appreciation on the World Rice Market. JARQ 43(4), pp 329-336 (2009). jircas.affrc.go.jp.
- Deski S. W., Sartiyah S. Seftarita C (2022), Investigating the Effect of Rice Commodity Price Volatility on Provincial Capital Poverty: An Evidence from Indonesia, International Journal of Global Optimization and Its Application, 1(2), PP: 90-99.
- Gollin, D., Parente, S. & Rogerson, R. (2002). The role of agriculture in development. American Economic Review. , 92, p. 160–164.
- Faruqee, R. (2012) Stock-taking of Major Studies and Reports on Agriculture and Rural Development in Bangladesh, mimeo, World Bank.
- FAO (2017). Rice price and growth, and poverty reduction in Bangladesh.
- Irz, X. &Tiffin, R. (2006). Is agriculture the engine of growth? Econ., 35 (1), p. 79–89.
- Kyomugisha, H., Sebatta, C., & Mugisha, J. (2018). Potato market access, marketing efficiency and on-farm value addition in Uganda. Scientific African, 1, e00013.Available at: https:// doi.org/ 10.1016/ j.sci af. 2018 .e00013.
- Murshid, K. A. S., & Yunus, M. (2016). Rice prices and growth, and poverty reduction in Bangladesh. Agargaon, Dhaka-1207, Bangladesh, 1-34. Retrieved from: https://www.fao.org/documents/card/en/c/I8332EN/
- Maulana, A. R. R., Zulham, T., & Sartiyah, S. (2020). Aceh Province Economic Convergence Determination. International Journal of Business, Economics, and Social Development, 1(4), 212–226.
- Mirza Md. Moyen Uddin (2015), Causal Relationship between Agriculture, Industry and Services Sector for GDP Growth in Bangladesh: An Econometric Investigation, Journal of Poverty, Investment and Development, ISSN 2422-846X An International Peer-reviewed Journal, l(8) p. 23-37.
- Minten, B., Reardon, T., Chen, K. Z., Adriano, L., Dao, T. A., Wang, J. & Gupta, S. D. 2014. The quiet revolution in Asia’s rice value chains, Annals of the New York Academy of Sciences, 44: p. 1–13.
- Rehman F. U., Khan D. (2015). The Determinants of Food Price Inflation in Pakistan: An Econometric Analysis, Advances in Economics and Business 3(12): 571-576.
- Rehman, A., Jingdong, L., Shahzad, B., Chandio, A. A., Hussain, I., Nabi, G., & Iqbal, M. S. (2015). Economic perspectives of major field crops of Pakistan: An empirical study. Pacific Science Review B: Humanities and Social Sciences, 1(3), 145- 158.Available at: https://doi.org/10.1016/j.psrb.2016.09.002.
- Rehman, A., & Jingdong, L. (2017). An econometric analysis of major Chinese food crops: An empirical study. Cogent Economics & Finance, 5(1), 1323372.Available at: http://dx.doi.org/10.1080/23322039.2017.1323372.
- Rahman, S., Kazal, M. M. H., Begum, I. A., & Alam, M. J. (2017). Exploring the future potential of jute in Bangladesh. Agriculture, 7(12), 1-16.Available at: https://doi.org/10.3390/agriculture7120096
- Shikur Z. H. (2021), Potato and Tomato Supply and Yield Responses to Policy in Ethiopia, African Journal of Economic Review, IX(IV), 2021,P.21-39.
- Silvia, V., Muhammad, S., Masbar, R., & Nasir, M. (2016). Optimization of smallholder palm oil in Nagan Raya and Aceh Tamiang Aceh province. International Journal of Contemporary Applied Sciences, 3(4), p. 1–17.
- Wang, X. Z., Wu, S. L., and Gao, F. (2010), The relationship between economic growth and agricultural growth: The case of China. Paper presented at International Conference on E-Business and E-Government (ICEE), Guanghou, China.
- Data source: World Development Indicators database, World Bank, January 15, 2023)
- Data source: National Accounting Wing, BBS Statistical Yearbook Bangladesh 2021
- World Bank. (2018). Bangladesh – agricultural land (% Of Land Area). Retrieved from: https://trading econo mics.com/bangladesh/agricultural-land-percent-of-land-area-wb-data.html.