
Lagena Inferocostata – An Opportunistic Index Species of Hydrocarbon Pollutants in Gokana and Khana Local Government Areas of River State, Nigeria.
- Ugochukwu Alex Etukokwu
- Godwin Jeremiah Udom
- Ferdinand Giadom
- 779-790
- May 8, 2023
- Environment
Lagena Inferocostata – An Opportunistic Index Species of Hydrocarbon Pollutants in Gokana and Khana Local Government Areas of River State, Nigeria.
Ugochukwu Alex Etukokwu, Godwin Jeremiah Udom, Ferdinand Giadom
Geology Department, University of Port Harcourt, Rivers State. Nigeria.
DOI: https://doi.org/10.47772/IJRISS.2023.7464
Received: 27 March 2023; Accepted: 08 April 2023; Published: 05 May 2023
ABSTRACT
Thirty shallow cores ranging from 0.0 – 1.0m and composited into upper and lower section, was studied to determine relationship between petroleum hydrocarbon pollutants and benthic foraminiferal species in order to determine an index for environmental monitoring in the study area. The core samples were taken from Gokana and Khana Local Government Areas of Rivers State, Nigeria. The cores were treated with Rose Bengal solution to distinguish between then acoenose and biocoenosis benthonic foraminiferal. The cores were analyzed for sedimentology, petroleum hydrocarbon concentrations and micropaleontology. Sedimentological descriptions of the cores indicated inhibited free flow of fluids based on the rock textures which mostly consists of clays and peaty clays. Petroleum hydrocarbons analysis consisted of Total Petroleum Hydrocarbon (TPH) and Polycyclic Aromatic Hydrocarbon (PAH). The results in concentrations of the petroleum hydrocarbons indicated higher concentrations in the upper composited sections. Total Petroleum Hydrocarbon (TPH) and Polycyclic Aromatic Hydrocarbon (PAH) ranged between (20612mg/kg – 37.09mg/kg and 9.55mg/kg – <0.01mg/kg respectively) in the upper composited section and between (14731mg/kg – 14.67mg/kg and 5.71mg/kg – <0.01mg/kg respectively) in the lower composited section. Occurrence of benthonic foraminiferal in the study samples is very low to barren among very low diversity. Three benthonic foraminiferal diversities were identified in the study samples and included Lagenainferocostata, Anomalinoidesspp and Ammodiscus spp. Benthonic foraminifera showed negative correlation with TPH/PAH in the presence of carcinogenic Polycyclic Aromatic Hydrocarbon (PAH) congeners except for Lagenainferocostata which increased consistently and significantly with increasing TPH/PAH in the two composited sections. This suggested Lagenainferocostata as an Index opportunistic species for the hydrocarbon polluted study area.
Key words: Lagenainferocostata, Thenacoenose, Biocoenosis, Polycyclic aromatic hydrocarbon, Total petroleum hydrocarbon.
INTRODUCTION
Environmental management involves accurate quantification of the impact of human activities on the natural environment. These impacts are identified through the use of several tools and techniques designed to observe the environment, identify environmental parameters, and characterize their quality. Benthonic foraminiferal are mostly sessile, not been able to avoid environmental changes therefore, are extensive bio-indicators of environmental changes. They are abundant, diverse and widely distributed within the shallow marine environment as fossils with some extant forms. Their test composition and morphology are direct preservation of the environmental changes and geologic history from the Ancient time (Cambrian) to Recent (Holocene). Crude oil in its natural state is a combination of plethora of substances commonly referred to as hydrocarbons and comprised of a complex mixture of carbon and hydrogen linearly arranged either as aliphatic or in rings as aromatic and asphaltene fractions with oxygen, sulphur and nitrogen containing compounds. There are generally very toxic to the environment especially in the form of polynuclear aromatic hydrocarbons (PAH’s), causing alteration of physico-chemical parameters of the soil and water when spilled, damaging the environment and every form of life dependent on it such as animal, plants, aquatic and micro-organisms as well as human (Aguilera et al., 2010).
The coastal regions of Nigeria have suffered series of environmental devastations arising from the multifaceted activities of the oil and gas industry since the beginning of oil exploration in Nigeria in 1957. Because there was really no proper documentation of any form of assessment that showed the pristine database of the environment prior to oil exploration activities, it is very challenging to establish the extent of devastation in the region. Many of the several monitoring tools in the environmental monitoring tool kit lack the dual function of generating pristine information as well as record environmental changes through time which benthonic foraminiferal possesses (Mojtahidet al.,2006).
Benthonic foraminiferal inhabit and colonize different bio-geographical environments suggesting that there are species-specific responses to different environmental stresses including those induced by hydrocarbon pollutants. Therefore, responses of benthonic foraminiferal to hydrocarbon pollutants vary among different benthonic foraminiferal species from different geographic regions. There is need for the development of specific foraminiferal indices based on foraminiferal communities/assemblages recovered in the coastal regions of Nigeria, generate a correlation between benthonic foraminifera and TPH/PAH as well as a catalog of opportunistic species as bio-indicators of hydrocarbon polluted environments.
This research provided information on the effect of hydrocarbon pollution on benthonic foraminifera in hydrocarbon polluted sites in Khana and Gokana Local Government areas of Rivers State, Nigeria. It indicated how different species of benthonic foraminiferal in the study sites responded to petroleum hydrocarbons and their role as part of environmental monitoring tool kit for the study area.
The study area is within the heavily hydrocarbon polluted Gokana and Khana local government areas of River state, Nigeria between longitudes 7⁰ 16′ 00″E to 7⁰ 19′ 00″ and latitudes 4⁰ 33′ 00″N to 4⁰ 36′ 30″N (fig. 1.1). The sample points are indicated in the study location map in “Red” dots. The control samples from where foraminiferal ecology for the Niger Delta was determined, was taken from an un-polluted site in Iwofe, Rivers State at latitude 04º 48ʹ 22ʺN and longitude 06º 57ʹ 46ʺE.
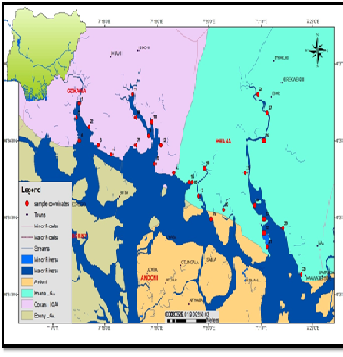
Fig 1.1: Location map of the study area showing sampled points with “Red” dots.
THEORETICAL FRAMEWORK
The transitional water bodies in Nigeria and the Niger Delta in particular, are mostly characterized with high level oil and gas exploration and production activities. These activities of the oil and gas industries in the Niger Delta has left the region most devastated with hydrocarbon pollution (figs 1.2 and 1.3).
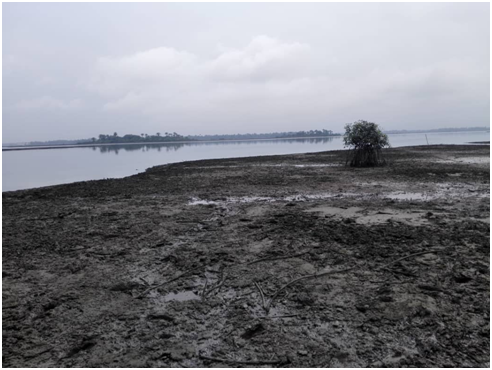
Fig. 1.2: A section of the study area in Gokana Local Government Area of Rivers State showing degree of devastation on vegetation exposing oil films on the earth surfaces.
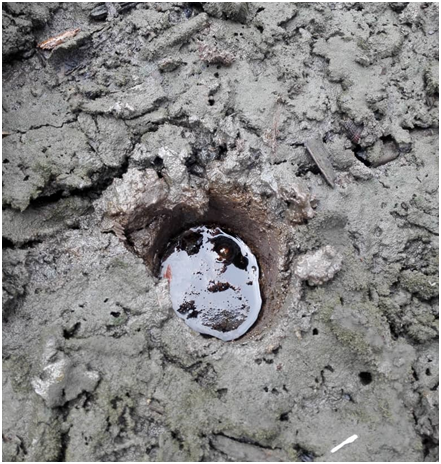
Fig. 1.3: Core hole filled up with hydrocarbons.
Previous studies such as Casey et al. (1980) and Army not du Chateletet al. (2004) has shown that benthonic foraminiferal are very good biotic indicators used for the investigation of impacts of oil spills in the environment.
The impact of hydrocarbon spills on benthonic foraminiferal has been identified to include general reduction in diversity and abundance, increase in dominance of TPH/PAH congeners tolerant species referred to as “opportunistic species”, alteration of species morphology, reduction in reproduction etc. however, some species may respond to hydrocarbon spills differently (Armynot du Chateletet al., 2004). Morvanet al. (2004) determined abnormalities in morphology and reduction in reproduction rate in “Ammonia tepida” (a benthonic foraminifera) using a laboratory culture experiment.
Ernst et al. (2006) identified increased mortality of benthonic foraminifera in response to hydrocarbon pollutant using a microcosm laboratory experiment. They indicated that some species of the benthonic foraminifera increased their rate of reproduction under the presence of the same hydrocarbon pollutant. These species were referred to as the “opportunistic species”.
Other authors such as Mojtahidet al. (2006) and Armynot du Chatelet and Debenay (2010) indicated that benthonic foraminifera inhabit and colonize different bio-geographical environments suggesting that there could be species-specific responses to different environmental stresses including those induced by hydrocarbon pollutants. Therefore, responses of benthonic foraminifera to hydrocarbon pollutants vary among different benthonic foraminiferal communities from different geographic regions.
Hydrocarbon spills has been identified by Peterson (2001) to have a wide range of negative impacts on marine environment at varying scale. These negative impacts included some dire consequences on the survival of marine micro-organisms, their productivity, development, feeding and ecology as indicated by Lamont et al. (2012), Incardonaet al. (2014), Gonzalez-Doncelet al. (2008), Romero et al. (2012) and Aguilera et al. (2010).
MATERIALS AND METHODS
The research methods included three basic stages of operations.
The field stage which involved sample site selection, sample collection and in situ measurement of some environmental variables and pollution factors. The samples were cored with box corer and fixed using 95% ethanol mixed with 1 g/l Rose Bengal solution after slicing at specified intervals. The staining with Rose Bengal solutionwas to distinguish fossils from their living relatives.
The Laboratory stage involved sediments grain size analysis according to Sheppard (1954), chromatographic measurements of concentrations of TPH/PAH congeners, micropaleontology sample preparation using 53 µm mesh in wet sieve analysis. The core samples were composited in two sections, the upper 0 – 50 cm and the lower 60 – 100 cm
The last stage consists of the fossil analysis and classification which was carried out after scanning the prepared micropaleontology samples, picking of the foraminiferal, identification to species level according to Loeblich and Tappan (1994) and Hayward et al. (2014), photomicrography of foraminiferal assemblages recovered using digital stereo microscope. Opportunistic benthonic foraminiferal species from local foraminiferal communities/assemblages were identified based on highly recognizable morphology, abundant and common in oil contaminated regions (high concentrations in TPH/PAH) and frequent occurrence in various depth layers with high concentrations of TPH/PAH.
RESULTS
The results generated from the study included sedimentary sample descriptions of the core samples which gave the lithologic logs for the cored intervals in the 30 sampled locations; micropaleontology analysis of the core samples for the 30 sampled locations and control sample as well as geochemical analysis of the samples for the 30 sampled locations. The geochemical analysis consists of chromatographic measurements in concentrations of the petroleum hydrocarbons comprising of total petroleum hydrocarbons (TPH) and polycyclic aromatic hydrocarbons (PAH).
SEDIMENTARY SAMPLE DESCRIPTION
Sediment types in the study area ranged from peaty clay, clayey sand, silty sand to sand in lithology, and are presented as lithologic logs in (figs. 3.1 and 3.2).
The different lithologies varied in colour from black for peaty clay, grey – dirty white – brown for clayey sand, and reddish brown – dark grey – milky white for sand. Based on consistency of the lithology, the peaty clay are mostly soft, clayey sand and silty sand are dense while the sands are mostly loose. The grainsizes are mostly fine for the silty sand and majority of the sand with few medium to coarse grains, the clayey sand ranged between fine to medium in grainsize. The top layer of sampled locations is mostly peaty clay followed by clayey sand while sand and silty sand are deposited below.
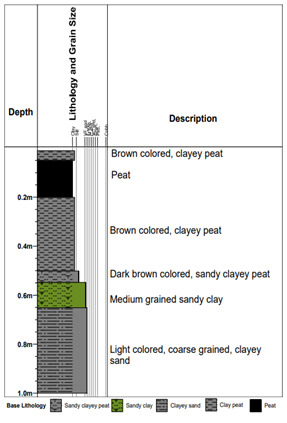
Fig. 3.1: Lithologic description of location 5 sampled from Gokana Local Government area.
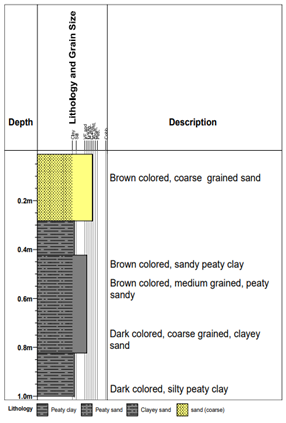
Fig. 3.2: Lithologic description of location 22 sampled from Khana Local Government area.
MICROPALEONTOLOGY ANALYSIS
Foraminiferal recovered in the core samples in the study area showed very low diversity with many locations barren to very low occurrences. Eleven (11) samples (Location 6 – 50cm and 100cm; Location 7 – Top soil, 50cm and 100cm, Location 8 – Top soil and 50cm, Location 10 – 50cm, Location 11 – 100cm and Location 12 – 50cm and 100cm) were completely barren of microfauna. Foraminiferal recovered in the core samples showed very low diversity with many locations barren to very low occurrences. The benthonic foraminiferal identified in the core samples included three (3) diversity which are Lagena inferocostata, Anomalinoidesspp and Ammodiscus spp.
Other micro-fauna identified included Globigerina nepenthe (planktonic foraminiferal), Ostracods, Echinoderm and shell fragments (fig. 3.3). The control sample indicated benthonic foraminiferal ecology that is diverse and abundant including Textulariasagittula, Poritextulariapanamensis, Quinqueloculinapadana, Quinqueloculinaseminulum, Quinqueloculinabicarinata, Cruciloculinatriangularis, Cancrisauriculus, Eponidescribrorepandus, Florilusatlanticus, Florilusboueanum, Zeaflorilusparri, Melonispadanum, Hanzawaiaboueana, Cribroelphidiumdecipiens, Elphidiumadvenum, and Cribroelphidiumsemistriatum.
The micropaleontology results were processed using micropaleontology tool (Strata BUGs v2.0) to show the occurrences of the foraminiferal taxa, their diversities and frequencies as the occurred in the upper and lower composited sections of the core samples for the 30 study locations (figs. 3.4 and 3.5).
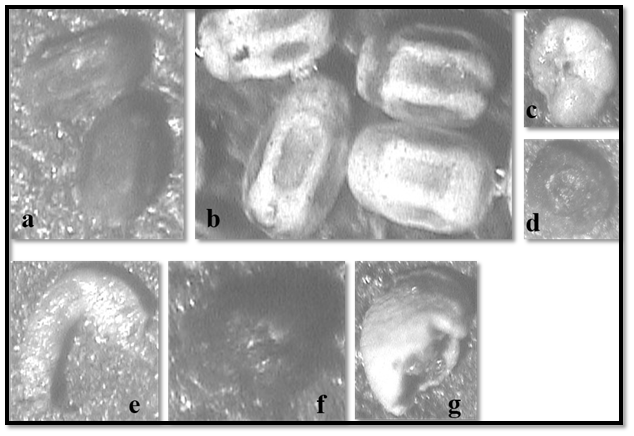
Fig. 3.3: Showing micropaleontology result of the study samples: Biocoenose Lagenainferocostata (a); Thanatocoenose Lagenainferocostata (b); ThanatocoenoseAnomalinoidesspp (c); Biocoenose Ammodiscusspp (d); Thanatocoenose Echinoderm fragment (e); Biocoenose Globigerina nepenthe (f) and Thanatocoenose ostracod fragment (g).
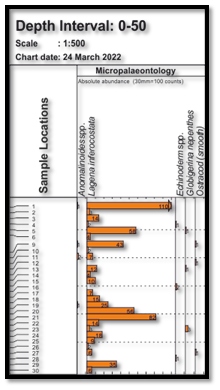
Fig. 3.4: Different frequencies of occurrence of different taxa recovered from the sample preparation and analysis plotted as histograms for 0-50m intervals composited samples.
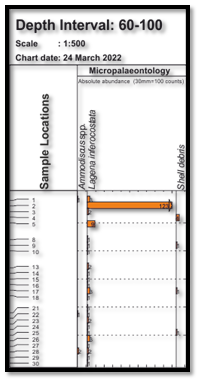
Fig. 3.5: Different frequencies of occurrence of different taxa recovered from the sample preparation and analysis plotted as histograms for 60-100m intervals composited samples.
GEOCHEMICAL ANALYSIS
The results of total petroleum hydrocarbons (TPH) concentrations, concentrations of identified polycyclic aromatic hydrocarbons congeners and combined polycyclic aromatic hydrocarbons (PAH) concentrations are presented in table 3.1, figs. 3.6 and 3.7.
Table 3.1: Concentrations of total petroleum hydrocarbon and polycyclic aromatic hydrocarbon with percentage of polycyclic aromatic hydrocarbon within the total petroleum hydrocarbon.
| location / Depth | TPH | PAH | TPH% | PAH% |
| 1 (0 – 0.5m) | 1050 | 0.34 | 99.97% | 0.03% |
| 1 (0.6 – 1m) | 34.66 | <0.01 | 99.97% | 0.03% |
| 2 (0 – 0.5m) | 129.33 | 0.04 | 99.97% | 0.03% |
| 2 (0.6 – 1m) | 32.32 | <0.01 | 99.97% | 0.03% |
| 3 (0 – 0.5m) | 13210 | 1.99 | 99.98% | 0.02% |
| 3 (0.6 – 1m) | 100.72 | <0.01 | 99.99% | 0.01% |
| 4 (0 – 0.5m) | 14728 | 4.28 | 99.97% | 0.03% |
| 4 (0.6 – 1m) | 65.77 | <0.01 | 99.98% | 0.02% |
| 5 (0 – 0.5m) | 515.92 | 0.07 | 99.99% | 0.01% |
| 5 (0.6 – 1m) | 15.52 | <0.01 | 99.94% | 0.06% |
| 6 (0 – 0.5m) | 15869 | 4.95 | 99.97% | 0.03% |
| 6 (0.6 – 1m) | 67.53 | 0.04 | 99.94% | 0.06% |
| 7 (0 – 0.5m) | 20601 | 5.69 | 99.97% | 0.03% |
| 7 (0.6 – 1m) | 729 | 0.46 | 99.94% | 0.06% |
| 8 (0 – 0.5m) | 9501 | 6.29 | 99.93% | 0.07% |
| 8 (0.6 – 1m) | 353.53 | 0.12 | 99.97% | 0.03% |
| 9 (0 – 0.5m) | 2018 | 0.32 | 99.98% | 0.02% |
| 9 (0.6 – 1m) | 43.74 | 0.01 | 99.98% | 0.02% |
| 10 (0 – 0.5m) | 7420 | 2.93 | 99.96% | 0.04% |
| 10 (0.6 – 1m) | 35.59 | <0.01 | 99.97% | 0.03% |
| 11 (0 – 0.5m) | 37.09 | <0.01 | 99.97% | 0.03% |
| 11 (0.6 – 1m) | 13743 | 5.71 | 99.96% | 0.04% |
| 12 (0 – 0.5m) | 967.82 | 9.55 | 99.00% | 0.10% |
| 12 (0.6 – 1m) | 14731 | 4.99 | 99.97% | 0.03% |
| 13 (0 – 0.5m) | 2079 | 0.47 | 99.98% | 0.02% |
| 13 (0.6 – 1m) | 41.35 | <0.01 | 99.98% | 0.02% |
| 14 (0 – 0.5m) | 210.39 | <0.01 | 100.00% | 0.00% |
| 14 (0.6 – 1m) | 985.47 | <0.01 | 100.00% | 0.00% |
| 15 (0 – 0.5m) | 20612 | 5.27 | 99.97% | 0.03% |
| 15 (0.6 – 1m) | 110.11 | <0.01 | 99.99% | 0.01% |
| 16 (0 – 0.5m) | 77.35 | 0.02 | 99.97% | 0.03% |
| 16 (0.6 – 1m) | 65.57 | 0.1 | 99.85% | 0.15% |
| 17 (0 – 0.5m) | 515.85 | 0.07 | 99.99% | 0.01% |
| 17 (0.6 – 1m) | 14.67 | 0.02 | 99.86% | 0.14% |
| 18 (0 – 0.5m) | 1049.4 | 0.38 | 99.96% | 0.04% |
| 18 (0.6 – 1m) | 176.06 | 0.1 | 99.94% | 0.06% |
| 19 (0 – 0.5m) | 13208 | 1.9 | 99.99% | 0.01% |
| 19 (0.6 – 1m) | 727 | 0.43 | 99.94% | 0.06% |
| 20 (0 – 0.5m) | 9505 | 6.27 | 99.93% | 0.07% |
| 20 (0.6 – 1m) | 352.78 | 0.11 | 99.97% | 0.03% |
| 21 (0 – 0.5m) | 2015 | 0.33 | 99.98% | 0.02% |
| 21 (0.6 – 1m) | 43.54 | 0.04 | 99.91% | 0.09% |
| 22 (0 – 0.5m) | 7720 | 3.15 | 99.96% | 0.04% |
| 22 (0.6 – 1m) | 32.59 | 0.4 | 99.88% | 0.12% |
| 23 (0 – 0.5m) | 2023 | 0.29 | 99.99% | 0.01% |
| 23 (0.6 – 1m) | 53.03 | 0.04 | 99.92% | 0.08% |
| 24 (0 – 0.5m) | 6523 | 3.11 | 99.95% | 0.05% |
| 24 (0.6 – 1m) | 37.95 | <0.01 | 99.97% | 0.03% |
| 25 (0 – 0.5m) | 14763 | 5.59 | 99.96% | 0.04% |
| 25 (0.6 – 1m) | 35.07 | <0.01 | 99.97% | 0.03% |
| 26 (0 – 0.5m) | 213.34 | <0.01 | 100.00% | 0.00% |
| 26 (0.6 – 1m) | 174.06 | 0.09 | 99.95% | 0.05% |
| 27 (0 – 0.5m) | 2087 | 0.49 | 99.98% | 0.02% |
| 27 (0.6 – 1m) | 42.36 | 0.02 | 99.95% | 0.05% |
| 28 (0 – 0.5m) | 958.79 | 9.4 | 99.02% | 0.98% |
| 28 (0.6 – 1m) | 987.38 | 0.01 | 100.00% | 0.00% |
| 29 (0 – 0.5m) | 20609 | 5.44 | 99.97% | 0.03% |
| 29 (0.6 – 1m) | 108.76 | <0.01 | 99.99% | 0.01% |
| 30 (0 – 0.5m) | 14638 | 4.8 | 99.97% | 0.03% |
| 30 (0.6 – 1m) | 67.43 | 0.1 | 99.85% | 0.15% |
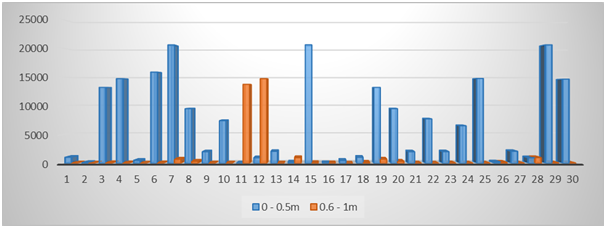
Fig 3.6: Histogram plot of concentrations of total petroleum hydrocarbon (TPH) in the study area.
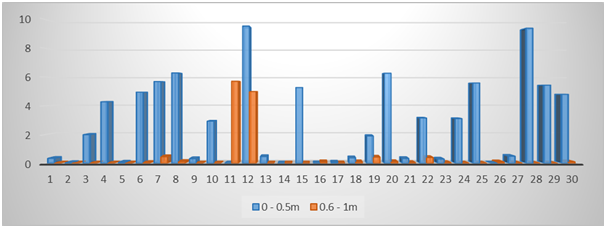
Fig 3.7: Histogram plot of concentrations of polycyclic aromatic hydrocarbon (PAH) in the study area.
DISCUSSION
The results from the core samples were integrated to determine relationships between pollutants and biotic factors with consideration to sedimentary characters of the cores. The core samples consist mostly of peaty clay (comprising of partly decomposed mosses), clayey sands and organic clay in the upper composited section and clayey silt and clayey sand in the lower composited section. Clays are generally known to have very fine grains with very low permeability that does not allow the transmission of fluids, but characteristically swell when absorbed fluid. The sedimentology analysis indicated very high possibilities of absorption and retention of petroleum hydrocarbons within the upper composited sections, based on clayey rock composition.
Total petroleum hydrocarbon in the core samples ranged between 20612mg/kg in location 15 to 37.09mg/kg in location 11 for the upper (0 – 0.5m) composited sections and 14731mg/kg in location 12 to 14.67mg/kg in location 17 for the lower (0.6 – 1m) composited sections (Table 3.1). Polycyclic aromatic hydrocarbon (PAH) in the core samples ranged from 9.55mg/kg in location 12 to <0.01mg/kg in several other locations for the upper (0 – 0.5m) composited sections and 5.71mg/kg in location 11 to <0.01mg/kg in several other locations for the lower (0.6 – 1m) composited sections. Concentrations of total petroleum hydrocarbon in the core samples is generally higher in the upper composited section than in the lower composited sections except for locations 11, 12, 14 and 18. Concentrations of polycyclic aromatic hydrocarbon is also higher in upper composited sections than in lower composited sections except for locations 11, 16 and 26.
Generally, concentrations of total petroleum hydrocarbon and polycyclic aromatic hydrocarbons are higher in the upper composited sections than in the lower
composited sections. These high concentrations of total petroleum hydrocarbon and polycyclic aromatic hydrocarbons in the upper sections of the logged interval is an indication of poor infiltration of hydrocarbon pollutants into the lower composited section resulting from very fine grained clayey rock type with low permeability but very high absorption and retention rate in the upper composited sections of the study area.
Figures (4.1 and 4.2) indicated a relationship between benthonic foraminiferal occurrences, total petroleum hydrocarbon (TPH) and polycyclic aromatic hydrocarbon (PAH) concentrations in the core samples of the study area.
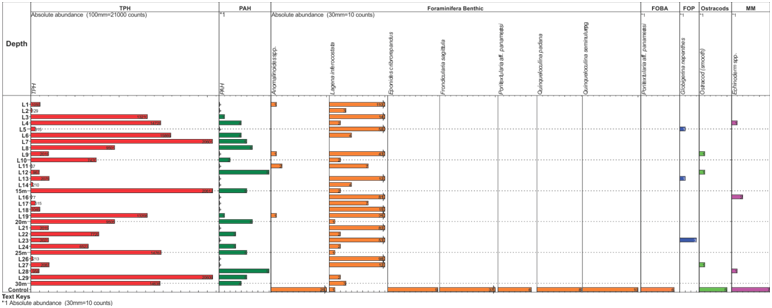
Fig. 4.1: Plot of geochemical analysis (TPH/PAH) with micropaleontology for the upper (0 – 0.5m) composited sections.
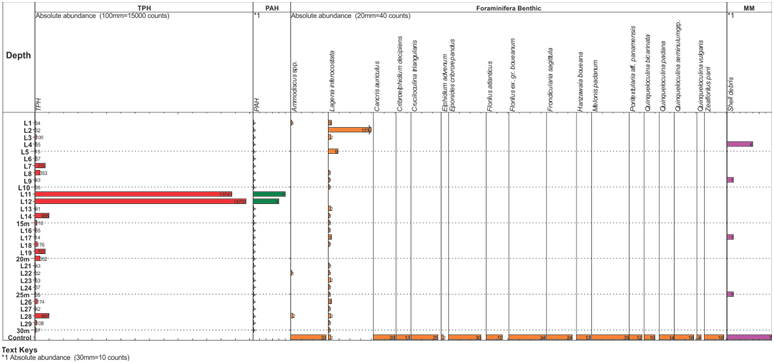
Fig. 4.2: Plot of geochemical analysis (TPH/PAH) with micropaleontology for the upper (0.6 – 1m) composited sections.
Increasing concentrations in total petroleum hydrocarbon (TPH) and polycyclic aromatic hydrocarbon (PAH) decreases benthonic foraminiferal occurrences. This is the result of carcinogenic effect of most polycyclic aromatic hydrocarbon (PAH) congeners identified in the core samples on reproduction in benthonic foraminiferal in the study area.
However, as other benthonic foraminiferal species identified in the study area decreases in frequency of occurrence, Lagenainferocostata increases consistently across the study locations in the study area providing an index opportunistic species for the study area.
CONCLUSION
The study area indicated decreasing frequency of occurrences of benthonic foraminiferal with increasing concentrations in total petroleum hydrocarbon (TPH) and polycyclic aromatic hydrocarbon (PAH) on a general note. However, as other benthonic foraminiferal species identified in the study area decreases in frequency of occurrence, Lagenainferocostata increases consistently across the study locations in the study area providing an index opportunistic species for the study area.
Lagenainferocostata was first described by Cushman, 1913 in “A Monograph of the Foraminifera of the North Pacific Ocean”. Lagenainferocostata consists an elongate test that is fusiform or sub-cylindrical in shape and has a central portion with nearly parallel sides. It is abruptly pointed at either end with a lower portion costate, the coarse costse meet in a ring at the base of the test while the upper portion of the test is without a costse and nearly smooth except for a reticulation of irregularly placed depressions. The aperture style is circular without a definite neck. It is about 0.35mm in length.
REFERENCES
- Aguilera, F., Méndez, J., Pásaro, E., &Laffon, B. (2010). Review on the effects of exposure to spilled oils on human health. Journal of Applied Toxicology, n/a-n/a. https://doi.org/10.1002/jat.1521
- Armynot du Châtelet, E., Debenay, J., &Soulard, R. (2004). Foraminiferal proxies for pollution monitoring in moderately polluted harbors. Environmental Pollution, 127(1), 27-40. https:// doi.org/10.1016/s0269-7491(03)00256-2
- Armynot du Châtelet, É., &Debenay, J. (2010). The anthropogenic impact on the western French coasts as revealed by foraminifera: A review. Revue de Micropaléontologie, 53(3), 129-137. https://doi.org/10.1016/j.revmic.2009.11.002
- Cushman, J. A. (1913). A monograph of the Forminifera of the North Pacific Ocean pt. 3: Lagenidae. Bulletin of the United States National Museum, (71), i-ix, 1-125, 47 pls. https://doi.org/10.5479/si.03629236.71.3
- Ernst, S., Morvan, J., Geslin, E., Le Bihan, A., &Jorissen, F. (2006). Benthic foraminiferal response to experimentally induced Erika oil pollution. Marine Micropaleontology, 61(1-3), 76-93. https://doi.org/10.1016/j.marmicro.2006.05.005
- Foraminifera – The world foraminifera database. (n.d.). WoRMS – World Register of Marine Species. https://www.marinespecies.org/foraminifera/
- Francis P. Shepard. (1954). Nomenclature based on sand-silt-clay ratios. SEPM Journal of Sedimentary Research, Vol. 24. https://doi.org/10.1306/d4269774-2b26-11d7-8648000102c1865d
- GONZALEZDONCEL, M., GONZALEZ, L., FERNANDEZTORIJA, C., NAVAS, J., & TARAZONA, J. (2008). Toxic effects of an oil spill on fish early life stages may not be exclusively associated to PAHs: Studies with prestige oil and medaka (Oryziaslatipes). Aquatic Toxicology, 87(4), 280-288. https://doi.org/10.1016/j.aquatox.2008.02.013
- Incardona, J. P., Gardner, L. D., Linbo, T. L., Brown, T. L., Esbaugh, A. J., Mager, E. M., Stieglitz, J. D., French, B. L., Labenia, J. S., Laetz, C. A., Tagal, M., Sloan, C. A., Elizur, A., Benetti, D. D., Grosell, M., Block, B. A., &Scholz, N. L. (2014). Deepwater Horizon crude oil impacts the developing hearts of large predatory pelagic fish. Proceedings of the National Academy of Sciences, 111(15). https://doi.org/10.1073/pnas.1320950111
- Lamont, M. M., Carthy, R. R., & Fujisaki, I. (2012). Declining reproductive parameters highlight conservation needs of loggerhead turtles (Carettacaretta) in the northern Gulf of Mexico. Chelonian Conservation and Biology, 11(2), 190-196. https://doi.org/10.2744/ccb-1006.1
- Loeblich, A. R., & Tappan, H. (1994). Foraminifera of the Sahul Shelf and Timor Sea. Cushman Foundation for foraminifera Research Special Publication, 12(4), 661. https://doi.org/10.2113/gsjfr.12.4.377
- Mojtahid, M., Jorissen, F., Durrieu, J., Galgani, F., Howa, H., Redois, F., & Camps, R. (2006). Benthic foraminifera as bio-indicators of drill cutting disposal in tropical east Atlantic outer shelf environments. Marine Micropaleontology, 61(1-3), 58-75. https://doi.org/10.1016/j.marmicro.2006.05.004
- Morvan, J., Le Cadre, V., Jorissen, F., &Debenay, J. (2004). Foraminifera as potential bio-indicators of the “Erika” oil spill in the Bay of Bourgneuf: Field and experimental studies. Aquatic Living Resources, 17(3), 317-322. https://doi.org/10.1051/alr:2004034
- Peterson, C. H. (2001). The “Exxon Valdez” oil spill in Alaska: Acute, indirect and chronic effects on the ecosystem. Advances in Marine Biology, 1-103. https://doi.org/10.1016/s0065-2881(01)39008-9
- Richard Casey. (1980). Preliminary report on Microplankton and Microbenthon responses to 1979 Gulf of Mexico oil spills (Ixtoc I and Burmah agate), with comments on avenues of oil to sediments and fate of oil in column and on bottom: Abstract. AAPG Bulletin, 64. https://doi.org/10.1306/2f9195df-16ce-11d7-8645000102c1865d
- Romero, R., Guitián, J., & Ruiz‐Olmo, J. (2011). Changes in the diet of coastal otters after the prestige oil spill (Galicia, north‐west Spain). Journal of Zoology, 286(1), 22-29. https://doi.org/10.1111/j.1469-7998.2011.00838.x