
Natural Gas Consumption and Price Stability in Top Gas-Producing Countries in Africa
- Victor Okechukwu Nwatu
- Alwell Nteegah
- Adewale Dosumu
- 1096-1108
- Dec 11, 2023
- Science & Technology
Natural Gas Consumption and Price Stability in Top Gas-Producing Countries in Africa
Victor Okechukwu Nwatu1, Alwell Nteegah2 & Adewale Dosumu3
1&3Emerald Energy Institute, University of Port Harcourt
2Department of Economics University of Port Harcourt
DOI: https://dx.doi.org/10.47772/IJRISS.2023.7011084
Received: 08 November 2023; Accepted: 14 November 2023; Published: 11 December 2023
ABSTRACT
This study investigated the effects of natural gas consumption on price level in top gas producing countries in Africa namely; Algeria, Angola, Egypt, Gabon, Libya and Nigeria. Natural gas consumption was measured in terms of natural gas used/utilized in the countries domestic economy, price of natural gas and motor gasoline energy consumption of the countries while price level was captured in term of consumer price index (CPI) also of the countries of interest. The Panel Autoregressive and Distributed Lag (PARDL) was used to analyse data sourced after descriptive statistics and panel unit root tests. The results revealed that natural gas consumption had positive and substantial influence on consumer price index or inflation. Natural gas price had negative but insignificant effect on price level while motor gasoline energy consumption had negative and substantial effect on price level (consumer price index) in the top-gas producing African countries. The result also shows that a long run relationship existed between natural gas consumption and price level in the top-gas producing countries in Africa. Based on these results/findings, the study recommended policies that will enhance a stable natural price and domestic refining and consumption of motor gasoline energy in order to stabilize price level in Africa especially the gas producing countries.
Key words: Natural Gas Consumption, Natural Gas Price, Consumer Price Index and Motor Gasoline Consumption
INTRODUCTION
Despite the fact that natural gas is cheap, clean, and safe for the environment and that gas reserves outnumbered oil reserves, in congruent with Solarin and Ozturk (2016), oil continues to enjoy preferential treatment at the cost of the real sector in many gas-producing African nations. Furthermore, consumption of natural gas in the gas-producing nations of Africa has never been low but the amount of gas reserves that can be utilised to produce power is rather very little. This low gas consumption is seen in key economic sectors including transportation, housing, and business, which has a detrimental impact on macroeconomic performance especially sustained economic growth through increase production and price stability.
In order to encourage, stimulate, and enhance macroeconomic performance, Maji, Chindo, and Abdul-Rahim (2019) found that a number of African gas-producing nations have not yet extracted and employed their natural gas resources optimally. African nations that produce gas also still have trouble getting enough energy and natural gas for industrial use. The cost of natural gas, conversely, has a substantial impact on how much natural gas is employed in African nations that produce it.
Given the critical role natural gas play in economic prosperity of a nation especially in producing energy needed for increase production and maintaining a stable price level some studies have been carried out on the relationship between natural gas consumption and economic performance (Destek & Aslan, 2017; Tariq, Sun, Haris, Javaid & Kong, 2018; Zhi-Guo, Cheng, & Dong-Ming, 2018; Maji, Chindo & Abdul-Rahim, 2019; Galadima & Aminu, 2019; Olabanji & Adeolu, 2020; Mosikari & Eita, 2020; Awodumi & Adewuyi, 2020; Abubakar, Ibrahim, Ibrahim & Hassan, 2022). Relative to the existing studies in relation to natural gas consumption and macroeconomic performance, very few empirical studies exist on the contribution of natural to addressing the problem of rising price level in gas producing countries especially those of African extraction. It should be noted that natural gas constitutes a major source of energy outside crude oil in oil/gas producing countries. Also, natural gas tends to be cheaper compared to products of crude oil (Premium Motor Spirit, Automated gas oil and Dual-Purpose Kerosene) which are major sources of industrial and domestic energy in developing countries.
Development in the world economy since the beginning of war between Russia and Ukraine in 2021 revealed rising price level in countries due to oil/gas trade restrictions imposed on Russia by the European Union and the fall in oil and gas supply to major world economies. Statistical evidence from the World Bank revealed that Algeria’s inflation rate in 2022 was 9.27%, a 2.04% rise from 2021 and a 4.81% increase from 2020. In Angola inflation rate increased from 22.27% in 2020 to 25.75% in 2021 after the government decision to end supporting the Kwanza and cut gasoline subsidies. Inflation rate in Egypt rose from 9.15% in 2019 to 13.90% in 2022. Gabon was not spared in the price rise. Its inflation rate rose from 1.7% in 2020 to 4.25% in 2022. Libya also had its own dose with price level rising from 2.8% in 2021 to 4.6% in 2022. In Nigeria, price level rose from 11.4% in 2019 to 16.95% in 2021 and 18.85% in 2022.
This rising price level has serious implications on production, consumption, wellbeing of the people and the economy at large. Based on this scenario, it is therefore pertinent to analyze the effects of natural gas consumption on price level of Top-gas producing countries. This study is crucial for the development of natural gas in gas producing African countries and the over economic development of the countries of interest. This study focuses on top gas-producing African countries (Algeria, Angola, Egypt, Gabon, Libya and Nigeria) using panel data that range from 1990 to 2021. We shall continue our discussion by reviewing relevant literature on the issues under investigation, this is followed by outlining the methodology employed to achieved the purpose of the study, results of data analysis, findings and concluding remarks.
LITERATURE REVIEW
In congruent with Stern (2004), energy quality is the relative utility of various fuels and electricity per heat equivalent unit. Most often, energy quality is measured utilising the marginal product of a certain fuel, which is the utility offered by an extra unit of the fuel. It should be noted that the utility being discussed here refers to the product or service that utilising this fuel upshots in, either directly or indirectly. It is crucial to keep in mind that the extra unit of product or service that a certain kind of fuel produces depends on a variety of variables, including the unique qualities that only that fuel has. In congruent with Stern and Cleveland’s 2004 book, Energy and Growth of the economy, each fuel source is evaluated owing to its physical scarcity, ability to do meaningful work, energy density, cleanliness, suitability for storage, safety, flexibility of usage, cost of conversion, and price per unit of fuel.
It is notable, however, that the marginal product of fuels is not determined only in light of the aforementioned characteristics. It mostly depends on the purpose of the fuel and the extent to which other production elements are combined with it. Simply expressed, the proportion of the energy source itself and the other inputs of production that are utilised determine the marginal product of energy. Because economic theory emphasises that the price paid for an energy source should be proportionate to its marginal product, an examination of the prices of various energy sources demonstrates their worth. Electricity, natural gas, oil, coal, wood and other biofuels are graded in this respect in declining order of quality.
Samuel Schurr conducted examination on the critical role that energy quality plays in productivity, first on his own and then with Hans Landsberg. He believed that the quantity of energy needed to produce a single dollar unit of GDP would decrease as more people switched to better quality fuels. He believes that if this assessment of the true contribution of energy (efficiency) is disregarded, the total factor productivity (TFP) will become excessively inflated. It was found that switching from coal to comparably more efficient fossil fuels like oil and natural gas enhanced energy efficiency and decreased energy intensity. These upshots were corroborated by the examination of Robert Kaufmann and Cutler Cleveland. It should be highlighted, however, that this is restricted to the supply and demand of these alternative fuels, as is customary. Therefore, when countries run out of fuels that are highly efficient, they would only have high intensity fuels remaining to power their GDP in the future. This implies the nature/type of energy use go a long way to determine the cost implications of such energy source on production, consumption and the environment. Natural gas has been identified as a transition fuel between fossil fuel and renewable energy due to it availability, affordability and environmental friendliness. It is therefore imperative to study how its consumption has affected price level in selected natural gas producing countries in Africa.
Dihor, Alekseeva and Lomtatidze (2020) investigated association amongst economic development and (NG) natural gas-consumption in Malaysia by utilizing data from the year 1971 to the year 2012. The study adopted foreign-direct-investment (FDI), capital formation and trade openness as the control variables. This Malaysian study found a direct positive influence on economic development of the factors utilizes as (FDI) foreign-direct investments, consumptions of the natural gas (NG), trade-openness also capital formations. The outcomes of the research sustenance the occurrence of feedback assumption amongst economic development and consumptions of the natural gas-NG, economic development and (FDI) foreign-direct investment, and (FDI) foreign-direct investment and consumption of (NG) natural gas.
Li, She, Gao, Li, Yang and Shi (2020) carried out an analysis of global natural gas resources status, trade pattern and development trend. The study reviewed the development process, current situation, trend and problems in natural gas industry in China, then made prospect analysis and judgment in terms of demand and supply, etc., and finally put forward some reasonable and sustainable strategic countermeasures and proposals. The following results were obtained. (1) The comprehensive energy elasticity coefficient method was adopted to predict that the natural gas consumption volume in 2030 will be about 650 billion cubic meters. (2) Affected by many factors such as energy supply side reform, industrialization and urbanization, the growth rate of domestic natural gas consumption is much higher than that of production and the development of natural gas industry still faces a series of problems. (3) It is necessary to strengthen the exploration and development of natural gas to ensure the increase of domestic natural gas storage and production. (4) Diversified import channels should be continuously expanded to disperse the risk of excessive growth of natural gas dependence on foreign countries. (5) The construction of national and dynamic interconnection system and hub should be accelerated. (6) China should rationalize the price mechanism of natural gas, gradually open the control on industrial and seasonal consumption, and strengthen the overall sales guidance in the national market.
Dada (2019) examined energy consumption and economic growth dynamics with particular consideration to simultaneous inclusion of public sector investment and foreign trade variables in Nigeria between 1981 and 2018, following an ARDL modeling approach. The result showed that energy consumption among other variables has a positive but non-significant impact on growth in the short run. However, in the long run, energy consumption has a positive and significant impact on growth. The result also showed that while public investment and exports contributed positively, imports and trade deficits contributed negatively but significantly to economic growth both in the short and long run. The implication of this finding is that, in order to boost economic growth, energy policy should be geared toward raising energy consumption and export trade while reducing import and trade deficits. Therefore, the study concluded that energy consumption amidst public and foreign sector variables dynamically contributed to the economic growth process in Nigeria during the period under examination.
Okwanya and Abah (2018) investigated the impact of energy consumption on poverty reduction in a panel of 12 African countries over a period of 1981-2014. Using the Fully Modified Ordinary Least Square (FMOLS) method, the study showed that a long-run negative relationship exists between energy consumption and poverty level, which underscores the importance of energy in poverty reduction in the selected African countries. The result also indicated that other variables such as capital stock and political stability have significant effect on poverty reduction implying that these factors play critical role in reducing poverty. Furthermore, the granger causality test showed that a short-run unidirectional causality runs from energy consumption to poverty. The findings clearly suggested that increasing energy consumption leads to a decline in poverty level. The study therefore recommended that the government in the selected countries should improve infrastructure and maintain political stability in order to maximize the effect of energy consumption on poverty reduction.
Reuben (2016) carried out empirical analysis of determinants of natural gas flaring in Nigeria. With a focus on the long run, the study employed the Autoregressive Distribution Lag bounds test to cointegration approach to search for the determinants of natural gas flaring in Nigeria using secondary data from 1984-2013. Empirical result identified natural gas flaring penalty, crude oil production, natural gas price, natural gas marketization and lack of natural gas infrastructure as fundamental determinants of natural gas flaring in Nigeria. Crude oil production contributed the highest to the increase in natural gas flaring while natural gas marketization has the greatest impact on gas flaring abatement. The key conclusion from this paper is that the implementation of policies targeting optimal natural gas flaring can result in natural gas flaring mitigation in the long run and put Nigeria on the path towards meeting the 2030 World Bank deadline on cessation of routine natural gas flaring.
Solarin and Ozturk (2016) investigated the relationship of natural gas utilization with output growth of twelve OPEC members. The study utilized data from the period of 1980-2012. Applying panel granger causality technique, the findings of the overall OPEC nations showed the presence of bi-directional causal connections among natural gas and economic growth. As for the individual levels, the results of the study reported the existence of uni-directional causal connections and the confirmation of growth effect in the countries of Saudi Arabia, Iraq, Libya, Kuwait and Nigeria. Furthermore, the evidence of conservation effect was found in the nations of Iran, Venezuela, Algeria and United Arab Emirates. As for the rest of the countries, the study failed to find any causal connections among natural gas and economic growth.
Balitskiy, Bilan, Strielkowski and Štreimikienė (2016) examined the relationship of natural gas with economic development of twenty-six European Union states. The study utilized data from the period of 1997-2011. In order to perform two-way statistical investigation, the authors applied error correction model (ECM) to investigate causal connections among the variables. The results of analysis association revealed that the relationship between natural gas and output growth is significant negative, whereas, the association between output growth and natural gas is significant positive in the sampled countries.
Mastorakis and Yazdi (2014) investigated the impact of the gas production, gas use and gas flaring on economic growth of the Republic of Congo during the period 2006-2019. The results of the unit root test revealed that the bulk of variables are stationary at level and therefore integrated of order zero, however, labor input which is stationary at first difference and integrated of order one. The test of Johansen cointegration showed that all-time series are cointegrated and have a long-run equilibrium relationship. The study also performed the Granger-causality test which proves that only gas production and gas utilization cause economic growth in our study. The OLS regressions suggested that gas production impacts adversely and significantly GDP while gas utilization significantly stimulates GDP.
De Gregorio et al (2007) studied the nexus between low pass-through of oil prices and domestic price level via the estimation of augmented Phillips curves with the aid of data from low-income and high-come countries. They found from the study a significant reduction in the pass-through effect in developed countries and attributed the reduction to a fall in oil intensity and the level of the exchange rate pass-through. In another study by Álvarez et al. (2011) found that the direct effect of higher oil prices on price level in the euro countries had risen over the period due to the increasing spending proportion of households’ income on petroleum products, while its second-round and inverse effect declined over time.
In another study by Apergis (2011) found that the rising price levels in Greece are transported by the energy price variables, such as: electricity price index, energy price index and gas and fuels price index. He also found the food and vegetable price index and the service price index formed significant share of the indirect effect. In analyzing the direction of effect, the author found that energy price uncertainties are unidirectionally linked to the other components of Consumer Price Index. However, the study found no evidence of innovations (shocks) on price level (consumer price index). This implies that any rise in fuel prices could be transmitted to other sectors of the economy. This is because increase in fuel (gas) price raises energy bills which reduce consumers’ utility and increase cost of production. An increase in unit cost of production will raise price of goods and services and increase price level with a second-round effect.
Choi et al. (2017) analysed the trend in global real oil prices from January 1970 to June 2017. The study found that two oil crises occurred in the 1970s, cumulating into high global price hike. They found that oil prices declined in the 1980s, coinciding with the genesis of great moderation. They attributed the transient increase in oil prices in the 1990s to the Persian Gulf war. In the 2000s, oil prices increased consistently with a sharp rise in 2008, but a dropped was witnessed in 2009 and later a recovery ensued. The persistent instability in oil and energy prices in the global economy had raised concerns that oil prices could once again contributes to rising price level all over the world. At the end of 2014, global oil prices fell to a very low level of $43 per barrel and price continued until 2020, causing decline in price level in most economies. As a result of the outbreak in COVID-19 pandemic in 2020 oil price fell even more sharply to $16 per barrel. However, after the reduction in the spread of the disease, oil/energy prices have steadily risen to almost $100 per barrel currently. The rising price level in 2021 could be traceable to the increasing demand as most world economies adapted to the COVID-19 pandemic, tight labour markets, supply chain disruptions and the recovery of energy prices from the low prices recorded during the period of disease.
In a study by Abdallah and Kpodar in 2020, on how domestic inflation react to fuel price shocks found that price increases led a significant and persistent inflationary effect than price decreases in both developed and developing economies. The study found that this lack of equality is present in standard shocks but could not be found in small shocks but is more pronounced in large shocks. The authors submitted that this may have a direct implication on government revenue and expenditure in different economies.
In a related work on the effect of energy price on price level by Devore and Olson in the year 2020, they discovered that the striking stability between natural gas prices and expected inflation is static over time (period from the mid-1980s to 2020). They also found that the degree of relationship between natural gas prices and expected price level does not depend on time and very stable at around 0.30. To the authors, this may increased when there are shocks but appeared to be very stable. However, another study by Sussman and Osnat in 2015 found that the correlation between oil prices and medium-term inflation expectations (though a different measure of inflation from the one used by Devore and Olson) is highly dependent on time and had risen since the global financial crisis in 2008. The study attributed the paucity of public trust in the efficacy of monetary authorities to curb price hikes as the major factor contributing to this occurrence in the world economies especially the developing countries.
Most of the studies reviewed centred on energy consumption or natural gas consumption and economic growth and energy price and inflation level. Very little works analyse the effects of natural gas consumption on price level amongst countries of the world. Given the critical role energy consumption and price (especially natural gas which has been regarded as a transition energy) play in macroeconomic performance of an economy, it is necessary to study how natural affect price level in top gas producing countries of Algeria, Angola, Egypt, Gabon, Libya and Nigeria over the period 1990 – 2021
METHODOLOGY
This study examines the effects of natural gas consumption and price stability in some top natural gas producing countries in Africa namely: Algeria, Angola, Egypt, Gabon, Libya and Nigeria. Energy consumption and its cost have serious implication on the productive capacity and price level of nations, both globally and regionally. Energy is spent via the production process (in a quantity that is related to its price), and the output of the production process has an impact on cost of production, consumption and general wellbeing of a nation and the relevant economic region. Consequent upon this linkage, a functional relationship incorporating price level (consumer price index) of the selected top natural gas producing African countries of: Algeria, Angola, Egypt, Gabon, Libya and Nigeria and natural gas consumption, gasoline consumption and price of energy are combined in a model below:
CPIit = f(NGCit, NGpit, MGCit) 1
Given that the variables of interest are combination of I(0) and I(1) process, then we resort to panel autoregressive distributed lag (ARDL) proposed by Pesaran et al. (1999). The benefit and the superiority of the panel ARDL model is that, it can be applied regardless of whether the selected variables in the model are purely I(0) or purely I(1) or partly integrated. The import function can be simply stated as:
![]() 2
2
Where: Cpiit = Consumer price index (price level). NGCit = Natural Gas Consumption (in billion scf), NGPit = Natural Gas Price (USD per million cubic feet) MGCit = Motor Gasoline Consumption (in millions of litres), ![]() = coefficient of the variables, μit= error term of the regression; i = Top gas producing countries t = time frame
= coefficient of the variables, μit= error term of the regression; i = Top gas producing countries t = time frame
Following Shin et al. (2011), we specify the nexus between economic growth and natural gas consumption, price of natural gas and gasoline energy consumption in a panel ARDL form as:
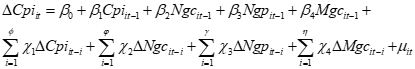 3
3
Where: Cpiit= Consumer price index, Ngcit= natural gas consumption, Ngpit= natural gas price and Mgcit=gasoline energy consumption for the sample countries, which is assumed to be exogenous to the sample countries. The long run coefficients are β1; β2; β3 and β4 while the short run coefficients are ![]() If cointegration is established then Eq. (3) can be written in a panel error correction model (PECM) as:
If cointegration is established then Eq. (3) can be written in a panel error correction model (PECM) as:
![]() 4
4
Where: ecmt-1 is the error correction part and θ is the speed of adjustment from the short run dynamics to the long run equilibrium. The ecm coefficient, θ; is expected to be negative and significant for long run equilibrium to exist between economic growth, natural gas consumption, natural gas price and gasoline energy consumption.
RESULTS
Table 1: Descriptive statistics
| Variable | Mean | Std.Dev. | Min | Max | Observations |
| ngc overall amid within | 449.80 | 534.18
488.10 292.75 |
2.50
6.82 -406.57 |
2138.00
1142.37 1445.43 |
N = 180
n = 6 T = 30 |
| ngp overall amid within | 5.76 | 3.29
0.00 3.29 |
2.13
5.76 2.13 |
13.41
5.76 13.41 |
N = 180
n = 6 T = 30 |
| mgc overall amid within | 64.40 | 67.01
60.09 38.28 |
0.90
1.43 -32.17 |
338.00
166.57 235.84 |
N = 180
n = 6 T = 30 |
| cpi overall amid within | 88.98 | 65.71
12.02 64.78 |
2.22
79.58 8.67 |
378.88
112.11 387.55 |
N = 180
n = 6 T = 30 |
Computed Result (Stata 16)
Table 1, shows the entire dataset while still displaying the differences that exist across and between the components of the data set. For the dataset considered as a whole, from these two that are captured, the mean is non-zero, which shows that the dataset has not been modified by any extra computation to de-mean it. The change of variable to log does not qualify as any extra computation to give it a zero mean and manageable standard deviation (our unit of variation from the mean). Also, the standard deviation value ranges between 0.1 and 0.9. Natural gas consumption showed to be the most volatile of the data set. Similar trend is shown when the dataset is considered individually for each year (T=30) and for all the countries (n = 6). The only difference is when the countries are considered together, but the natural gas price has not changed between them, which gives a standard deviation value of zero as it did not vary country-by-country.
Table 2: Panel cross-sectional dependence test Result
| Models | Breusch–Pagan LM cross-sectional independence test statistics i.e., chi2 | p-value |
| lncpi | 96.96*** | 0.00 |
Computed Result (Stata 16)
Another essential preliminary test conducted is the cross-sectional dependency (CSD) test. The typical presumption in panel data analysis is that panel model disturbances are cross-sectionally independent, particularly when a large cross-section (N) is involved. In contrast, cross-sectional dependency in panel analysis does not seem to be an exception in reality (Adams & Klobodu, 2017; Beckmann & Czudaj, 2017; Pesaran, 2004), hence it cannot be ignored. Assuming cross-section independence may thus provide substantial challenges that might lead to estimator inefficiency and inaccurate test estimates. While Pesaran’s (2004) cross-sectional dependency (CSD) test is intended for short panels or panel data with infinite N (i.e., N ) and finite T, Christopher F. Baum’s (2006) Breusch-Pagan LaGrange Multiplier (Breusch-Pagan LM) test is valid for tiny N as T . The Breusch-Pagan LM test is thus the appropriate test for this investigation. For the three models in Table 2, the Breusch-Pagan LM test of independence strongly rejected the null hypothesis of cross-sectional independence at a 1 percent level of significance, demonstrating the presence of cross-sectional dependency. This result made it clear how crucial it is to take cross-unit lagged dependency into consideration via the study’s participating nations. This cross-sectional dependency suggested that the study’s effects or interactions amid its variables were very varied across nations, necessitating a consideration of the particular country when examining a reaction to shock can lead to a bias assessment of the nations who produce the most oil.
Table 3: Second generation (Heterogeneous) panel unit root tests Result
| Variable | NGC | ln NGC | NGP | ln NGP | MGC | ln MGC | CPI | ln CPI |
| Im-Pesaran-Shin (IPS)
Level First Difference Status |
-2.28
(-2.69) -5.38** (-2.93) I(1) |
-2.69
(-2.69) -5.88** (-2.93) I(1) |
-1.59
(-2.69) -5.32** (-2.93) I(1) |
-1.38
(-2.69) -5.00** (-2.93) I(1) |
-2.14
(-2.69) -4.33** (-2.93) I(1) |
-2.14
(-2.69) -4.94** (-2.93) I(1) |
0.91
(-2.69) -3.07** (-2.93) I(1) |
-1.55
(-2.69) -3.33** (-2.93) I(1) |
| ADF – Fisher
Level First Difference Status |
2.89
(1.00) 108.99** (0.00) I(1) |
8.27
(0.76) 117.70** (0.00) I(1) |
7.46
(0.83) 82.15** (0.00) I(1) |
5.66
(0.93) 93.66** (0.00) I(1) |
1.50
(0.99) 60.90** (0.00) I(1) |
1.59
(1.00) 69.50** (0.00) I(1) |
1.50
(0.99) 41.65** (0.00) I(1) |
33.63** (0.00)
– I(1) |
| PP-Fisher
Level First Difference Status |
3.72
(0.99) 174.75** (0.00) I(1) |
10.87
(0.54) 181.19** (0.00) I(1) |
8.91
(0.71) 148.23** (0.00) I(1) |
6.74
(0.87) 131.04** (0.00) I(1) |
1.44
(0.99) 103.07** (0.00) I(1) |
1.87
(1.00) 133.54** (0.00) I(1) |
1.31
(1.00) 28.87** (0.00) I(1) |
59.28** (0.00)
– I(1) |
Note 1: (**) and (*) indicates substantial at 1 percent and 5 percent level respectively. Note 2: While the 5 percent critical value are in bracket (..) under the IPS test statistics, the p-value are in bracket (..) under the ADF and PP Fisher test statistics
Source: Computed Result (Stata 16)
The study also evaluated the stationarity of the variables utilising panel unit root tests, assuming heterogeneous slopes, since Pesaran’s CSD test demonstrated cross-sectional dependency across units, suggesting that the panel was heterogeneous. Im, Pesaran & Shin test (IPS), Choi test or ADF-Fisher, Maddala-Wu test or Phillips-Perron (PP)-Fisher chi-square are some of the heterogeneous panel unit roots tests employed. The results in Table 3 revealed that, there appeared to be a consistency amid the heterogeneous panel unit roots tests that the natural gas price (NGP), consumption of natural gas (NGC), motor petrol consumption (MGC) and consumer price index (CPI) only became stationary after passing via the first differencing process. The heterogeneous panel unit roots tests also appeared to agree that the natural log of CPI, NGP, NGC, and MGC only became stationary after undergoing the first differencing process.
Table 4: Kao Cointegration Test result
| Dep. Var | Modified Dickey-
Fuller |
Dickey- Fuller | Augmented Dickey
Fuller |
Unadjusted Modified
Dickey-Fuller |
Unadjusted Dickey-
Fuller |
Comments |
| lncpi | -6.24**
(0.00) |
-4.33**
(0.00) |
4.79**
(0.00) |
-2.46**
(0.00) |
-4.53**
(0.00) |
Cointegration |
Note: (**) and (*) indicates substantial at 1 percent and 5 percent level respectively.
Source: Computed Result (Stata 16)
Table 5: Pedroni Panel Cointegration Test Result
| Dependent Variable | Modified Phillips-Perron | Phillips-Perron | Augmented Dickey Fuller | Comments |
| Lncpi | 2.63** (0.00) | 1.26 (0.10) | 1.63* (0.05) | Cointegration |
Note: (**) and (*) indicates substantial at 1 percent and 5 percent level respectively.
Source: Computed Result (Stata 16)
Tables 4 and 5 include the result of the panel cointegration testing. The result of the Kao and Pedroni cointegration tests demonstrate that the variables in each of the Consumer price index (CPI) model have a long-term connection. This demonstrates that the explanatory variables may go from a state of disequilibrium in the near term to one of equilibrium in the long term.
Estimation Results for Arellano-Bond Dynamic Panel Consumer Price Index (CPI) Model
The result of the Arellano-Bond dynamic panel estimation utilising LNCPI as the dependent variable are shown in Table 6. First, the result demonstrates that the level LNCPI benefited from the one-period lag of the LNCPI. The one-period lag of the LNCPI coefficient is statistically substantial at the 1 percent threshold of substantial error, in congruent with the p-value. Second, the consumption of natural gas estimate showed a positive sign, suggesting that consumption of natural gas had a beneficial effect on the consumer price index in nations that produced oil during the time period under consideration. Additionally, the p-value of the consumption of natural gas coefficient demonstrates that the variable is statistically substantial at the 1 percent threshold of substantial error. Third, the natural gas price estimator showed an adverse sign, indicating that natural gas prices had an adverse effect on consumer price indices in nations that produced oil during the time period under consideration. Even at a 10 percent level of substantial error, the variable is not statistically substantial, in congruent with the p-value of the coefficient of natural gas prices. Additionally, the motor petrol consumption estimator had an adverse sign, indicating that it had an adverse impact on the consumer price index in countries that produced oil during the study period. The p-value of the coefficient is statistically substantial at the 1 percent level of substantial error.
The Wald statistic for the null hypothesis that all the coefficients save the constant are zero is also reported by Arellano-Bond Dynamic Panel Estimation. Since the chi2 statistics’ p-value 4.9 is less than 0.05, we get the conclusion that the null hypothesis that all the coefficients except from the constant are zero is categorically rejected.
Table 7: Arellano-Bond Dynamic Panel Estimation to find out impact of Natural Gas Price on Consumer Price Index (CPI)
| Lncpi | Coeff. | Std.Error | Z | P˃|z| | ||
| Lncpi L1 | 0.9230*** | 0.0074 | 125.28 | 0.000 | ||
| Lnngc | 0.1451*** | 0.0389 | 3.73 | 0.000 | ||
| Lnngp | -0123 | 0.0347 | -0.36 | 0.722 | ||
| Lnmgc | -0.1942*** | 0.0517 | -3.75 | 0.000 | ||
| Constant | 0.4154*** | 0.1622 | 2.56 | 0.010 | ||
| Wald chi2 = 36107.92 | | | Prob ˃ chi2 = 0.0000 | ||||
Note 1: (***), (**) and (*) indicates substantial at 1 percent, 5 percent and 10 percent level respectively. Note 3: The internal instruments employed are lnngc and lnmgc.
Source: Computed Result (stata 16).
Post-Estimation Diagnostics Result for Arellano-Bond Dynamic Panel Inflation Model
The p-values for AR (1) and AR (2) are larger than 0.05, as shown in Table 8. This suggests that the second-order and higher-order idiosyncratic error terms, which are associated at levels, are serially uncorrelated. Therefore, with regard to the consumer price index dynamic panel model, we should reject the null hypothesis that there is no first-order and second-order serial correlation in first differences (AR (1) test) and higher-order serial correlation in first differences (AR (2)).
Table 8: Result of Post-estimation tests on Arellano-Bond Dynamic Panel CPI Model
| Arellano-Bond test for AR (1) in first differences
z [Pr ˃ z] |
Arellano-Bond test for AR (2) in first differences
z [Pr ˃ z] |
Sargan test of overriding restrictions chi2
[Pr ˃ chi2] |
Hansen test of overriding restrictions chi2
[Pr ˃ chi2] |
| -1.67*
[0.095] |
-1.11
[0.267] |
4.26**
[0.039] |
0.00
[1.000] |
Note 1: (***), (**) and (*) indicates substantial at 1 percent, 5 percent and 10 percent level respectively. Note 3: The internal instruments employed are ngc and mgc.
Source: Computed Result (stata 16).
After estimating the Arellano-Bond dynamic model, the typical test for joint validity of the instruments is the Sargan/Hansen test. If the null hypothesis is disproved, the instrumental variable(s) are/are connected to some set of residuals, and as a result, they are invalid. The null hypothesis is that the instrument(s) as a whole are exogenous. The p-value upshot of the Sargan test indicates that the dynamic panel model rejects the null hypothesis of joint validity, as shown in table 8. The Hansen statistic-based overidentification test is conceptually better than the Sargan statistic since the Sargan statistic is not resilient to heteroskedasticity or autocorrelation (Roodman 2009). The Hansen test upshot shows that the joint validity null hypothesis is not rejected, indicating that instrument variables are jointly valid and can be employed to estimate the impact of consumption of natural gas and prices on the consumer price index utilising the Arellano-Bond dynamic estimation method.
FINDINGS
The study examined how natural consumption, price of natural gas and gasoline oil consumption affected the consumer price index or price level (inflation rate) in Africa’s oil-producing nations. In congruent with the study, although natural gas prices had an adverse but negligible influence on consumer price index or inflation, natural gas consumption had a positive and considerable impact on both while motor gasoline consumption had negative but significant effect on price level in the top-gas producing African countries. The result of this study refuted those of Bassey and Ekong (2019), who found that neither natural gas use nor pricing in Nigeria, an oil-producing nation, were inflationary. The discrepancy amid the two conclusions may be triggered by the fact that Bassey and Ekong (2019) utilised panel data for all of the major gas-producing African nations whereas this examination employed time series data for Nigeria. The results on the interaction amid natural gas use and inflation are consistent with Parker’s (2017) analysis of 223 nations, which found evidence of the interaction amid global inflation and domestic consumption of energy. Additionally, Josheski et al.’s (2014) conclusions did not agree with those of this examination since they discovered an inverse trend in the correlations amid energy use and inflation. Additionally, the result of this study on the effect of natural gas prices on inflation did not agree with those of Jalaee et al. (2021), who showed that the influence of natural gas prices on inflation was not very substantial. The negative and significant effect of motor gasoline consumption on price level is contrary to earlier study by Apergis (2011) who found gasoline energy consumption to be inflationary.
CONCLUDING REMARKS AND RECOMMENDATIONS
This study investigated the effects of natural gas consumption on price level in top gas producing countries in Africa namely; Algeria, Angola, Egypt, Gabon, Libya and Nigeria. Natural gas consumption was measured in terms of natural gas used/utilized in the countries domestic economy, price of natural gas and motor gasoline energy consumption of the countries while price level was captured in term of consumer price index (CPI) also of the countries of interest. The Panel Autoregressive and Distributed Lag (PARDL) was used to analyse data sourced after descriptive statistics and panel unit root tests. The results revealed that natural gas consumption had positive and substantial influence on consumer price index or inflation. Natural gas price had negative but insignificant effect on price level while motor gasoline energy consumption had negative and substantial effect on price level (consumer price index) in the top-gas producing African countries. The result also shows that a long run relationship existed between natural gas consumption and price level in the top-gas producing countries in Africa. Based on these results/findings, the study recommended policies that will enhance a stable natural price and domestic refining and consumption of motor gasoline energy in order to stabilize price level in Africa especially the gas producing countries.
REFERENCES
- Abdallah, C., & Kpodar, K. (2020). How large and persistent is the response of inflation to changes in retail energy prices? IMF Working Paper; International Monetary Fund: Washington, DC, USA, p. 31.
- Abubakar, M. A., Suraya, I., Farah, R., & Ali, U. A. (2022). The effect of electricity distribution loos, electricity power consumption, electricity intensity on energy consumption in West Africa. International Journal of Energy Economics and Policy, Econjournals, 12(5), 361-369.
- Adams, S., & Klobodu, E. K. M. (2017). Urbanization, democracy, bureaucratic quality, and environmental degradation. Journal of Policy Modeling, Elsevier, 39(6), 1035-1051.
- Álvarez, L. J., Hurtado, S., Sánchez, I., & Thomas, C. (2011) The impact of oil price changes on Spanish and euro area consumer price inflation. Econ. Model 28, 422–431.
- Apergis, N. (2011). Characteristics of inflation in Greece: Mean spillover effects among CPI components. In Hellenic Observatory Papers on Greece and Southeast Europe; GreeSE Paper No. 43; London School of Economics: London, UK, p. 12.
- Awodumi, B., & Adewuyi, A. O. (2020). The role of non-renewable energy consumption in economic growth and carbon emission: Evidence from oil producing economies in Africa. Energy Strategy Reviews, 1-19.
- Balitskiy, S., Bilan, Y., Strielkowski, W., & Štreimikienė, D. (2016). Energy efficiency and natural gas consumption in the context of economic development in the European Union. Renewable and Sustainable Energy Reviews, 55(C) 156-168.
- Bassey, G. E., & Ekong, U. M. (2019). Energy consumption and inflation dynamics in Nigeria: An ARDL cointegration approach. International Journal of Energy Economics and Policy, 6(2), 66-83.
- Beckmann, J., & Czudaj, R. (2017) Exchange rate expectations since the financial crisis: performance evaluation and the role of monetary policy and safe haven. J Int Money Financ 74: 283–300.
- Choi, S., Furceri, D., Loungani, P., Mishra, S., & Poplawski-Ribeiro, M. (2017). Oil prices and inflation dynamics: Evidence from advanced and developing economies. Journal Int. Money Finance, 82, 71–96.
- Dada, M. A. (2019). Energy consumption and economic growth dynamics in Nigeria (1981-2018), Journal of Energy and Development, 44(2), 190-207.
- De Gregorio, J., Landerretche, O., & Neilson, C. (2007). Another pass-through bites the dust? oil prices and inflation. Economic Journal, 7, 155–208.
- Destek, M. A., & Aslan, A. (2017). Renewable and non-renewable energy consumption and economic growth in emerging economies: Evidence from bootstrap panel causality. Renewable Energy, 757-763.
- Devore, S., & Olson, E. (2020) The surprising stability between gas prices and expected inflation. Economic Bullion Access Econ., 41, 710–719.
- Dihor, V., Alekseeva, A. & Lomtatidze, O. (2020) investigated association amongst economic development and (NG) natural gas-consumption in Malaysia. Applied Energy, 120: 95-103.
- Galadima, M. D., & Aminu, A. W. (2019). Nonlinear unit root and nonlinear causality in natural gas – economic growth nexus: Evidence from Nigeria. Energy, 1-27.
- Jalaee, M. S., GhasemiNejad, A., Jalaee, S. A., Amani, Zarin, N., & Derakhshani, R. A. (2022) Novel hybrid artificial intelligence approach to the future of global coal consumption using whale optimization algorithm and adaptive neuro-fuzzy inference system. Energies,15, 2578.
- Josheski, D., Magdinceva-Sopova, M., & Z. Sovreski, J. (2014). Energy consumption, economic development and prices: Time series evidence in CESEE countries. Available from http://eprints.ugd.edu.mk/9704/1/SSRN-id2420112.pdf.
- Li, J., She, Y., Gao, Y., Li, M., Yang, G., & Shi, Y. (2020). Natural gas industry in China: Development situation and prospect. Natural Gas Industry B, 7(6), 604-613.
- Maji, I. K., Chindo, S., & Abdul-Rahim, A. S. (2019). renewable energy consumption and economic growth nexus: A Fresh Evidence from West Energy Reports, 384-392.
- Mastorakis, N., & Yazdi, S. (2014). Natural gas consumption and economic growth in Iran. In Advances in Environmental Technology and Biotechnology 9(3), 1656-1672.
- Mosikari, T. J., & Eita, J. H. (2020). CO2emissions, urban population, energy consumption and economic growth in selected African countries: A Panel Smooth Transition Regression (PSTR). OPEC Energy Review, pp. 319-333.
- Okwanya, I., & Abah, P. O. (2018), Impact of energy consumption on poverty reduction in Africa. CBN Journal of Applied Statistics, 9(1), 105-139.
- Olabanji, B. A., & Adeolu, O. A. (2020). The role of non-renewable energy consumption in economic growth and carbon emission: Evidence from oil producing economies in Africa. Energy Strategy Reviews, 27, 100434.
- Ozturk, , & Al-Mulali, U. (2015). Natural gas consumption and economic growth nexus: Panel Data Analysis for GCC Countries. Renewable and Sustainable Energy Reviews, 998-1003.
- Parker, M. (2017). Global inflation: The role of food, housing and energy prices. European Central Bank, Working Paper Series, No. 2024.
- Pedroni, P. (1999). Critical values for cointegration tests in heterogenous panels with multiple regressors. Oxford Bulletin of Economics and Statistics, 653-670.
- Pedroni, P. (2000) Fully modified OLS for heterogeneous cointegrated panels. Advances in Econometrics; 15: 93-130.
- Pesaran, M. H. (2004). General diagnostic tests for cross section dependence in panels. Working Paper 0435.
- Reuben, U. N. (2016). Empirical analysis of determinants of natural gas flaring in Nigeria. M.Sc Dissertation.
- Roodman, D. (2009). How to do xtabond2: An introduction to difference and system GMM in Stata. The Stata Journal, 9(1I, 86–136.
- Solarin, S. A., & Ozturk, I. (2016). The relationship between natural gas consumption and economic growth in OPEC Renewable and Sustainable Energy Reviews, 1348- 1356.
- Stern, D. I. (2004). Economic Growth and Energy. Encyclopedia of Energy, 2, 1-17.
- Stern, D. I., & Cleveland, C. J. (2004). Energy and economic growth, Rensselaer Polytechnic Institute. Working Papers in Economics.
- Sussman, N., & Osnat, Z. (2015). Oil prices, inflation expectations and monetary policy Bank of Israel: Jerusalem, Israel.
- Tariq, G., Sun, H., Haris, M., Javaid, H. M., & Kong, Y. (2018). Energy consumption and economic growth: evidence from four developing countries. American Journal of Multidisciplinary Research, 1-9.
- Zhi-Guo, , Cheng, H., & Dong-Ming, W. (2018). Empirical research on the relationship between natural gas consumption and economic growth in the Northeast Asia. Energy and Environment, 216 – 231.