
Some Factors Affecting Agricultural Land Use Management in Lang Son Province, Vietnam
- Tran Quang Trung
- Do Thi Duc Hanh
- 457-470
- May 16, 2024
- Agriculture
Some Factors Affecting Agricultural Land Use Management in Lang Son Province, Vietnam
Tran Quang Trung1*, Do Thi Duc Hanh2
1*Ph.D. Student of Faculty of Natural Resources and Environment, Vietnam National University of Agriculture
2Faculty of Natural Resources and Environment, Vietnam National University of Agriculture
*Corresponding Author
DOI: https://dx.doi.org/10.47772/IJRISS.2024.803031S
Received: 04 April 2024; Accepted: 12 April 2024; Published: 16 May 2024
ABSTRACT
The study aims to identify some factors affecting agricultural land use management and propose solutions to improve it in Lang Son province. Secondary data were collected from agencies related to agricultural land use management. Primary data were collected through a direct survey of 250 officials and civil servants implementing agricultural land use management and through 2 steps. Step 1 identifies factors that may influence agricultural land use management. Step 2 collects opinions on the level of influence of the factors identified in Step 1. The hypothetical model of factors affecting land use management has 10 independent variables and 01 dependent variable, and they were evaluated through the testing criteria using SPSS20.0 software. Agricultural land use management is influenced by 28 factors belonging to 10 factor groups, with impact rates ranging from 3.65% to 23.57%. The group of factors of inspection, examination, and sanctioning of land related administrative violations has the most impact, and the group of factors of infrastructure conditions has the least impact on land use management. Proposed solutions include strengthening inspection, examination, and strict penalties for land violations; Completing and properly resolving complaints, denunciations, and land disputes; improving human resources; Organizing and implementing well land use management, etc.
Keywords: Affecting Factors, Agricultural Land, Land use, Lang Son, Land Use Management
INTRODUCTION
Agricultural land is land used for production, research, and experimentation in agriculture, forestry, aquaculture, salt production, and forest protection and development purposes [8]. Agricultural land is allocated, leased, or recognized by the State to land users. Agricultural land is a special, irreplaceable means of production for the agriculture and forestry industry. Therefore, agricultural land use management is an issue of special concern to the Party and State in Vietnam. Land use management in general, and agricultural land use management in particular, is a collection of tasks to ensure that land is used for the purpose assigned, leased, recognized, or in general according to land use planning and plans that have been approved by the competent authority. The main tasks that need to be done related to land use management include organizing and implementing land use management; inspecting, examining, supervising, and sanctioning administrative violations related to land; Resolving complaints, lawsuits, denunciations, land disputes, etc. These tasks are performed by state agencies at all levels according to the functions and powers prescribed by law. In addition, other individuals and organizations also participate in land use management such as monitoring the compliance with the law of subjects assigned land use rights or of state agencies or relevant officials and civil servants. Good land use management will limit violations of land law such as encroachment and land appropriation; change of land use purpose, illegal transfer of land use rights; destroying the land; leaving land fallow, etc. This contributes to minimizing insecurity, social order, and environmental degradation in localities [10], [11], [17].
In Lang Son province, Vietnam, agricultural land use management in particular and land use management in general has received special attention from the Provincial Party Committee and People’s Committee of Lang Son province because the province has a large agricultural land area (720,431 hectares, accounting for 86.69% of the total natural area) and with an international border of 231 km long [5]. Land use management still faces many difficulties due to the impact of many different factors such as terrain, climate, dispersion of agricultural land, customs and practices of ethnic groups, as well as the level of understanding and compliance of land use people, etc. According to reports of People’s Committees of districts and cities, in the period from 2016 to 2022, there were 4,012 disputes and 2,582 cases of sanctioning related administrative violations to agricultural land. In addition, there were also 208 cases of complaints, lawsuits, and denunciations related to compensation for agricultural land when the State recovered land [2]. However, until now, there has been no research that comprehensively evaluates the factors affecting agricultural land use management in the province. Therefore, research to answer the question: What factors are affected by land use management? What is the level of impact of those factors? What solutions are needed to improve land use management to contribute to socio-economic development and ensure security and defense in Lang Son province?
The study focuses on evaluating several factors affecting assigned, leased, and recognized land use management for households and individuals in 11 districts and cities in Lang Son province in the period from 2016 to 2022.
RESEARCH METHODS
Collect Data and Build Hypothetical Models
Data on natural conditions, socio-economic conditions, and land use management are collected from reports of 11 district and city People’s Committees on land use management. Secondary data are also collected from reports and research works related to land use management that have been evaluated and publicly announced. Primary data are collected through a two-step survey using pre-printed questionnaires for 250 people related to land use management (01 leader and 05 experts from the Department of Natural Resources and Environment; 200 cadastral officers in communes, wards, and towns; 22 civil servants from 11 departments of natural resources and environment and 22 civil servants from 11 departments of agriculture and rural development, each investigation department has 01 leader, 01 expert).
A survey in Step 1 aims to get the personal opinions of survey respondents about factors that might affect land use management. The content of the survey includes basic information about the respondents and 25 hypothetical factors affecting land use management, which have been pointed out by previous studies, including direction for implementing land use management at all levels; propagating and disseminating land law; coordination between authorities; cadastral records; working equipment; resolve disputes, complaints, lawsuits, and denunciations; administrative procedures; management human resources; natural condition; land users, etc [9], [11], [12], [14], [17]. Each hypothetical factor has two corresponding options (affects, does not affect land use management) for respondents to choose one of the two. In addition to the assumed factors, survey respondents are asked to add other factors (if any). The survey questionnaire also has a group of dependent factors showing the effectiveness of land use management assessed through 04 factors (criteria), including minimizing land law violations; insecurity and social order; and reducing fallow land area; minimizing environmental degradation. These factors also have two corresponding options (minimize, do not minimize) for respondents to choose one of the two.
The results of processing survey data in Step 1 show that there are a total of 42 proposed factors with the rating rate ranging from 45.60% to 89.20% of the total number of respondents. There are 17 factors added by respondents, including customs, practices, cultural level, and income sources of land users; coordination between authorities; the appropriate level and progress of implementing land use planning; a sense of responsibility for public service, etc. All 42 factors are considered observed variables and are classified according to the characteristics of the factor into 10 hypothetical factor groups. Each group of factors is considered an independent variable, or latent variable, and has from 3 to 7 observed variables (Table 1). The dependent variable (Y) is land use management assessed through 04 criteria as shown in Table 1. The model of hypothetical factors affecting land use management in Lang Son province is shown in Figure 1. Regression equation regulations are presented in Formula 1.
Table 1. Hypothesized groups of factors affecting agricultural land use management and dependent variable
| Factor groups | Code | Factor groups | Code |
| I. Human resources for land management | NL | Year Old | NS4 |
| Quantity | NL1 | Sex | NS5 |
| Qualification | NL2 | Customs and practices | NS6 |
| Professional capacity | NL3 | The main source of income | NS7 |
| Capacity to organize and carry out work | NL4 | VII. Infrastructure conditions | HT |
| Sense of responsibility towards public duties | NL5 | Traffic system | HT1 |
| II. Legal policy | CS | Communication systems | HT2 |
| Administrative procedures regarding land | CS1 | Irrigation system | HT3 |
| The time limit for resolving land cases | CS2 | VIII. Natural conditions | TN |
| Determining authority to resolve cases | CS3 | Topographic | TN1 |
| III. Administrative violations related to land | VP | Weather | TN2 |
| Number of administrative violation cases | VP1 | Soil quality | TN3 |
| Complexity of the case | VP2 | Degree of dispersion of agricultural land | TN4 |
| Subjects of administrative violations | VP3 | IX. Organizing land use management | TC |
| Type of administrative violation | VP4 | Direct implementation at all levels | TC1 |
| IV. Land disputes, complaints, lawsuits, and denunciations | TK | Propagate and disseminate land law | TC2 |
| Number of dispute cases | TK1 | Coordination between authorities | TC3 |
| Number of complaint cases | TK2 | Comply with the laws of the authorities | TC4 |
| Number of lawsuit cases | TK3 | X. Means of service for land use management | PT |
| Number of denunciation cases | TK4 | Cadastral records | PT1 |
| V. Land use planning | QH | Means for storage and lookup | PT2 |
| Publicize planning and adjust planning | QH1 | Working equipment | PT3 |
| Timeliness of planning and planning adjustments | QH2 | Funding for management services | PT4 |
| Relevance level of planning | QH3 | Dependent variable (Effectiveness of land use management) | Y |
| Progress of planning implementation | QH4 | Minimize violations of land law | Y1 |
| VI. Land users | NS | Minimize social insecurity and order | Y2 |
| Educational level | NS1 | Minimize fallow land area | Y3 |
| Understanding land law | NS2 | Minimize environmental degradation | Y4 |
| Awareness of compliance with land laws | NS3 | ||
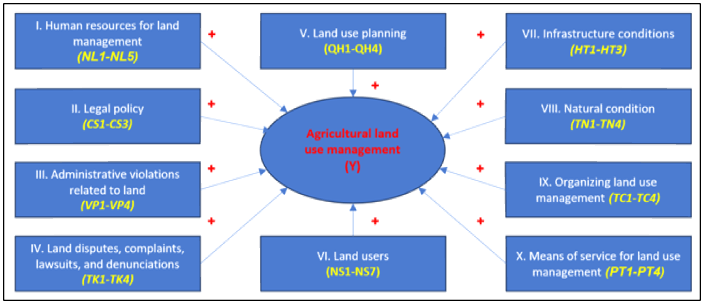
Figure 1. The model assumes factors affecting agricultural land use management
Y = βo + β1*NL + β2*CS + β3*VP + β4*TK + β5*QH + β6*NS + β7*HT + β8*TN + β9*TC + β10*PT + Ɛ (1)
Where: Y – Dependent variable showing the effectiveness of land use management; β is a constant; β1; β2; β3; β4; β5; β6; β7; β8; β9; β10 – Corresponding coefficients of independent variables (latent variables), including Management human resources; Legal policy; Administrative violations related to land; Land disputes, complaints, lawsuits and denunciations; Land use planning; Land users; Infrastructure conditions; Natural condition; Organize land use management; Means serving land use management; NL; CS; VP; TK; QH; NS; HT; TN; TC; PT – The corresponding independent variables are Management Human Resources; Legal policy; Administrative violations related to land; Land disputes, complaints, lawsuits and denunciations; Land use planning; Land users; Infrastructure conditions; Natural condition; Organize land use management; Means serving land use management; Ɛ – Influence value of unknown factors.
Step 2 survey aims to get survey respondents’ opinions on the level of influence of each observed variable, identified in Step 1, on land use management. The content of the survey includes basic information about survey respondents, 10 groups of hypothetical impact factors, and groups of dependent factors. Each observed variable has 5 levels of evaluation with corresponding points (Very influential – 5 points; Quite influential – 4 points; Moderately influential – 3 points; Little influential – 2 points; Very little influential – 1 point) [7] for respondents to choose one of five levels. For the dependent variable, the rating level for each observed variable also follows 5 levels (Very minimizing – 5 points; Fairly minimizing – 4 points; Moderately minimizing – 3 points; Slightly minimizing – 2 points; Very little minimizing – 1 point).
The survey sample size in Step 2 is determined based on the minimum sample size for exploratory factor analysis (EFA) and multivariate regression. According to Hair et al. (1998) [3], to ensure good exploratory factor analysis, at least 5 observations are needed for 1 measured variable (observed variable) and the number of observations should not be less than 100. According to Table 11, there are a total of 46 observed variables (questions using the Likert scale). Therefore, the minimum sample size is 5×46 = 230 observations. The minimum sample size for regression analysis according to Tabachnick & Fidell (1996) [16] is 50 + 8xp (p is the number of independent variables). According to the assumed model, there are 10 independent variables, so the minimum sample size is 50 + 8×10 = 130 observations. Thus, to ensure the minimum sample size for both exploratory factor analysis and regression analysis, the minimum sample size is 230. To increase the reliability of the research results, Step 2 further investigates all 250 people who have responded to the survey in Step 1.
Collect, Process, Analyze, and Compare Data
Secondary and primary data are compiled and processed using Microsoft Office Excel 2016 software. The hypothetical model is tested using SPSS20.0 software. The reliability of the scale is tested by Cronbach’s alpha coefficients and total correlation coefficients (Corrected Item – Total Correlation). According to Hair et al. (1998) [3], the data ensures reliability when Cronbach’s Alpha coefficient ranges from 0.60 to 0.95 and the total variable correlation coefficient must be greater than 0.30 [3], [13]. The study uses exploratory factor analysis (EFA) to reduce a set of many interdependent measurement variables into a smaller set of variables (called factors) so that they have meaning. more meaningful. Exploratory factor analysis was performed through the appropriate coefficient KMO (Kaiser – Meyer – Olkin). Variables are accepted when the appropriate coefficient KMO has a value between 0.50 and 1.00 (0.50≤KMO≤1.00) and its loading weights on other factors are less than 0. 35 [4] or the distance between 2 Factor Loading weights of the same variable on 2 different factors is greater than 0.30. According to Hair et al. (1998) [3], with a sample size of about 200, a weight loading greater than 0.40 should be chosen. The research model has a sample size of 250, so the loading weight chosen is 0.40. At the same time, the scale is accepted when the total variance explained is greater than 50% and Barlett’s coefficient with a significance level of Si.g is less than 0.05 to ensure that the factors are correlated with each other. The Eigenvalue coefficient must also have a minimum value of 1.00 to ensure that the groups of factors are different.
Regression analysis is performed according to the adjusted R2 value and the Durbin-Watson coefficient with values ranging from 1.5 to 2.5 so that no serial correlation occurs. In addition, the Sig F-test must also be less than 0.05 and the Sig t-test of the regression coefficients of the independent variables must all be less than 0.05. At the same time, the variance inflation factor (VIF) must be less than 2 so that no multicollinearity occurs [15]. Data processing results are compared with testing criteria to consider the suitability of each observed variable to the requirements. Variables that do not meet the requirements will be eliminated and the test will be repeated until all requirements are satisfied.
Determine the Average Influence Level of Groups of Factors
The level of influence of the independent variable is divided into 5 levels according to the Likert scale (Very influential, Quite influential, Moderately influential, Little influential, Very little influential with the rating score of the corresponding variable: greater than 4.20; from 3.40 to 4.19; from 2.60 to 3.39; from 1.80 to 2.59; less than 1.80) [7]. The rating score of the independent variable is the average rating score of the factors in the group.
RESULTS AND DISCUSSION
Identifying Factors Affecting Agricultural Land Use Management
Test the reliability of the scale and perform exploratory factor analysis: The first test results in Table 2 show that the Cronbach’s alpha coefficients of all 10 latent variables are large at 0.60, but there are 4 observed variables with a total variable correlation of less than 0.30, including the variable educational level, age, gender, and weather, so these variables were removed from the model and tested a second time. According to the second test results in Table 3, Cronbach’s alpha coefficients are all greater than 0.60 and the total correlation values of observed variables are also greater than 0.30, so the scale is reliable, and suitable for further analysis.
Table 2. Results of the first scale reliability analysis
| Factor groups and Cronbach’s Alpha | Total variable correlation | Factor groups and Cronbach’s Alpha | Total variable correlation |
| I. Human resources for land management (Cronbach’s Alpha = 0.753) | Awareness of compliance with land laws (NS3) | 0.714 | |
| Quantity (NL1) | 0.673 | Age (NS4) | 0.069 |
| Professional qualifications (NL2) | 0.791 | Gender (NS5) | 0.033 |
| Professional capacity (NL3) | 0.635 | Customs and practices (NS6) | 0.680 |
| Capacity to organize and perform work (NL4) | 0.722 | Main source of income (NS7) | 0.711 |
| II. Legal policy (Cronbach’ Alpha = 0.892) | VII. Infrastructure conditions (Cronbach’ Alpha = 0.821) | ||
| Administrative procedures on land (CS1) | 0.759 | Transportation system (HT1) | 0.664 |
| The time limit for resolving land cases (CS2) | 0.703 | Communication system (HT2) | 0.742 |
| Determining authority to resolve cases (CS3) | 0.782 | Irrigation and drainage system (HT3) | 0.672 |
| III. Administrative violations related to land (Cronbach’s Alpha = 0.762) | VIII. Natural conditions (Cronbach’ Alpha = 0.703) | ||
| Number of administrative violation cases (VP1) | 0.677 | Terrain (TN1) | 0.644 |
| Complexity of the case (VP2) | 0.716 | Weather (TN2) | 0.107 |
| Subjects of administrative violations (VP3) | 0.680 | Soil quality (TN3) | 0.681 |
| Type of administrative violation(VP4) | 0.753 | Degree of dispersion of agricultural land (TN4) | 0.643 |
| IV. Land disputes, complaints, lawsuits, and denunciations (Cronbach’s Alpha = 0.815) | IX. Organizing land use management (Cronbach’ Alpha = 0.881) | ||
| Number of dispute cases (TK1) | 0.882 | Directing implementation at all levels (TC1) | 0.690 |
| Number of complaint cases (TK2) | 0.703 | Propagating and disseminating land law (TC2) | 0.747 |
| Number of lawsuit cases (TK3) | 0.661 | Coordination between authorities (TC3) | 0.802 |
| Number of denunciation cases (TK4) | 0.780 | Comply with the laws of the authorities (TC4) | 0.755 |
| V. Land use planning (Cronbach’ Alpha = 0.803) | X. Tools serving land use management (Cronbach’ Alpha = 0.746) | ||
| Publicizing planning and adjusting planning (QH) | 0.668 | Cadastral records (PT1) | 0.673 |
| Timeliness of planning and planning adjustments (QH1) | 0.752 | Means for storage and lookup (PT2) | 0.705 |
| Relevance level of planning (QH2) | 0.724 | Working equipment (PT3) | 0.672 |
| Progress of planning implementation (QH3) | 0.675 | Funding for management services (PT4) | 0.783 |
| Publicizing planning and adjusting planning (QH) | 0.668 | Dependent variable (Cronbach’s Alpha = 0.705) | |
| VI. Land users (Cronbach’ Alpha = 0.794) | Minimize land law violations (Y1) | 0.782 | |
| Educational level (NS1) | 0.172 | Minimize insecurity and social order (Y2) | 0.693 |
| Understanding land law (NS2) | 0.630 | Minimize fallow land area (Y3) | 0.811 |
| Minimize environmental degradation (Y4) | 0.762 | ||
Table 3. Results of the second scale reliability analysis
| Factor groups and Cronbach’s Alpha | Total variable correlation | Factor groups and Cronbach’s Alpha | Total variable correlation |
| I. Human resources for land management (Cronbach’s Alpha = 0.753) | VIII. Natural condition (Cronbach’s Alpha = 0.705) | ||
| Understanding land law (NS2) | 0.637 | Terrain (TN1) | 0.724 |
| Awareness of compliance with land laws (NS3) | 0.714 | Soil quality (TN3) | 0.681 |
| Customs and practices (NS6) | 0.680 | Degree of dispersion of agricultural land (TN4) | 0.643 |
| Main source of income (NS7) | 0.749 | ||
According to Table 4, the KMO coefficient is equal to 0.857 and lies within the range from 0.5 to 1.0, so the data is suitable for EFA analysis. In addition, Sig Bartlett’s Test = 0, so the observed variables are correlated with each other within the same factor. The observed variables also all have loading factors greater than 0.6 (Table 5), so they correlate well with the latent variables. Besides, the Pearson correlation Sig of 10 independent variables with the dependent variable Y is less than 0.05, proving that there is a relationship between the independent variable and the dependent variable, in which the GQ variable has a high correlation. The QH variable has the smallest correlation (Table 6). This is a sufficient condition to perform further regression analysis.
Table 4. Results of KMO and Bartlett’s Test
| Kaiser-Meyer-Olkin Measure of Sampling Adequacy | 0.857 | |
| Bartlett’s Test of Sphericity | Approx. Chi-Square | 1654.023 |
| df | 259 | |
| Sig Bartlett’s Test | 0.000 | |
Table 5. Rotation matrix weights
| Observed variables
(Code) |
Factor groups | Observed variables
(Code) |
Factor groups | |||||||||
| 1 | 2 | 3 | 4 | 5 | 5 | 6 | 7 | 8 | 9 | 10 | ||
| NL1 | 0.772 | QH4 | 0.716 | |||||||||
| NL5 | 0.693 | NS3 | 0.738 | |||||||||
| NL2 | 0.652 | NS6 | 0.704 | |||||||||
| NL4 | 0.629 | NS2 | 0.671 | |||||||||
| NL3 | 0.618 | NS7 | 0.639 | |||||||||
| CS2 | 0.791 | HT3 | 0.821 | |||||||||
| CS1 | 0.764 | HT2 | 0.766 | |||||||||
| CS3 | 0.705 | HT1 | 0.753 | |||||||||
| VP1 | 0.847 | TN1 | 0.794 | |||||||||
| VP2 | 0.793 | TN3 | 0.743 | |||||||||
| VP4 | 0.788 | TN4 | 0.670 | |||||||||
| VP3 | 0.753 | TC1 | 0.766 | |||||||||
| TK3 | 0.711 | TC4 | 0.753 | |||||||||
| TK1 | 0.692 | TC2 | 0.695 | |||||||||
| TK4 | 0.674 | TC3 | 0.688 | |||||||||
| TK2 | 0.650 | PT1 | 0.833 | |||||||||
| QH2 | 0.805 | PT4 | 0.712 | |||||||||
| QH3 | 0.763 | PT3 | 0.697 | |||||||||
| QH1 | 0.740 | PT2 | 0.661 | |||||||||
Table 6. Correlation between dependent variable and independent variables
| Dependent variable (Y) | NL | CS | VP | TK | QH | NS | HT | TN | TC | PT | ||
| Dependent variable (Y) | Pearson Correlation | 1 | 0.603** | 0.213** | 0.605** | 0.782** | 0.140* | 0.638** | 0.281** | 0.215* | 0.542** | 0.493** |
| Sig. (2-tailed) | <0.001 | <0.001 | <0.001 | <0.001 | 0.037 | <0.001 | <0.001 | 0,024 | <0.001 | 0.001 | ||
| N | 250 | 250 | 250 | 250 | 250 | 250 | 250 | 250 | 250 | 250 | 250 | |
| **. Correlation is significant at the 0,01 level (2-tailed). | ||||||||||||
| *. Correlation is significant at the 0,05 level (2-tailed). | ||||||||||||
Analyzing Regression and Determining the Influence of Independent Variables
In Table 7, the adjusted R2 value is 0.874, meaning that the independent variables account for 87.4% of the impact on the results of land use management, and the remaining 12.6% is due to the influence of unidentified variables. and due to random error. The Durbin-Watson coefficient is equal to 1.849 and is within the limit from 1.5 to 2.5, so the phenomenon of serial correlation does not occur. Besides, Sig’s F test is equal to 0.001 (less than 0.05), so the data can also be used. The sig t-test regression coefficient of 10 independent variables is also less than 0.05, proving that the independent variables have meaning in explaining the dependent variable. Multicollinearity also does not occur because the VIF coefficients are all less than 2. According to Figure 2, the average value (Mean = -6.65E-15) is close to 0, the standard deviation is 0.990, close to 1. At the same time, the percentile points in the distribution of the residuals cluster into a diagonal line (Figure 3). Therefore, the assumption of normal distribution of residuals is not violated. Besides, the standardized residuals are randomly distributed around the 0-intercept line, forming straight lines, so the assumption of a linear relationship between the dependent variable and the independent variables is not violated (Figure 4). Thus, it can be affirmed that agricultural land use management is influenced by 10 groups of factors (independent variables). The impact ratio of each variable ranges from 3.65% to 23.57% (Table 7). The standardized regression equation of factors affecting agricultural land use management is as formula 2.
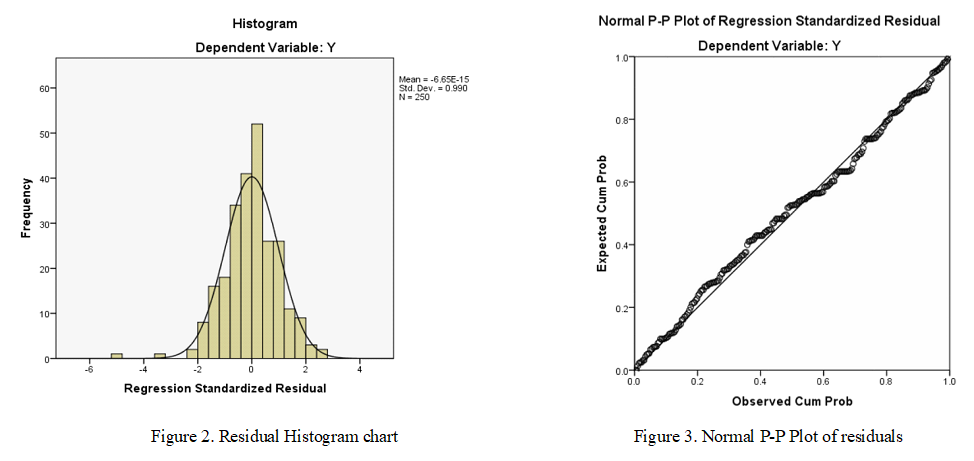
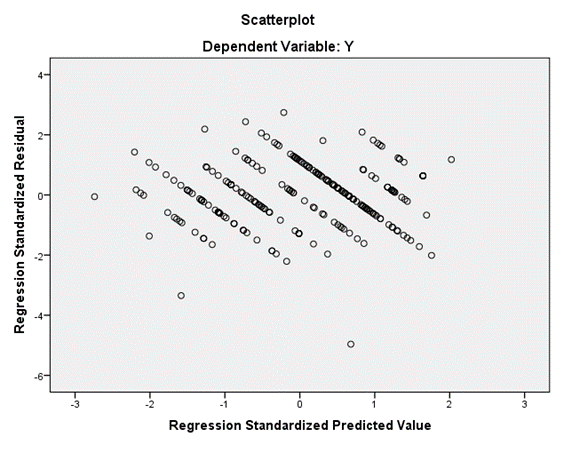
Figure 4. Scatterplot
Table 7. Results of linear regression analysis
| Constants and independent variables | Regression coefficients are not standardized | Standardized regression coefficients | t | Multicollinearity statistics | Order of influence | Impact rate (%) | ||
| B | Standard error | Error (Sig.) | VIF | |||||
| Beta | ||||||||
| βo | – 0.207 | 0.114 | ||||||
| NL | 0.267 | 0.029 | 0.291 | 5.892 | 0.001 | 1.902 | 3 | 10.83 |
| CS | 0.139 | 0.024 | 0.160 | 4.749 | <0.001 | 1.823 | 8 | 5.96 |
| VP | -0.126 | 0.013 | -0.633 | 2.631 | 0.003 | 1.780 | 1 | 23.57 |
| TK | -0.246 | 0.017 | -0.552 | 4.970 | <0.001 | 1.901 | 2 | 20.56 |
| QH | 0.064 | 0.021 | 0.164 | 3.753 | <0.001 | 1.704 | 7 | 6.09 |
| NS | 0.021 | 0.018 | 0.221 | 4.613 | 0.002 | 1.603 | 5 | 8.22 |
| HT | 0.033 | 0.020 | 0.098 | 3.546 | <0.001 | 1.995 | 10 | 3.65 |
| TN | 0.062 | 0.015 | 0.111 | 4.097 | 0.001 | 1.802 | 9 | 4.13 |
| TC | 0.135 | 0.023 | 0.247 | 1.769 | 0.002 | 1.757 | 4 | 9.21 |
| PT | 0.117 | 0.026 | 0.209 | 3.402 | <0.001 | 1.818 | 6 | 7.78 |
| R2 = 0.891; Corrected R2 = 0.874. | Durbin-Watson = 1.849 | |||||||
| ANOVA: F = 123.874; Sig. F = 0.001. | ||||||||
Y = 0.291*NL + 0.160*CS – 0.633*VP – 0.552*TK + 0.164*QH + 0.221*NS + 0.098*HT + 0.111*TN + 0.247*TC + 0.209*PT (2)
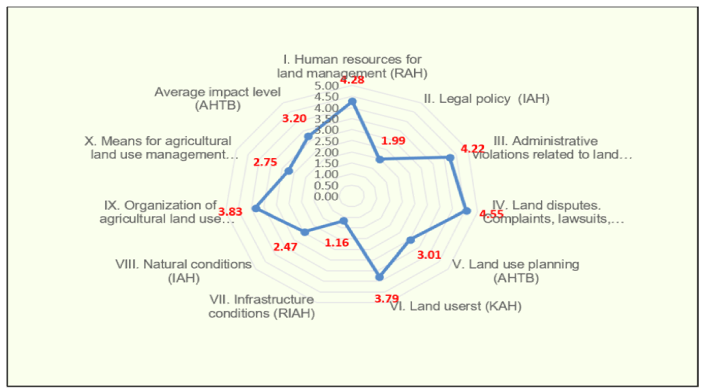
According to Table 8, the group of factors for resolving disputes, complaints, lawsuits, and denunciations of land has the highest rating (4.55) and greatly affects land use management. This group of influencing factors has been discussed by Nguyen Tien Sy (2017) [11]; and Tran Thai Yen (2020) [17] pointed out in previous studies. The second influential group, land management human resources, is also very influential due to its rating of 4.28 (Figure 5). Among them, the sense of responsibility for public service has the most influence with the highest score (4.36) and has not been seen in the research results of Nguyen Tuan Hung (2019) [12]; Pham Thanh Que (2020) [14]; Tran Thai Yen (2020) [17]. The group of factors of inspection, examination, and sanctioning of administrative violations has the third highest rating score (4.22) and also greatly affects land use management, in which land use supervision has the highest score in the group (4.22). Thus, monitoring plays an important role in ensuring that agricultural land is used properly. These factors were also identified by Nam et al. (2021) [9] who pointed out. The group of factors of organization of land use management has the fourth highest influence score (3.83, quite influential), while, the factor of propaganda and dissemination of laws so that land users can grasp the legal regulations has the highest score (4.05), followed by guidance on law implementation. In particular, the coordination factor of the authorities also affects land use management and is a factor not seen in previous studies. The group of land user factors with an evaluation score of 3.79 occupies the fifth most influential position (quite influential – level II). Customs, practices, and awareness of law observance of land users have the highest score (3.89) because, in the research area, there are many ethnic minorities with different customs and practices in solving problems. land dispute. These factors are also influencing factors according to Pham Thanh Que (2020) [14].
The land use planning factor is the group with the sixth level of influence with a score of 3.01, corresponding to level III (medium influence), in which, the timeliness of planning and planning adjustment has a score of 3.01. It is also an influencing factor according to Tran Thai Yen (2022) [17]. The factor group of facilities serving land use management has the seventh level of impact with a score of 2.75 (level III, average impact). In this group, funding for land use management has the most impact with a score of 2.82 because currently, finance for this work is limited and does not meet practical requirements, especially for dispute resolution, complaints, and land lawsuits. Like the research of Pham Thanh Que (2020) [14], the group of natural conditions also affects agricultural land use management with a score of 2.47 (level IV). The difference in the influence of soil quality, terrain, and agricultural land dispersion is not large (corresponding scores 2.65; 2.46; 2.30). Next, the group of policy and legal factors has a smaller level of influence (score 1.99 – little influential) because the research object is agricultural land that has been allocated, leased, and recognized for households, individuals should have fairly complete and detailed legal regulations. Different from the study of Nam et al. (2021) [9], but similar to the research of Pham Thanh Que (2020) [14], the group of infrastructure conditions also affects land use management but with the smallest level of influence with a score of 1.16 (very little influential). The communication factor has the smallest influence (score 1.12).
Table 8. Scores for assessing the influence of groups of factors
| Factor groups | Scores | Factor groups | Scores |
| I. Human resources for land management | 4.28 | Progress of planning implementation | 3.06 |
| Quantity | 4.19 | VI. Land users | 3.79 |
| Qualification | 4.24 | Understanding land law | 3.89 |
| Professional capacity | 4.32 | Awareness of compliance with land laws | 3.74 |
| Capacity to organize and carry out work | 4.28 | Customs and practices | 3.89 |
| Sense of responsibility towards public duties | 4.36 | The main source of income | 3.62 |
| II. Legal policy | 1.99 | VII. Infrastructure conditions | 1.16 |
| Administrative procedures regarding land | 1.86 | Traffic system | 1.15 |
| The time limit for resolving land cases | 2.19 | Communication systems | 1.12 |
| Determining authority to resolve cases | 1.94 | Irrigation system | 1.20 |
| III. Administrative violations related to land | 4.22 | VIII. Natural conditions | 2.47 |
| Number of administrative violation cases | 4.00 | Topographic | 2.46 |
| Complexity of the case | 4.12 | Soil quality | 2.65 |
| Subjects of administrative violations | 4.48 | Degree of dispersion of agricultural land | 2.30 |
| Type of administrative violation | 4.27 | IX. Organization of agricultural land use management | 3.83 |
| IV. Land disputes. Complaints, lawsuits, and denunciations | 4.55 | Direct implementation at all levels | 3.95 |
| Number of dispute cases | 4.43 | Propagate and disseminate land law | 4.05 |
| Number of complaint cases | 4.56 | Coordination between authorities | 3.68 |
| Number of lawsuit cases | 4.59 | Comply with the laws of the authorities | 3.61 |
| Number of denunciation cases | 4.62 | X. Means for agricultural land use management | 2.75 |
| V. Land use planning | 3.01 | Cadastral records | 2.79 |
| Publicize planning and adjust planning | 2.89 | Means for storage and lookup | 2.66 |
| Timeliness of planning and planning adjustments | 3.32 | Working equipment | 2.74 |
| Relevance level of planning | 2.78 | Funding for management services | 2.82 |
Notes: RAH – Very influential; IAH – Little influential; AHTB – Medium influential; KAH – Quite influential; RIAH – Very little influential
Figure 5. The level of influence of groups of factors on agricultural land use management
Solutions to Improve Agricultural Land Use Management
For land use management in Lang Son province to be more complete, it is necessary to first pay attention to groups of factors with high influence, followed by groups of factors with less influence. Specifically, it is necessary to properly resolve disputes, complaints, lawsuits, and denunciations regarding land; next, strengthen inspection, examination, and strict penalties for land law violations such as land encroachment and appropriation; change of land use purpose or illegal transfer of agricultural land. At the same time, it is necessary to ensure human resources to implement land use management and well-organized land use management, especially propagating and disseminating land laws so that land users can fully grasp the legal regulations, especially for ethnic minorities. clan. In addition, it is also necessary to strengthen coordination between agencies and units in the process of land use management and upgrade the storage and working facilities of land management agencies. To limit the situation of leaving land fallow, it is also necessary to ensure irrigation and transportation conditions to scattered land plots that are difficult to access. Land use planning also needs to be completed as a basis for resolving issues related to land use such as changing land use purposes, transferring or donating land use rights, or resolving disputes. land, etc. Regulations on procedures, time limits, and decentralization of resolution also need to be considered and simplified so that land use management can be carried out smoothly, minimizing violations of land law.
CONCLUSION
Agricultural land use management in Lang Son province is influenced by 38 factors belonging to 10 factor groups. The influence rate of different groups of factors ranges from 3.65% to 23.57%. The group of factors of inspection, examination, and sanctioning of land-related administrative violations has the highest rate of influence; The group of infrastructure conditions has the smallest influence. The level of influence of factor groups is also different with an average rating from 1.16 to 4.55. The group of factors of inspection, examination, and sanctioning of land-related administrative violations greatly affects the management and use of agricultural land, followed by the following groups of factors: Human resources for land management; Inspect, examine and sanction administrative violations related to land; Organizing agricultural land use management, etc. To improve agricultural land use management, it is necessary to prioritize implementing solutions related to groups of factors that greatly affect agricultural land use management first, and then implement solutions related to agricultural land use. Weak groups have less influence. Research has not yet made an in-depth assessment of the advantages, limitations, and causes for specific contents of land use management, so this issue needs to be studied further to propose more specific and detailed solutions to improve land use management.
REFERENCES
- Congress (2012). Law on Handling of Administrative Violations.
- Department of Natural Resources and Environment of Lang Son province (2023). Summary report on agricultural land use management in Lang Son province for the period 2018-2022.
- Hair Jr. J. F. Anderson R. E. Tatham R. L. & Black W. C. (1998). Multivariate Data Analysis (5th ed.). New York: Macmillan Publishing Company.
- Igbaria, M., Livari, J. & Maragahh, H. (1995). Why do individuals use computer technology? A finished case study.
- Lang Son Provincial People’s Committee (2022a). Report on Land Statistics Results of Lang Son Province in 2022.
- Lang Son Provincial People’s Committee (2022b). Report on land management in Lang Son province in 2022.
- Likert, R. A. (1932). A technique for measurement of attitudes, Archives of Psychology. 140 (55): 5-55.
- Ministry of Natural Resources and Environment (2018). Circular No. 27/2018/TT-BTNMT dated December 14, 2018 Regulations on statistics, land inventory, and mapping of current land use status.
- Nam, P. P., Thanh Huyen, P. T., & Van Ha, P. (2021). Factors affecting the management of public agricultural land fund in Gia Lam District, Hanoi City, Vietnam. Land Use Policy, 101, 105151. https://doi.org/10.1016/j.landusepol.2020.105151.
- Nguyen Thi Yen (2016). Research on the impact of urban development on agricultural land use management and people’s lives in Thai Nguyen City, Thai Nguyen province. PhD thesis. University of Agriculture and Forestry – Thai Nguyen University.
- Nguyen Tien Sy (2017). Current status and solutions to improve the effectiveness of resolving complaints, denunciations, and lingering land disputes. Ministerial level tasks. Inspectorate of the Ministry of Natural Resources and Environment, Ministry of Natural Resources and Environment.
- Nguyen Tuan Hung (2019). Research the effects of some land policies on agricultural land management and use in Nam Dinh province. Doctoral thesis, Vietnam Academy of Agriculture.
- Nunnally, J. C., & Bernstein, I. H. (1994). Psychometric theory (3rd ed.). New York: McGraw-Hill.
- Pham Thanh Que (2020). Research and propose solutions for community-based management and use of forest land in Hoa Binh province. Doctoral thesis, Vietnam Academy of Agriculture.
- Qiao, Y. (1999). Interstate Fiscal Disparities in America: A Study of Trends and Causes. Routledge. https://doi.org/10.4324/9780203824153.
- Tabachnick, B. G., & Fidell, L. S. (1996). Using Multivariate Statistics (3rd ed.). New York: Harper Collins.
- Tran Thai Yen (2022). Research the impact of the urbanization process on management, land use, and the lives and jobs of people in Vinh City, Nghe An province. Doctoral thesis, Vietnam Academy of Agriculture.