
Spatial Pattern of Farmers-Herders Conflicts in Guma and Logo Local Government Areas, Benue State, Nigeria
- Halima Aliyu Musa
- Shehu Idris Musa
- Dave Eleojo Ekpa
- Aderoju Laide
- Christiana Bitrus
- Abubakar Tanimu Abubakar
- Zuweira Isah
- Fatima Salaudeen
- 821-834
- Jan 4, 2024
- Agriculture
Spatial Pattern of Farmers-Herders Conflicts in Guma and Logo Local Government Areas, Benue State, Nigeria
Halima Aliyu Musa*, Shehu Idris Musa1, Dave Eleojo Ekpa2, Aderoju Laide3, Christiana Bitrus4, Abubakar Tanimu Abubakar5, Zuweira Isah6, Fatima Salaudeen7
*National Space Research and Development Agency (NARSDA), Obasanjo Space Centre, Umaru Musa Yar’adua Expressway, Lugbe, Airport Road, Abuja, Nigeria
3,4,5,6National Space Research and Development Agency (NARSDA), Obasanjo Space Centre, Umaru Musa Yar’adua Expressway, Lugbe, Airport Road, Abuja, Nigeria
1Nigerian Security Printing and Minting, Abuja, 160, Samuel Ladoke Akintola Boulevard, Garki 900110, Abuja, Federal Capita Territory, Nigeria
2Institute of Ecology and Environmental Studies, Faculty of Science, Obafemi Awolowo University, Ile-Ife, Nigeria
*Corresponding Author
DOI: https://dx.doi.org/10.47772/IJRISS.2023.7012063
Received: 07 October 2023; Accepted: 18 October 2023; Published: 03 January 2024
ABSTRACT
This study was conducted on Spatial Pattern of Farmers-Herders Conflict in Guma and Logo LGAs, Benue State. Data used in this study include study area Shapefile, coordinates from Global Positioning System (GPS), number of conflict incidence and fatality from Armed Conflict Locations and Event Data (ACLED). Geospatial technique with the aid of ArcGIS software and descriptive statistics were employed to analyse the data. The finding reveals that from 2015-2018 the highest incidence and fatality rate occurred in 2018 and this could be attributed to incessant attack. The highest incidence occurred in Gbajimba and Ugba areas of Guma and Logo having 47 and 40 incidence correspondingly. Guma has the highest incidence and fatality rate within the study period. Policy on grazing should be enforced in the study area and more security personnel should be deployed to the area to avert further devastation.
Keywords: Spatial Pattern, Farmers, Herdsmen, Conflicts
INTRODUCTION
Over the years, the manifestation of climate change has led to a wide spread vulnerability in the world, and Nigeria is not an exception. The sustainability of agriculture and pastoral production in Nigeria is being threaten by various factors leading to struggle over available resources and increasing farmers-herder’s conflict in Nigeria (Akerjiir, 2018). The conflict between herders and farmers is a protracted issue in Nigeria. Violent clashes between them have been frequent since the 1980s, but gained new momentum in intensity and reoccurrence at the country’s return to civilian rule in 1999 (Blench, 2003).
The current state of the North Central region pictures what Robert Kaplan (1994) explained as “the coming anarchy”. Farmer-herder conflicts are among the key manifestations of this anarchy and this is premised on the socio-political composition of the country. As posited by the Human Rights. The frequent occurrence of Fulani herdsmen and farmers crisis in Nigeria has left adverse effects on food security and socio-economic development of the people in the affected states (Damba, 2007). In the course of these conflicts, farmers have at certain times, taken up weapons to counter the attacks from the Fulani herdsmen, claiming to do so in self-defense. The study conducted by Kassam (2016) gave an overview of the general concept and causes of conflicts in Nigeria and, advocates for ethical principles such as the common solidarity of humanity by origin, forgiveness and tolerance that could engender cordiality and understanding rather than sustained hostility and suspicion in Fulani herdsmen and farmers relation in Nigeria.
Violence between Farmers and Fulani herdsmen is one of Benue state’s most persistent security scourges which have displaced thousands of persons, destroyed many properties and left thousands of people dead in recent decades. (Emmanuel et al., 2019). The frequent clashes between herdsmen and farmers in the predominantly farming areas of Benue state have resulted in the destruction of lives and farmlands. Nine out of the 23 local governments in Benue state which include Guma, Gwer-West, Agatu, Logo, Kwande, Ukum, Tarka and the Northern part of Makurdi are mostly affected by the rampaging herdsmen (Apenda, 2016). The International Crisis Group (2017) stated that Benue State seems to be the hardest hit (in Adetula, 2016).
Food is life; hence, food has become an instrument of national power (Ojo and Adebayo, 2012). Nigeria, blessed as it is, with abundant agroecological resources and diversity, has become one of the largest food importers in sub-Saharan Africa (Idachaba, 2009). Food security is imperative in any country and this is why all developed and developing countries make considerable efforts to increase their food production capacity. The food production capacity of Benue State known as “Food Basket of the Nation” has reduced from production capacity of 100% to about 65%. This is because agro inputs are rarely found because marketers have taken to their heels, crops on the farm lands destroyed, most farmers especially those whose lives have not been exterminated have taken to their heels. One greatest consequence of this is that the economic base of and activities of the people of Benue State have been greatly affected arising from the abandonment of their various communities by the farmers for their dear lives (Nformi et al., 2014).
The farmers and herders conflict did not only have implications on the livelihood of the two parties involved but also distorts and browbeats the agricultural and pastoral production particularly in Benue state and Nigeria in general. The people of Guma and Logo local government areas are suffering from the impacts of farmers-herders conflict and this need to be addressed. Research in this regard particularly on the analysis of the conflict in the affected LGAs is of great importance to reveal the actual state of the menace.
Study Area
Location
The study area is a two neighbouring local government areas (LGAs), Guma and Logo in Benue State, North central Nigeria with landmass of 2,882km2.and of 1,408km2 correspondingly. The LGAs are located between latitudes 60 35’ and 80 08’ North, and on longitudes 70 47’ and 100 00’ East of the Greenwich Meridian (Figure 1). Guma and Logo LGAs have their administrative headquarters in Gbajimba and Ugba respectively. Guma shares common boundaries with Tarka and Logo LGA in the east, Makurdi local government in the South, Doma local LGA of Nassarawa lied in the North. While Logo shares boundaries with Taraba state and Ukum, Guma, Buruku and Katsina-Ala LGAs in Benue state. The study area has boundary with Nassarawa and Taraba state. Climatically, the study are belongs to the Koppen’s Aw climate group and experiences tropical wet and dry seasons. The rain falls for seven months from April to October with total annual amount ranging between 12,000 – 20,000mm while dry season sets in November and ends in March (Nyagba, 1995). Temperatures are constantly high averaging between 28-320C. Generally, Benue is essentially rich in agricultural produce and also implies that the referent land is viable for grazing. As a result, livestock farmers or pastoralist who are majorly Fulans have migrated and established grazing routes and areas which encroaches into their farm lands and farming communities‟ overtime. The study area possesses potential for the development of viable forest and wildlife reserves.
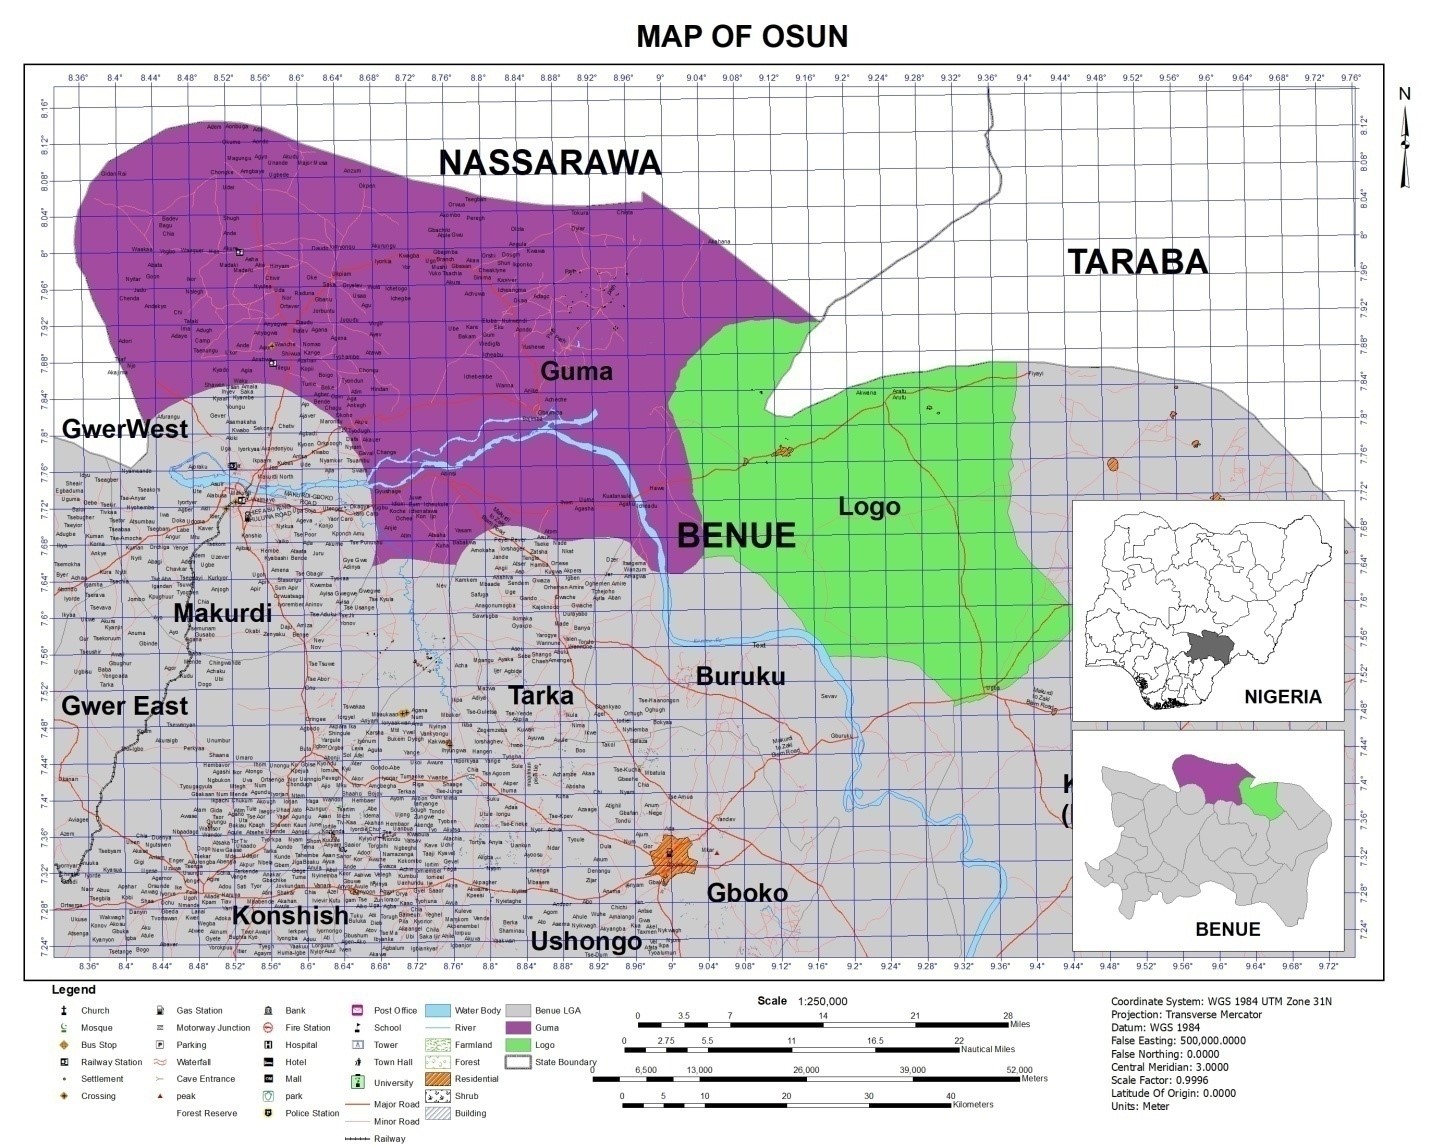
Figure 1.1: Study Area
METHODOLOGY
Data Collection
In conducting this study some vita data were collected and they comprise administrative shapefile of the study area from Archive of Open Streets Map/Grid3www.diva-gis.org/datadown, 2006 Population data of the area from the record of the National Population, Geographic Coordinates System (GCS) of conflict incidences (2015-2018) from Armed Conflict Location and Event Data (ACLED), relevant information from articles, reports from government agencies, and other publications which contain necessary data related to this study.
Determination of the Specific Location of Conflicts in the Study Area
To analyse locational data using ArcGIS software, there are certain measures to be taken which include the following procedures: A working folder was created for this study where all the required spatial data were saved and analysed. From the shapefile the Benue state shapefile was imported into the ArcGIS environment and the study area was extracted from it. Thereafter, further steps were taking to create the study area map which was used for the spatial analyses.
To determine the specific location of conflict incidences in the study area GPS points’ data of the locations was computed into the ArcGIS software. Before analysing the data in the ArcGIS software the data needs to be converted to a compatible format as follows: The farmers and herdsmen conflict incidences GPS points’ data collected from the Armed Conflict Locations and Event Data (ACLED) were computed in Microsoft excel sheet and saved as comma delimited (csv). This file format in an Excel sheet was exported to the ArcGIS software for further analysis. The converted points’ data were imported to the software environment and were processed, then the incidence locations were displayed on the study area map after which the farmers and herdsmen conflict incidence locations maps were produced per year for the study period (2015-2018).
Examine Temporal Pattern of Farmers-Herders Conflict Fatalities (2015-2018)
The ArcGIS 10.4 software was to examine the spatial temporal pattern of farmers-herders conflict fatalities in the study area. After creating the study area map the ArcGIS attribute table was opened thereby adding the fields needed for computing the incidences’ data of the study area. In the software standard tools bar under editor the editing option was selected so that incidence data can be computed into the attribute table fields. The data were saved from the editor standard toolbar on the software. Then the spatial pattern of farmers and herdsmen conflict incidence maps were created on the software environment and exported.
Trend Analysis of Farmers-Herders Conflict Incidence in various Locations in Guma and Logo LGAs (2015-2018)
The trend analysis was carried out in Microsoft excel. The Guma and Logo fatalities’ data of the farmers-herders conflict were computed in the Microsoft excel sheet. The computation of the fatalities data were done for four years of the study period (2015-2018) separately for Guma and Logo local government areas of Benue state. After computing the data, the bar chart data presentation option in Microsoft excel was used to analyse the data.
RESULTS
Determination of the Specific Location of Conflicts in the Study Area
It is very essential to determine the specific locations of farmers-ders conflict in the study area as this could be used for necessary measures in preventing future attack. Thus, in this study, the specific locations of farmers-herders conflict incidences are presented in Figure 2 and Table 1. The finding shows that in 2015 farmers-herders conflict incidence occurred seven times with a fatality rate of 44 in Logo while in Guma there were two incidences with 10 fatalities. This means that Logo experienced more conflict incidence and fatality rate than Guma LGA in 2015. The fatality rate varies slightly in different locations and there were more attacks in some certain areas like Ugba which has the highest rate (16) of fatality was attacked four times in 2015 while other areas were attacked once. Thus, the location point were overlaid on each other. The fatality includes both the farmers and the herdsmen.
In 2016, there were 10 farmers-herders conflict incidence with 71 fatalities in Logo while 1 incidence occurred (Armed clashed) in Guma without any fatality (table 2). The finding reveals that 9 incidences occurred in one particular location in Ugba village with a total of 56 fatalities in the area while another 15 fatalities occurred in Tombo village in the same. This implies that there is significant difference between the rate of incidence and fatality rate between the Logo and Guma farmers-herders conflict in 2016. This is could be attributed to the spread of most population of the few major towns into the hinterland for farming purposes. This makes it difficult for any defense system to be mounted against the Fulani herdsmen. Farmers could not defend themselves let alone attacking the herdsmen. The few casualties suffered by the herdsmen were orchestrated by cattle rustlers and some security personnel who were deployed at flash points under ‘operation whirl stroke’ to curb the attacks on farmers (Ben and Adamu, 2017).
Figure 4 (table 3) indicates that in 2017, there were a total of 6 incidences and 16 fatalities in Logo LGA while there was no incidence and fatalities recorded in Guma LGA between the farmers-herders conflict in the study area. One of the incidences that occurred in Logo was sexual violence and others were violent attack between farmers and herdsmen. Most of the incidences (6) took place in Ugba village whereas one happened in Ugondo with seven fatalities. These two villages are found in Logo LGA. Based on the previous study it can be inferred that such high incidence and fatalities occurred in Logo due to the characteristics of its geographical location.
The farmers-herders conflict in 2018 as shown in figure 5 and table 4 indicates that Guma LGA experienced the higher incidences of 47 comprising 179 fatalities while Logo LGA had 40 incidences consisting 119 fatalities. The finding reveals that Guma has the higher incidence and fatality rate of the conflict. The incidences with the fatality rate of the conflict appear to be very high in 2018 than the previous years and this could be as a result of continuous attack or conflict between the farmers and the herdsmen as well as the difficult in settling the bone of contentions. The incidences recorded in Guma involve violent attack (166), armed clashed (12), strategic arrest (1) government regains territory (1) while that of Logo comprises violent attack (110), armed clashed (7), strategic development (1), strategic development involving destruction of properties (1). Gbajimba (42) and Ugba (16) villages in Guma and Logo respectively recorded the highest number of incidence in the conflict between farmers-herders in 2018. There are slight disparities in the fatalities rate recorded in other villages within Guma and Logo. Locations that attack happen constantly can be identified and security of such areas could be improved. The security officers could be positioned in such areas to ensure that the culprits or perpetrators are arrested and charged for their offence(s).
![]()
Figure 2: Incidence Locations of Farmers-Herders Conflict in Guma and Logo LGAs
Table 1: Incidence and Fatality Rate of Farmers-Herders Conflict in Guma and Logo LGAs, 2015
| S/No | Guma Incidence Locations | Guma Incidence & Fatality Rate | Logo Incidence Locations | Logo Incidence and Fatality Rate |
| 1. | Gbajimba 7.8155N 8.8604E | 5 | Iorzaa: 7.1622N 9.0888E | 13 |
| 2. | Gbanu 7.95N 8.6167E | 5 | Kulungu: 7.729N 9.2002E | 9 |
| 3. | Tsevii: 7.7718N 9.2439E | 6 | ||
| 4. | Ugba: 7.5N 9.333E (4 Times) | 12, 2, 1, and 1 | ||
| Total | 2 | Incidence=2
Fatality=10 |
4 | Incidence=7
Fatality=44 |
Note: Fatality= Number Decease, Incidence= Number Attack
![]()
Figure 3: Incidence Locations of Farmers-Herders Conflict in Guma and Logo LGAs
Table 2: Incidence and Fatality Rate of Farmers-Herders Conflict in Guma and Logo LGAs, 2016
| S/No | Guma Incidence Locations | Guma Incidence and Fatality
Rate |
Logo Incidence Locations | Logo Incidence and Fatality
Rate |
| 1. | Gbajimba (7.8155N 8.8604E) | 0 (Armed Clashed) | Ugba (7.50N 9.33E) | 0, 10, 3, 2, 9, 20, 2, 2 and 8=56 |
| 2. | Tombo (7.48E 9.29N) | 15 | ||
| Total | 1 | Incidence=1
Fatalities=0 |
2 | Incidence= 10
Fatalities=71 |
![]()
Figure 4: Incidence Locations of Farmers-Herders Conflict in Guma and Logo LGAs
Table 3: Incidence and Fatality Rate of Farmers-Herders Conflict in Guma and Logo LGAs, 2017
| S/No | Guma Incidence Locations | Guma Incidence and Fatality
Rate |
Logo Incidence Locations | Logo Incidence and Fatality
Rate |
| 1. | Ugba (7.50N 9.33E) | 1, 6, 8, 1 and 0 (Sexual Violence=1) | ||
| 2. | Ugondo (7.4847N 9.3717E) | 7 | ||
| Total | 0 | Fatalities=0
Incidence=0 |
2 | Fatalities=23
Incidence=6 |
![]()
Figure 5: Incidence Locations of Farmers-Herders Conflict in Guma and Logo LGAs
Table 4: Incidence and Fatality Rate of Farmers-Herders Conflict in Guma and Logo LGAs, 2018
| S/No | Guma’s Incidence Locations | Guma’s Incidence and Fatality
Rate |
Logo’s Incidence Locations | Logo’s Incidence and Fatality
Rate |
| 1. | Chiata (8.0333N 8.95E | 10 | Ugba (7.50N 9.33E) | 0, 2, 1, 1, 2, 0, 0, 4, 1, 5, 3, 1, 1, 1, 1, 9,
(Armed Clashed=5, Strategic Dev= 1 Strategic Dev. (Destruction of Properties)=1) =32 |
| 2. | Gbajimba (7.8155N 8.8604E) | 1, 16, 6, 2, 0, 12, 0, 0, 0, 4, 1, 2, 1, 0, 2, 1, 0, 6, 19, 20, 16, 15, 2, 0, 0, 2, 1, 2, 2, 3, 5
(Armed Clashed=12, Government Regain Territory=1 Strategic Arrest= 1) |
Anyim (7.8188N 9.2453E) | 0, 2, 2, 2, 1, 9= 16 |
| 3. | Yogbo (7.9974N 8.4467 | 8 | Tombo (7.4819N 9.2948E) | 3, 2= 5 |
| 4. | Agasha (7.7166N 8.899E | 10, 2 | Gaambeti (7.8029N 9.3436E | 1, 3= 4 |
| 5. | Umenge (7.8469N 8.8546E) | 6 | Tse Agule (7.5524N 9.3601E) | 2, 3= 5 |
| 6. | Akor (7.8446N 8.8092E) | 6 | Tsevii (7.7718N 9.2439E) | 7, 3, 2= 12 |
| 7. | Tom-Atar (7.8414N 8.8881E | 6 | Tse Akom (7.5311N 9.3132E) | 3, 3-6 |
| 8. | Turan (7.5251N 9.3483E) | 6, 6=12 | ||
| 9. | Ngambe-1 (7.537N 9.371E) | 7, 6=13 | ||
| 10. | Ayilamo (7.5134N 9.3212E) | 6, 6=12 | ||
| 11. | Gbajimba (7.8155N 8.8604E) | 2=2 | ||
| Total | 10 | Fatalities=179,
Incidence=47 |
11 | Fatalities=119
Incidence=40 |
Note: Fatality= Number Decease, Incidence= Number Attack
Temporal Pattern of Farmers-Herders Conflict Fatalities (2015-2018)
Fatality occurs in most of the farmers and herdsmen conflict incidence. The spatial pattern of farmers-herders conflict fatality rate is shown in figure 6 and table 5 having three different classes as the green fraction represents low fatality area, yellow stands for moderate fatality while the light yellow part denotes high fatality in the study area. The conflict is moderate in the largest part of the study area which covered most setting of Guma LGA. Before 2018, Logo was more affected by the conflict than Guma as the fatality rate and numbers of incidences in Logo are higher. Throughout the study period the fatality rate is greatly higher than the incidence rate and this means that there is significance difference between the fatality and incidence rate of the famers-herders conflict in the study area.
Vast geographical area of Guma local government area has placed farmers in a situation that compel them to live with the Fulani herdsmen particularly during the dry season (November to April). Similarly, the Fulani herdsmen still practice the free range system. They move from one place to another in search of pasture and water. This usually forced them to migrate from far north to Guma local government area in Benue valley where both pasture and water resources can be found. This has increase the competition for arable land between Fulani herdsmen and farmers resulting to hostility and social friction among the two user groups in the local government (Musa et al., 2021).
Life is valuable and without life man cease to exist from this planet earth. The farmers-herders conflict has resulted to great loss of lives in Guma and Logo LGAs since its inception. Most attacks that occur involve loss of lives and destruction of properties. In the context of this study fatality means the death rate due to farmers-herders conflict in the study area.
![]()
Figure 6: Fatality Rate of Farmers-Herders Conflict in Guma and Logo LGAs
Table 5: Incidence and Fatality Rate of Farmers-Herders Conflict in Guma and Logo LGAs, 2015-2018
| S/No | Year | Guma Fatality
Rate |
Guma Incidence | Logo Fatality
Rate |
Logo
Incidence |
| 1. | 2015 | 10 (5.29%) | 2 (4.00% ) | 44 (17.12%) | 4 (8.33%) |
| 2. | 2016 | 0 (0.00%) | 1 (2.00%) | 71 (27.63%) | 2 (4.17%) |
| 3. | 2017 | 0 (0.00%) | 0 (0.00%) | 23 (8.95%) | 2 (4.17%) |
| 4. | 2018 | 179 (94.71%) | 47 (94.00%) | 119 (46.30%) | 40 (83.33%) |
| Total | 189 | 50 | 257 | 48 |
Trend Analysis of Farmers-Herders Conflict Incidence in various Locations in Guma and Logo LGAs (2015-2018)
The need to reveal the trend analysis of farmers-herders conflict incidence in various the locations in Guma and Logo LGAs is very important as this could clearly inform the public where the conflict incidence is high, moderate and low within the study period thereby taking caution on how they move or travel around the study area so as to attack. This is also essential to the government as it will inform the government on how to deploy security officers to the area and likewise it will help the security officers to know the kind of measures to take in various locations which involve low, moderate and incidence.
In line with the significance of trend analysis of farmers-herders conflict incidence, figure 4.6 indicates the Trend analysis of farmers-herders conflict incidence in various locations in Logo LGAs between 2015 and 2018. In Logo within the study period (2015-2018) fourteen locations where affected and the most affected location is Ugba (7.5N and 9.3333E). The highest number of incidence occurred in 2015 and 2017 in Ugba area. From 2015-2017 there were one incidence per each area in Iorzaa, Kulungu ans Tsevii while others areas recorded no incidence. However, from 2015-2017 Ugba recorded 4, 9 and 5 incidences per year respectively. Based on this finding it is very essential that Ugba area which is the most affected area needs more security officers and government support to prevent hunger, lack of shelter, reprisal and prevent further attack on the people.
Table 4.6, reveals that in Logo LGA from 2015-2018 Iorzaa had 1.00, 1.00, 0.00 and 0.00 incidences accordingly, in Kulungu there was 1.00, 0.00, 0.00 and 0.00 incidence per year for the whole study period respectively, Tsevii recorded 1.00 and 3.00 incidences in 2015 and 2018 accordingly but no incidence between 2016-2017, Ugba experienced 4, 9, 3, 16 incidences in 2015, 2016, 2017 and 2018 correspondingly, Ugondo encountered 1.00 incidence in 2017 and 1.00 incidence in 2018 but no incidence in 2015 and 2016. Anyim, Tombo, Gaambeti, Tse Agule, Tse Akom, Tse Akom, Turan, Ngambe-1, Ayilamo and Gbajimba recorded 6, 2, 2, 2, 2, 2, 2, 2 and 1 incidences respectively. This finding shows that in 2018 incidence occurred in each of the affected locations except in Iorzaa and Kulungu which had 1.00 incidence per each in 2015 while Ugba experienced incidence throughout the study years and this location recorded the highest incidence rate.
![]()
Figure 7: Trend Analysis of Farmers-Herders Conflict Incidence in various Locations in Logo LGA (2015-2018)
Table 6: Farmers-Herders Conflict Incidence in various Locations in Logo LGA (2015-2018)
| Year | Iorzaa | Kulungu | Tsevii | Ugba | Ugondo | Anyim | Tombo | Gaambeti | Tse Agule | Tse Akom | Turan | Ngambe-1 | Ayilamo | Gbajimba |
| 2015 | 1 | 1 | 1 | 4 | 0 | 0 | 0 | 0 | 0 | O | 0 | 0 | 0 | 0 |
| 2016 | 0 | 0 | 0 | 9 | 0 | 0 | 0 | 0 | 0 | 0- | 0 | 0 | 0 | 0 |
| 2017 | 0 | 0 | 0 | 5 | 1 | 0 | 0 | 0 | 0 | 0 | 0 | 0 | 0 | 0 |
| 2018 | 0 | 0 | 3 | 16 | 1 | 6 | 2 | 2 | 2 | 2 | 2 | 2 | 2 | 1 |
| Total | 1 | 1 | 4 | 34 | 2 | 6 | 2 | 2 | 2 | 2 | 2 | 2 | 2 | 1 |
Figure 8, shows the trend analysis of farmers-herders conflict incidence in various locations in Guma LGAs from 2015-2018 and seven locations were affected. Gbajimba recorded the highest number of incidence (40) in 2018 followed by Agasha with 4 incidences in the same year whereas Umenga recorded 2 incidences and the other areas (Akor, Gbanu and Tom-Akor) encountered one incidence per each. In 2015, only Gbajimba and Gbanu experienced one incidence per year while other areas had no incidences. In 2016 only Gbajimba recorded one incidence while the remaining areas did not encounter any incidence. This finding has been able to reveal that within the study period Gbajimba is the most affected locations and the next area is Agasha in Guma LGA. Thus, these two locations require more attention of the government and security personnel for protection of lives and properties in Guma LGA. The finding in table 7 shows that in Guma LGA from 2015-2018 Gbajimba recorded 1.00, 1.00, 0.00 and 40.00 incidences respectively, in Gbanu there was 1.00, 0.00, 0.00 and 0.00 incidence between 2015 to 2018 correspondingly, Chiata had 0.00, 0.00, 0.00 and 1.00 incidence in each year, Agasha encountered only 4 incidences in 2018 throughout the study period, similarly, Umenge, Akor, Atar and Akumba recorded 2, 1, 1, and 1 incidences in 2018 respectively during the study years as the four areas had no incidences between 2015-2017.
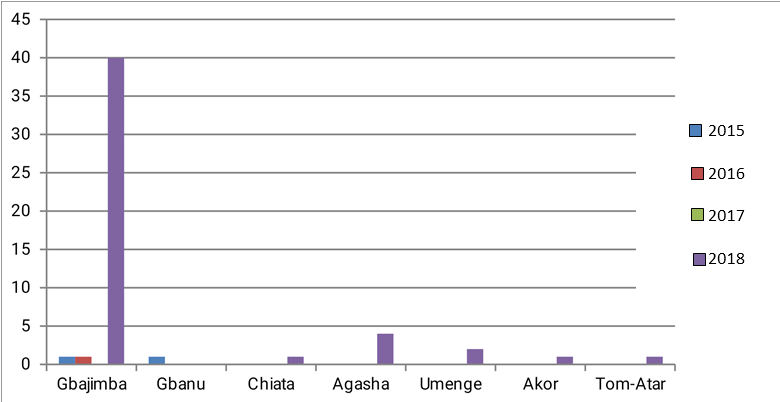
Figure 8: Trend Analysis of Farmers-Herders Conflict Incidence in various Locations in Guma LGA (2015-2018),
Table 7: Farmers-Herders Conflict Incidence in various Locations in Guma LGA (2015-2018)
| Year | Gbajimba | Gbanu | Chiata | Agasha | Umenge | Akor | Tom-Atar | Akumba | |
| 2015 | 1 | 1 | 0 | 0 | 0 | 0 | 0 | 0 | |
| 2016 | 1 | 0 | 0 | 0 | 0 | 0 | 0 | 0 | |
| 2017 | 0 | 0 | 0 | 0 | 0 | 0 | 0 | 0 | |
| 2018 | 40 | 0 | 1 | 4 | 2 | 1 | 1 | 1 | |
| Total | 42 | 1 | 1 | 4 | 2 | 1 | 1 | 1 |
DISCUSSION
This study revealed that Guma has the higher incidence and fatality rate of the conflict. The incidences with the fatality rate of the conflict appear to be very high in 2018 than the previous years and this could be as a result of continuous attack or conflict between the farmers and the herdsmen as well as the difficult in settling the bone of contentions. From 2015 to 2018, Gbajimba and Ugba areas of Guma and Logo recorded 47 and 40 incidences respectively as the highest number of incidence of the farmers-herders conflict. The spatial pattern of farmers-herders conflict fatality rate between 2015 and 2018, shows that the conflict is moderate in the largest part of the study area which covered most setting of Guma LGA. The temporal pattern of Farmers-Herders conflict fatalities (2015-2018) reveals that Guma LGA covered the largest part of the study area which experienced the conflict and this appeared to be moderate in the fatality rating. There is significance difference between the fatality and incidence of the famers-herders conflict in the study area as fatality rate is greatly higher than the incidence all through the study period
Cumulatively, the farmers-herders conflict incidence in Logo at different locations indicates that within the study period fourteen locations where affected in Logo and the most affected location was Ugba (7.5N and 9.3333E) as the highest number of incidence occurred in 2015 and 2017 in this area. From 2015-2017 there were one incidence per each area in Iorzaa, Kulungu ans Tsevii while others areas recorded no incidence. While in Guma LGA the farmers-herders conflict incidence at different locations reveals that from 2015-2018 seven locations were affected and Gbajimba recorded the highest number of incidence (40) in 2018 followed by Agasha with 4 incidences in the same year but in 2015, only Gbajimba and Gbanu encountered one incidence per year while other areas had no incidences. In 2016 only Gbajimba recorded one incidence while other areas had no incidence. The finding reveals that Gbajimba and Agasha both in Guma LGA were the most affected locations within the study period.
CONCLUSION
This study examine the spatial pattern of farmers-herders conflict incidence in Guma and Logo LGAs in Benue state thereby unveiling the specific location of conflict incidence in the study area; and reveal the trend pattern of farmers-herders conflict incidence in various locations in the study area (2015-2018). The farmers-herders conflict has adversely affected the people in Guma and Logo LGAs in diverse ways and these effects include loss of life, destruction of properties, decline in livelihood, low agricultural productivity, lack of peace, among other socioeconomic problems and environmental menace. Ugba in Logo and Gbajimba in Guma were identified as the most affected locations and this implies that the locations need more security officers and government support to prevent further attack on the people. There is possibility to resolve the farmers-herders conflict in the study area if the necessary measures are taken by individuals in the land, communities’ leaders, the state and the federal government. Unless, this conflict is addressed more casualties including loss of lives and properties will occur in the future. Moreover, this problem can lead to high rate of poverty, chronic hunger, severe environmental and socioeconomic problems in the study area and other parts of the country in the nearest future. In spite of the high in the study area, with the aid of security officers and researcher further study on the impact of the conflict on the people should be conducted ensuring that there is direct contact with the residents to receive firsthand information from them employing structured questionnaire, focus group discussion and interview. Policies on grazing should be adequately enforced and the both parties (farmrs-herders) should be sensitized effectively to understand the impact of the conflict on them and the entire society
REFERENCES
- Adamu and Ben (2017). Nigeria: Benue State under the ‘Herdsmen Terrorism’ Canada, World Watch.
- Adetula (2016). Dispensation”, Paper Presented at ARMTI, Ilorin, Kwara State (March 24).
- Akerjiir (2018). Increasing Farmer-Herder Conflict in Nigeria: An Assessment Of The Clashes Between The Fulani Herdsmen and Indigenous Farmers in Ukpabi-Nimbo Community Enugu State
- Apenda, I. T. (2016). An Assessment of the Impact of Farmers Herder’s Conflict on Food Security in Benue State, Nigeria, International Journal of Development Strategies in Humanities, Management and Social Sciences 6 (2).
- Blench, R. (2010). National resources conflict in North-Central Nigeria: A handbook and case studies. Mallam Dendo Ltd.
- Emmanuel Francis, 2Yahaya Bitrus Bawa & 3Mohammed Sule Haruna (2019). Impact of Farmers and Fulani Herdsmen Conflict on Socio-Economic Activities in Agatu LGA of Benue State, Nigeria. International Journal of Scientific Research in Social Sciences and Management Studies | IJSRSSMS p-ISSN: 2579-101X | e-ISSN: 2579-1928. Volume 4 Number 2 December, 2019
- Idachaba, F.S. (2009), “The Looming Food Crisis”, Newswatch, Lagos, (August 3), Special Colloquium Editi
- International Crises Group (2017). Herders against farmers: Nigeria’s expanding deadly conflict. Retrieved from https://www.crisisgroup.org/africa/west-africa/nigeria/252-herders-against-farmers-nigerias-expanding-deadlyconflict.
- Kassam (2016). Effect of Fulani–Herdersmen and Farmers Crises on Food Security. Samphina Academy. https://samphina.com.ng
- Musa S. D., Shabu T., Igbawua M. I. (2014). Resource Use Conflict between Farmers and Fulani Herdsmen In Guma Local Government Area of Benue State, Nigeria. Journal of Basic and Applied Research International.
- Nformi, M. I., Mary-Juliet, B., Engwali, F. D. and Nji, A. (2014). Effects of farmer-grazer conflicts on rural development: a socio-economic analysis. Journal of Agricultural Science, 4(3): 113-120.
- Nyagba, J. I. (1995). Soils and Agriculture in Benue State”, in Denga, D.I. (eds), Benue State, the Land of Great Potentials, a Compendium. Nigeria Rapid Education Books Limited, Makurdi. Pp. 102-5.
- Robert K. (1994). The Coming Aarchy. The Atlantic Monthly. Wikipedia. www.theatlantic.com. en.m.wikipedia.org