
Stakeholder Perspective on The Quality of Public Bus Transport Services in Birmingham, United Kingdom.
- Ayobami Farayibi
- Akpudo Chijioke Udechukwu
- 1401-1412
- Apr 22, 2023
- Transport Management
Stakeholder Perspective on The Quality of Public Bus Transport Services in Birmingham, United Kingdom.
Ayobami Farayibi1, Akpudo Chijioke Udechukwu2
1Department of Transport Management, Birmingham City University
2Department of Logistic and Transport Technology, Federal University of Technology Akure University
*Corresponding Author
Received: 02 February 2023; Accepted: 21 February 2023; Published: 22 April 2023
ABSTRACT
Public transportation comprises all transport facilities in which passengers do not use their personal means of transportation to travel. It includes shared taxis, mini buses, buses, and trains. Public transportation is of essence to passengers, due to the fact that it offers opportunity to move from one location to the other with ease. The survival of any business in today’s competitive world is highly dependent on its performance, which is further determined by the quality of services as delivered to the customer’s organization. Therefore, service quality and customer satisfaction become major issues for various service providers across all the sectors. Based on these, the aim of this study was to investigate the service quality attributes that influence passenger satisfaction of public bus transport services in Birmingham using five bus routes namely 6, 24, 27, x51, and 95. The study employed qualitative and quantitative research approach. Data used were derived from primary data source. Traffic count was conduct to get the population of the study and at the end questionnaire was administered to 334 respondents forming the sample size of the study. At the end, 91.3% (305) of the questionnaires were used to make judgment of the stated objectives. The data generated were analyzed using descriptive statistics, multiple regressions and correlation. The result indicates that all the factors considered in the study determined the service quality of the public bus transport. The study recommended that due to the high level of customer satisfaction observed in the study, national express operators should be encouraged for more improvement in order to enhance organizational performance and achieving competitive advantage.
Keywords: Public transportation, Service quality, Satisfaction, Bus, Passengers.
INTRODUCTION
Traffic congestion has recently been a problem in both industrialized and developing nations. According to Aziz & Mohamad (2013), the traffic congestion situation was due to population increases which reflect the public transport demand and related issues within the urban areas, as a result public transportation is one of the alternatives to overcome these issues(Thomas, 2018). Public transport by definition according to Aderamo (2010) is the act of conveying a large number of people en-masse, as opposed to conveyance in individual vehicles. Public transport systems provide the most efficient means of moving large numbers of people, especially in densely populated urban centers. Public transportation is crucial for the productivity of cities, which in turn has a direct impact on the state’s economy, in addition to the welfare of its users (Craig, 2016). It includes bus systems, light rail systems, tramways and monorails, rail systems, and, when practical, water transportation. The population and area of a city may have an impact on the decision to use one of these public transportation options, or a mix of them (Aderamo, 2010).The bus system will be used in this study as the mode of transportation because buses can be used in a variety of passenger capacities and performance levels, as well as on fixed routes with set schedules or possibly flexible routes(Craig, 2016). In Birmingham, bus systems have the potential of extending transport services to greater proportions of urban residents who do not have private cars (Sakdiratet.al2021). In most cities of developed countries, buses are used as policy tools to reduce the number of private cars on the roads and thus reduce traffic chaos in cities. The demand for public bus transport in developed countries is very high as a result of many people being within the low-income bracket. Nonetheless, the available alternative modes for public transport are very limited and few in developing countries compared to developed countries (Sakdiratet.al.,2021).
Despite the vital role that buses can play in any urban area, their services in most developed countries are frequently insufficient to meet demand, and the services provided suffer from the low output (Ali & Onokala, 2017). As a result, they have a negative public image. Birmingham is missing out on £3.6bn in productivity as more than 1.6 million residents do not have quality public transport links to the centre of the city (Adeniran, 2018). Unfortunately, there are several news regarding poor service quality of bus services in Birmingham such as lack of service information, speed and handling management of the buses, inappropriate bus schedule ticket and so on. Research shows Birmingham’s transport network significantly underperforms when compared with Munich. Although Birmingham has the larger transport network and population (2.5 million to Munich’s 1.5 million), Munich is still able to bring nearly 200,000 more residents to its centre than Birmingham. Based on this backlog, there is need to improve the public bus transport system in Birmingham. In order to do this, it’s crucial to get feedback from system users on the improvements they’d like to see made in order to better fulfill their demands. This is because the provision of public bus transport services is passenger-centered. Achieving stakeholder (passengers) satisfaction implies total quality management (TQM) that continuously improves service quality. Customer satisfaction with transportation services can be placed in the framework of stakeholder (passengers) interest because service performance of any transport system like public bus transport is measured from the passenger’s perception and expectation (Too & Earl, 2010). From this perspective passenger satisfaction with bus transportation can be used to find reasonable solution to problems confronting the system (Ali, 2010). The more frequent passengers have to change buses to get to their destinations, the less satisfied they will be with bus service (Olagunju, 2011).
However, few studies like Craig et.al. (2016); Charles & Tina (2021);Enochet.al. (2018); (Akeem, et. al (2018) have discussed public bus transport service both at the national and local levels and focused on impacts, constraints, and the effect of congestion on vehicle movement but there is scant literature on passenger satisfaction and service quality with levels of public bus service provision in Birmingham. For instance, Craig (2016) study the customer perceptions of quality of service in public transport: Evidence for bus transit in Scotland. It was observed that perceived convenience of the bus service appears to have a significant positive explanatory power over perceived satisfaction with the bus service. The study goes further to suggests that improvements to service frequency, availability, reliability and stability will likely increase perceived satisfaction amongst existing passengers. Enoch et.al (2018) revealed vast differences between public bus transport service quality expectations and perceptions and a general dissatisfaction with the bus service delivery in the city. Based on the literature reviewed, despite the remarkable efforts put into by scholars, the literature reviewed outside United Kingdom may not be appropriate in the United Kingdom context because of the differences in government policies and management. Although studies have attempted studying the influence of service quality attributes on satisfaction (Craig, et.al 2016; Charles & Tina, 2021).
Frimanet al. (2011) conducted a mail survey to investigate factors affecting customer satisfaction in public transport service in Sweden. Arthur et. al. (2014) examined the effect of quality improvements in public transport on customer satisfaction and frequency of perceived negative critical incidents. The study established that customer satisfaction influenced by quality improvements only to a limited extent. Robbines & Johnson (2016) conducted a study on service quality and satisfaction of public transport in Australia to find out dissatisfying factors. Customers reported waste time, overcrowded, lack of comfort, time uncertainty, lack of control, unreliability, long waiting times, lack of flexibility, and long walking time are the dissatisfying factors.
From all indications, none of the above studies identify the major factors determining service quality of public bus transport system that explain passenger satisfaction in the study area. Therefore, the objectives of this study are to; identify major factors determining service quality of public bus transport system that explain passenger satisfaction in Birmingham and evaluate the relative importance of these factors to determine the priority of quality improvements to enhance passenger satisfaction.
METHODOLOGY
The Study Area
The West Midlands is a metropolitan country in the West Midlands Region, England with a 2021 population of 2,919,600 making it the second most populous county in England after Greater London. It lies near the geographic center of England, at the crossing points of the national railway and motorway systems. The city lies approximately 110 miles (177 km) northwest of London. Birmingham saw consistent population increase over the most of its history as it developed into one of Britain’s most significant industrial hubs. The city’s greatest notable phase of expansion was from 1911 and 1921, when the population nearly doubled. The metro area population of Birmingham in 2020 was 842,000, a 0.84% increase from 2019. In term of transportation, Birmingham has a wide bus network. It was observed from the literature that 74% of public transport use in the West Midlands is by bus. National Express West Midlands is a public transport provider in West Midlands which operates Bus routes. Birmingham is also a major hub in the National Express coach network. Their Bus routes cover an area from the North (Etching Hill and the Heath) with a stop at Jeffery Close to the South (Sidemoor), with a stop at Middleton Road. Their most western stop is Shops (Pattingham And Patshull) and the most eastern stop is Belgrade Theatre (Stop Ul5) (St. Michael’s). Most of the network is operated on a commercial basis, with some services supported by transport for west midlands. Smaller operators provide a range of services, either in competition with National Express West Midlands or under contract to transport for west midland. These include Diamond West Midlands and The Green Bus. This study focus on 5 major bus route which includes; Birmingham-solihull (via Sparkbrook, Sparkhill, Hall Green & Shirley), Birmingham – Woodgate Valley North (via Five ways, Harborne, Court Oak & Four dwellings), Longbridge – Maypole (via Frankley, Northfield, Bournville, Stirchley, Kings Heath & Yardley Wood), Birmingham – Cannock (via Great Barr, Walsall & Bloxwich) and, Birmingham – Chelmsley wood (via Kingstanding, Witton Lodge, Erdington, Fort Shopping Park & Castle Bromwich). The routes are presented in Figure 1. The volume of passenger traffic is what determined the choice of these routes.
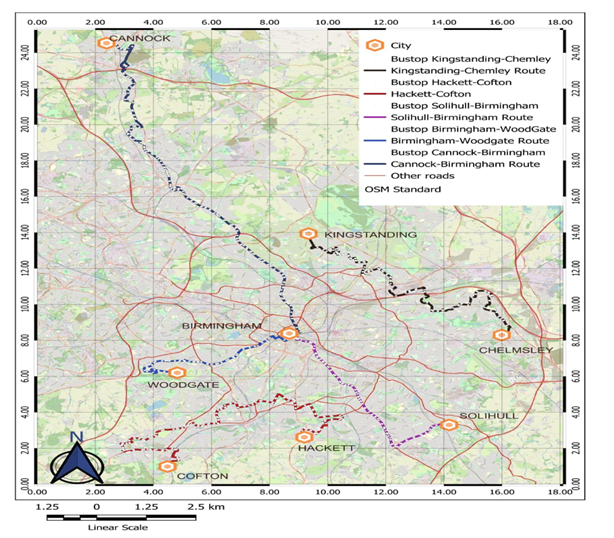
Figure 1 Map of west midland showing study routes
Source: Author’s work (Digitized, 2022)
Population of the Study
The study’s target population are commuters who have used public transportation by bus during the study period on the chosen routes. Four field researchers and some bus drivers worked together to conduct a seven-day traffic count throughout the bus stops along the five study routes in order to ascertain the study’s population. They were each armed with a copy of the traffic count template form. Note that only individuals who boarded the bus at each bus stop were counted. The study does, however, record a total population of 3,644 passengers at the conclusion of the process. These were presented in Table 1.
Table 1 Population for the study
| ROUTES | Day 1 | Day 2 | Day 3 | Day 4 | Day 5 | Day 6 | Day 7 | Total |
| Birmingham – Solihull (via sparkbrook, Sparkhill, Hall Green & Shirley) | 105 | 93 | 99 | 62 | 110 | 137 | 124 | 730 |
| Woodgate valley north (via five ways, harborne, court oak & four dwellings) | 82 | 112 | 117 | 120 | 122 | 109 | 85 | 747 |
| Longbridge – Maypole (via Frankley, Northfield, Bournville, Stirchley, Kings Heath & Yardley Wood) | 83 | 80 | 116 | 102 | 98 | 80 | 91 | 650 |
| Birmingham – Cannock (via Great Barr, Walsall& Bloxwich) | 138 | 109 | 104 | 139 | 140 | 133 | 153 | 916 |
| Birmingham – Chelmsley wood (via King standing, Witton Lodge, Erdington, Fort Shopping Park & Castle Bromwich) | 85 | 83 | 85 | 95 | 81 | 91 | 81 | 601 |
| Total | 493 | 477 | 521 | 518 | 551 | 550 | 534 | 3644 |
Source: Authors computation 2022
The Yamane (1967) technique for calculating sample size was used to determine the sample size for the investigation.
Where
n= N/(1+N (e)2 ) …………………………………………………………..1
n, is sample size; N is Group population size; and e is Level of Significance (0.05%). The decision of 0.05% was made in order to create a manageable sample size for the investigation. However, the sample size of the study is a total of three hundred and thirty-four (334) respondents.
The questionnaires for the study were administered to a total of 3,644 passengers using online method with the wed link to the survey. To extract the major underlying factors of service quality attributes influencing passenger satisfaction, a five-point Likert scale was adopted, where 1 = strongly disagree, 2 = disagree, 3 = neutral, 4 = agree, and 5 = strongly agree.
In this case, descriptive analysis was employed to analyze the socio-economic characteristics of the respondents, their transport patterns, and the quality of their service attributes. Multiple regression analysis was used to extract the major underlying factors of service quality attributes influencing passenger satisfaction. While a correlation analysis was performed to relate the importance of these factors,
The multiple regression models for identify the major factors determining service quality of public bus transport system that explain passenger satisfaction in Birmingham can be formulated as follows:
Y=β0+β1 R+ β2 SC +β3 A + β4 AV +e…………………………………….…2
Where Y is Service Quality (SQ), ß𝑖 is coefficient of the intercept; β1…….β6 are the coefficients of the independent variables, e is the error term that is assumed to be associated with the variables, x1 denote reliability(R), x2 denote Safety and comfort (SC),x3 denote accessibility (A),x4 denoted availability (AV),
PRESENTATION OF RESULT AND DISCUSSION
Socio-Economic Characteristic of the Passengers
To understand respondents’ background, lifestyle, and attitudes toward intra- and inter-city public bus transport (PBT) and transport modal choice, questions relating to their socio-demographics were asked. Factors such as gender, age, income, economic status, level of education, and monthly income were considered important as identified in the literature. This was done to find out if a sizable proportion of the sample respondents had prerequisite knowledge of the subject matter. Table 2 shows that females record the highest percentage above males, representing 52.8% and 47.2%, respectively. The results show that both genders are well represented. The age status of the passengers revealed that 29.2% falls within 16 -25 years, 11.1% were within 26 – 25 years, 6.9% were within 36 – 45years, 14.8% falls within 46 – 55 years, 29.8% were within 56 – 65% and 8.2% were above 66 years. The result of the descriptive analysis revealed that the majority of PBT users in this study fell between 56 and 65 years old, followed by 16 and 25 years old. This result corroborates the work of Craig et al. (2016). It shows that public bus transport users were young, energetic, and still in their productive ages. Based on these characteristics, they were expected to be of sound mind and in a position to understand the central theme of this study and make meaningful contributions accordingly. The economic status was group under six categories as study by Craig et.al (2016).The result shows that the majority of the respondents are students, followed by employed people with a total percentage of 32.1% and 27.2%, respectively. 21.6% were retired people, looking after their homes; permanently sick or disabled people had the same percentage of 7.5%; and the unemployed had a lesser percentage of 3.9%. This finding indicated that the study cut across the various occupations selected. The final analysis in Table 2 also shows the monthly gross personal income of the respondents. The results revealed that 4.6% were for no income, 7.5% were below £2000, 33.1% earned between £2001 to £4000, 29.5% earned between £4001 to £6000, 17.7% earned £6001 to £8000, 4.9% earned £8001 to £10,000 and 2.6% earned above £10,000.
Going by this result, generally, there are relative variations in the annual income of the respondents across different groups. The respondents with a monthly income falling within £2001 to £4000 are much highest than other income groups with 33.1%. This implies that public bus transport users in Birmingham are mainly average-income earners. This finding agreed with the work of Craig et al. (2016).
Table 2: Descriptive Statistic of the Dataset Utilized in the analysis (n = 305)
| Variable | Frequency | Percentage |
| Gender | ||
| Male | 144 | 47.2 |
| Female | 161 | 52.8 |
| Age of the Respondents | ||
| 16 – 25 Years | 89 | 29.2 |
| 26 – 35 Years | 34 | 11.1 |
| 36 – 45 Years | 21 | 6.9 |
| 46 – 55 years | 45 | 14.8 |
| 56 – 65 Years | 91 | 29.8 |
| Above 66 Years | 25 | 8.2 |
| Economic Status | ||
| Employed | 83 | 27.2 |
| Unemployed | 12 | 3.9 |
| Student | 98 | 32.1 |
| Looking after Home or Family | 23 | 7.5 |
| Retired | 66 | 21.6 |
| Permanently Sick or Disabled | 23 | 7.5 |
| Monthly Gross personal Income (GBP) (pounds) | ||
| No income | 14 | 4.6 |
| Below £2000 | 23 | 7.5 |
| £2001 – £4000 | 101 | 33.1 |
| £4001 –£6000 | 90 | 29.5 |
| £6001 – £8000 | 54 | 17.7 |
| £8001 – £10000 | 15 | 4.9 |
| Above £10,000 | 8 | 2.6 |
| 305 | 100.0 | |
Source: Author’s Field Work, 2022
Table 3 shows that 33.4% are daily commuters who make the demand daily, 28.5% make the demand once a week, 32.1% demand twice a week, and 3.9% demand occasionally. Further analysis shows that 35.3% of daily commuters traveled in the morning, 58.8% traveled in the afternoon, and only 3.9% traveled in the evening. However, it was also revealed that 41.4% of those who traveled once a week preferred the afternoon period, and 28.7% of them traveled in the morning. It was also revealed that 45.9% of those who demand it twice a week traveled in the morning, and the second majority traveled anytime of the day with 29.6%, while those who demand it occasionally traveled in the morning, scoring 66.7%. It is clear to conclude that the passenger’s demand varies across all the routes considered, with the majority demanding service on a daily basis and traveling during the peak period (afternoon). This goes to show that a larger percentage of passengers are commuters, which may include home-to-work trips, home-to-school trips, home-to-shopping trips, etc.
Table 3: Frequency of Demand of PBT and time of the day demanded (n= 305)
| Demand | Time of the day demanded | |||||||||
| Morning | Afternoon | Evening | Anytime | |||||||
| Freq | % | Freq | % | Freq | % | Freq | % | Freq | % | |
| Daily | 102 | 33.4 | 36 | 35.3 | 60 | 58.8 | 4 | 3.9 | 0 | 0.0 |
| Once a week | 87 | 28.5 | 25 | 28.7 | 36 | 41.4 | 16 | 18.4 | 10 | 11.5 |
| Twice a week | 98 | 32.1 | 45 | 45.9 | 11 | 11.2 | 13 | 13.3 | 29 | 29.6 |
| Occasionally | 12 | 3.9 | 8 | 66.7 | 2 | 16.7 | 0 | 0.0 | 2 | 16.7 |
| No responds | 6 | 2.0 | 0 | 0.0 | 0 | 0.0 | 0 | 0.0 | 0 | 0.0 |
Source: Author’s Field Work, 2022
Figure 2 revealed the trip purpose by the respondents. From the analysis, it shows that 30.8% of trips were for educational reasons, 25.2% were for work, 5.6% were for leisure, 16.4% were for shopping, 8.2% were for commerce and trade, and 13.8% were for other purposes not listed in the questionnaire. This finding agreed with the work of Bayode (2016) and Craig et al. (2016).
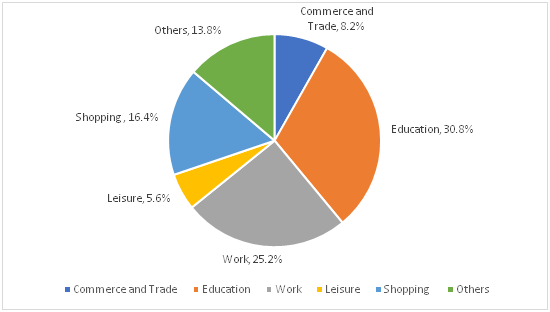
Figure 2 Trip purpose
Source: Author’s Field Work, 2022
Major Factors Determining Service Quality of PBT System in Birmingham.
The respondents’ opinions of overall satisfaction and specific service quality factors that have an impact on their satisfaction with PBT services in the city of Birmingham are statistically represented in Table 4 as a frequency distribution. The results of the investigation showed that passengers gave their opinions on the overall perceived quality of PBT services a score of 56.1% for highly agreeing, 26.6% for agreeing, 4.3% for being unsure, 6.9% for disagreeing, and 6.2% for severely disagreeing, with 56.1% being the highest. with a 3.5 mean, a 0.6 standard deviation, and a 0.4 variance. Therefore, it is easy to draw the conclusion that passengers in the city have a generally positive perception of PBT services.
Investigations were also conducted into the specific PBT service quality characteristics that influence customer satisfaction. The results show that out of thirteen variables, only one (R3) did not meet the expectation of passenger satisfaction with the PBT service in Birmingham, with a mean of 2.6, a standard deviation of 0.5, and a variance of 0.3. Meanwhile, passengers were found to be undecided on two variables (AC2 and AC3) having means values of 3.0 and 3.0, respectively.
It is obvious that PBT customers in Birmingham are happy with the level of service received from the PBT operator. This might most likely be attributable to Birmingham’s public transportation system’s efficient operators. Second, this can be the result of careful management planning, which makes sure that every day, before the passenger arrives, all necessary arrangements are made. This might enhance patronage and increase passenger confidence in the management of public transportation, both of which would increase the operators’ ability to generate income.Figure 3show the trend of the means value of the satisfaction and quality of service attributes
Table 4 Frequency Distribution of Satisfaction and Quality of Service Attributes Responses (N = 305)
| Code | Variable | SA | A | U | D | SD | mean | Std. Dev | Var | |||||
| Freq | % | Freq | % | Freq | % | Freq | % | Freq | % | |||||
| OS | Overall satisfaction with public bus transport services | 171 | 56.1 | 81 | 26.6 | 13 | 4.3 | 21 | 6.9 | 19 | 6.2 | 3.5 | 0.6 | 0.4 |
| Availability | ||||||||||||||
| A1 | The service runs when I need it | 121 | 39.7 | 106 | 34.8 | 40 | 13.1 | 23 | 7.5 | 15 | 4.9 | 3.2 | 0.5 | 0.3 |
| A2 | The buses are on time | 106 | 34.8 | 90 | 29.5 | 51 | 16.7 | 46 | 15.1 | 12 | 3.9 | 3.3 | 0.5 | 0.3 |
| A3 | Seats are generally available | 111 | 36.4 | 87 | 28.5 | 76 | 24.9 | 23 | 7.5 | 8 | 2.6 | 3.5 | 0.6 | 0.04 |
| Safety and Comfort | ||||||||||||||
| SC1 | The buses are clean | 143 | 46.9 | 155 | 50.8 | 7 | 2.3 | 0 | 0.0 | 0 | 0.0 | 3.2 | 0.5 | 0.4 |
| SC2 | The buses are comfortable | 143 | 46.9 | 145 | 47.5 | 13 | 4.3 | 4 | 1.3 | 0 | 0.0 | 3.2 | 0.5 | 0.4 |
| SC3 | I feel personally safe and secure on the bus | 121 | 39.7 | 123 | 40.3 | 32 | 10.5 | 17 | 5.6 | 12 | 3.9 | 3.2 | 0.6 | 0.4 |
| Accessibility | ||||||||||||||
| AC1 | Finding out about the routes and times is easy | 111 | 36.4 | 82 | 26.9 | 60 | 19.7 | 40 | 13.1 | 12 | 3.9 | 3.4 | 0.6 | 0.4 |
| AC2 | It is simple deciding which ticket I need | 56 | 18.4 | 34 | 11.1 | 156 | 51.1 | 27 | 8.9 | 32 | 10.5 | 3 | 0.4 | 0.2 |
| AC3 | It is easy changing from buses to other forms of transport | 45 | 14.8 | 63 | 20.7 | 123 | 40.3 | 31 | 10.2 | 43 | 14.1 | 3 | 0.5 | 0.2 |
| Affordability | ||||||||||||||
| AF | Fare is affordable | 91 | 29.8 | 89 | 29.2 | 79 | 25.9 | 12 | 3.9 | 34 | 11.1 | 3.1 | 0.5 | 0.2 |
| Reliability | ||||||||||||||
| R1 | The service is stable and is not regularly changing | 123 | 40.3 | 75 | 24.6 | 34 | 11.1 | 41 | 13.4 | 32 | 10.5 | 3.3 | 0.5 | 0.3 |
| R2 | High frequency of bus service | 57 | 18.7 | 66 | 21.6 | 101 | 33.1 | 36 | 11.8 | 45 | 14.8 | 3 | 0.6 | 0.3 |
| R3 | The service time per trip is ok | 43 | 14.1 | 33 | 10.8 | 45 | 14.8 | 109 | 35.7 | 75 | 24.6 | 2.6 | 0.5 | 0.3 |
Note: SA= Strongly Agree, A = Agree, N= Neutral, D= Disagree, SD = Strongly Disagree
Source: Author’s Field Work, 2022
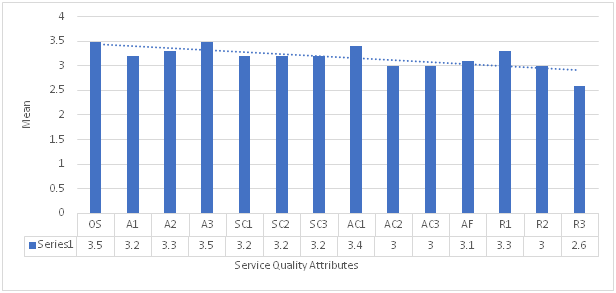
Figure 3 Frequency distribution of overall satisfaction (OS) and service quality attributes
Source: Author’s Field Work, 2022
The thirteen specific service quality attributes of PBT services were collapsed into five factors that could define broader areas for planning and action by the shareholders in the provision of PBT services in the city. Therefore, the regression analysis in Table 4 shows the factors that determined the service quality of the PBT System and explain passenger satisfaction in Birmingham. The result indicates that all the factors considered in the study determined the service quality of the PBT in the area, which scored less than a 0.05 significance value. Safety and comfort are the major factors that determined the service quality, with a p-value of 0.0012, followed by availability (p-value of 0.0042), while the weaker factors are accessibility and reliability, with p-values of 0.0421 and 0.0182, respectively. This implies that commuters are being trustworthy of consistent performing of the mode. From the findings, the results of the regression were acceptable because the R-square showed that 71.2 percent of the 305 observations fit well into the model that the regression generated, given a standard error margin of 6.250 for the five independent variables and other variables not captured. Furthermore, the analysis of variance showed that the variables were highly correlated, as the p-value for the ANOVA showed a value of and well below the 95% significance level adopted.
Table 4 Factors Determining Service Quality of PBT System that Explain Passenger Satisfaction in Birmingham.
| R² | 0.712 | |||||||||||
| Adjusted R² | 0.705 | n | 305 | |||||||||
| R | 0.844 | k | 5 | |||||||||
| Std. Error | 6.250 | Dep. Var. | Serv Quality | |||||||||
| ANOVA table | ||||||||||||
| Source | SS | df | MS | F | p-value | |||||||
| Regression | 27,666.6857 | 5 | 3,953.8124 | 101.22 | 1.00E-73 | |||||||
| Residual | 11,220.3143 | 300 | 39.0603 | |||||||||
| Total | 38,887.0000 | 305 | ||||||||||
| Regression output | confidence interval | |||||||||||
| Variables | coefficients | std. error | t (df=335) | p-value | 95% lower | 95% upper | ||||||
| Intercept | 12.8893 | 1.7620 | 6.602 | 5.66E-13 | 9.5617 | 15.5061 | ||||||
| Availability | 0.4013 | 0.1672 | 2.845 | .0042 | 0.1453 | 0.7246 | ||||||
| Affordability | 0.3237 | 0.1671 | 2.564 | .0072 | 0.1023 | 0.7456 | ||||||
| Reliability | 0.3736 | 0.1711 | 2.276 | .0182 | 0.0564 | 0.7121 | ||||||
| Accessibility) | 0.3131 | 0.2156 | 1.967 | .0421 | 0.0046 | 0.6315 | ||||||
| Safety and comfort | 0.4541 | 0.1561 | 3.191 | .0012 | 0.1677 | 0.7286 | ||||||
Source:Author’s Field Work, 2022
So, the satisfaction model of PBT services is described as followed
Overall satisfaction =12.8992+0.4841 (safety and comfort)+ 0.4149 (availability)+0.4249 (affordability) + 0.3835 (reliability)+0.3031 (accessibility) +6.250 …….. 3
The interpretation to the above equation is that the slope of the regression line is significantly greater than zero, indicating that overall satisfaction tends to increase as the five underlying factors increase. The overall satisfaction of PBT services by passengers in Birmingham will be 12.8992 percent when all 13 service quality attributes are at the zero level. Again, the standardized regression coefficient beta (β) values indicate that the underlying factor “safety and comfort” has the greatest impact on passenger overall satisfaction of public bus transport services. It is followed by “availability” (β=0.4149, ρ = 0.0045), “affordability” (β = 0.4249, ρ = 0.0083), reliability (β = 0.3835, p = 0.191) with “accessibility” having the least impact (β= 0.3061, ρ = 0.465).
The relative importance of these factors to determine the priority of quality improvements
Table 6 shows high correlation between different underlying factors; this means that all five underlying factors are dependent, which indicates that they are measuring related dimensions. The results indicate that a significant degree of interaction exists between the variables included in the analysis. Importantly, all the five (availability, affordability, reliability, accessibility and, Safety and Comfort) of the constructs identified in the analysis share strong significant correlations with each other, indicating that they are connected with the central issue of service quality. All five measures of service quality display a moderately strong significant correlation coefficient with perceived satisfaction (rs: 0.635; 0.567; 0.576; 0.675), showing that service quality as evaluated represents a useful indicator of customer satisfaction. The results of the analysis appear to share similarities with the findings of Craig et al. (2016).
Table 6 Factor Correlation analysis between service quality and perceived satisfaction
| Variable | 1 | 2 | 3 | 4 | 5 |
| Service quality: Availability (1) | 1.000 | 0.635** | 0.615** | 0.717** | 0.654** |
| Service quality: Affordability (2) | 0.635** | 1.000 | 0.634** | 0.721** | 0.567** |
| Service quality: Reliability (3) | 0.615** | 0.634** | 1.000 | 0.675** | 0.576** |
| Service quality: Accessibility (4) | 0.717** | 0.721** | 0.675** | 1.000 | 0.675** |
| Service quality: Safety and Comfort (5) | 0.654** | 0.567** | 0.576** | 0.675** | 1.000 |
**: p-value < 0.01
Source: Author’s Field Work, 2022
SUMMARY
Based on the analysis and discussion of the results carried out, several findings were identified. The study established that passengers of PBT are satisfied with the services provided by public bus transport operator (national express) in Birmingham. The result established that all the factors considered in the study determined the service quality of the PBT, which scored less than a 0.05 significance value. The results indicate that a significant degree of interaction exists between the variables included in the analysis. Importantly, all the five (availability, affordability, reliability, accessibility and, Safety and Comfort) of the constructs identified in the analysis share strong significant correlations with each other, indicating that they are connected with the central issue of service quality.
CONCLUSION
It is important to established that the study indicated that customers are satisfied with service quality delivery by public bus transport operated by national express. The finding of the study show that all the factors tested contributed significate to service quality of the PBT. The study also established that there are many challenges confronting the smooth operation of the sectors. The following recommendations were made in light of the study’s findings since National Express was found to have excellent customer satisfaction. This should be fostered in order to improve organizational performance and gain a competitive edge. To enable access to education, career opportunities, health care, and recreational activities, the public bus service in Birmingham should be encouraged to promote effective movement of people on its route. Finally, in order to shorten travel times, some lengthier routes ought to be split into two.
REFERENCE
- Adeniran, A. O., & Fadare, S. O. (2018). Assessment of Passengers’ Satisfaction and Service Quality in Murtala Muhammed Airport (MMA2), Lagos, Nigeria: Application of SERVQUAL Model. doi:10.4172/2169-0286.1000188
- Aderamo, A. I. (2010). Transport in Nigeria: The case of Kwara State. (Vol. 8). African Economic and Business Review.
- Akeem , T. N., Olanrewaju, M. H., & Unekwu , C. A. (2018). Public Transport Service and Passengers’ Satisfaction in Kogi State: An Empirical Investigation. Journal of Economic Insights, 7(12), 57 -71.
- Ali, A. N. (2010). An Assessment of the Quality of Intra-Urban Bus Services in the City of Enugu. a Paper Presented at the Empirical Research in Urban Management, 6. Enugu.
- Arthur, C. M., Joaquim, J. G., Yaeko, Y., Romulo, D. O., & Anisio, B. D. (2014). Analysis the fiscal sustainability of transit investment projects . Research in Transportation Economics, 422- 428.
- Aziz, A., & Mohamad, J. (2013). Urban Public Transport in Penang : Some Policy Considerations. Eastern Asia Society for Transportation Studies Conference, 9, pp. 1 – 19.
- Charles , A., & Tina, D. W. (2021). Indicators for commuter’s satisfaction and usage of high occupancy public bus transport service in Ghana. Journal of Transportation Research interdisciplinary Perspectives, 11.
- Craig, M., Brian, C., & Jillian , A. (2016). Customer perceptions of quality of service in public transport: Evidence for bus transit in Scotland. ELSEVIER, 4(3), 199 – 207.
- Enoch, F. S., Osmanu, H., & Stijn, D. (2018). SERVQUAL analysis of public bus transport services in Kumasi metropolis, Ghana: Core user perspectives. ELSEVIER, 6(1), 25 – 31.
- Friman, M. B., Edvardsso, B., & Garling, T. (2011). Frequency of negative critical incidents and satisfaction with public transport services. Journal of Retailing and Customer Services, 8(2), 70 – 85.
- Olagunju, K. (2011). Road Sense. Veragap Nig. Ltd.
- Robbines, E. S., & Johnson, S. W. (2016). Service quality and satisfication level of metro Transportation. Journal of Social Science, 2(4), 23 – 34.
- Sakdirat , K., Jessada, S., & Haoran, S. (2021). Causal analysis of Bus travel reliability in Birmingham, UK. ELSEVIER.
- Thomas , Y. T. (2018). Path analysis of traffic congestion in developed nation. Journal of management Science, 3(5), 23- 41.
- Too, L., & Earl, G. (2010). Public transport service quality and sustainable development: a community stakeholder perspect. Sustainable Development, 18(1), 51 – 61.