
The Levels and Determinants of Profit Efficiency in Fodder Production: A Case of Southern Rangelands of Kenya
- Manyeki John Kibara
- Kuria Simon
- Rono Julius
- Mulei Benson
- 2405-2414
- Apr 19, 2024
- Agriculture
The Levels and Determinants of Profit Efficiency in Fodder Production: A Case of Southern Rangelands of Kenya
Manyeki John Kibara1*, Kuria Simon1, Rono Julius2, and Mulei Benson1
1Kenya Agricultural and Livestock Research Organization, Kiboko, P.O. Box 12-90138, Makindu, Kenya
2SNV Netherlands Development Organization, P.O. Box 30776, Ngong Ln off Ngong Road, Nairobi, Kenya
*Corresponding Author
DOI: https://dx.doi.org/10.47772/IJRISS.2024.803168
Received: 12 March 2024; Accepted: 18 March 2024; Published: 19 April 2024
ABSTRACT
This study examines the profit efficiency and the responsible factors for inefficiency in the selected forage production in selected areas of Kenya by using the maximum likelihood stochastic profit frontier function. This study proves that forage production is profitable with an average profit efficiency being 76.22% and 86.57% for the entire sampled population for grasses and leguminous crops, respectively. The result of the coefficients reveals some variability, which confirms that the firms in the sample have different profit frontiers. For coefficients that are significant but heavily negative in terms of magnitude is a clear indication that such variables would result in a high decrease in return to scare with respect to profit margin and vice versa. The policy implication in forage production based on these findings is that profit inefficiency can be reduced significantly by improving the cost of land preparation, land harrowing, cost of planting materials, and weed management, although other costs evaluated are also relevant.
Keywords: Stochastic profit frontier function, profit efficiency, Biomass, Forages, Kenya
INTRODUCTION
As a Sub-Saharan African country, the economy of Kenya is strongly influenced by agriculture (represented by crops, livestock, and fisheries). The livestock sector represents an important production activity providing about 88% of employment, yet the sector accounts for about 42% of the country’s agricultural GDP (Manyeki et al., 2019). Livestock farming has been estimated to be present in more than 75% of the smallholdings in Kenya (Salami, et al., 2010), and pastoralists dominate with 80% of the country’s livestock. Despite raising livestock being the dominant economic activity among pastoralists who reside in the rangelands of Kenya, its production trends have been decreasing, resulting in a low contribution to the agricultural GDP that can be rooted in the challenges associated with the nutritive value of the common forage species (Maweu et al., 2023; Manyeki et al., 2023). The solution to improve the nutritive content can be sought from the wide array of forage genetic materials that are available internationally. Through the national and development partners’ efforts, a large number of smallholder farmers in Kenya have been exposed to different fodder crops, but only 55% of the farmers cultivate at least one type of fodder in their farms (SNV, 2013). This paper contributes to the limited information available on fodder profit efficiency measurement that could inspire smallholder livestock producers and communities to shift towards more sustainable fodder-livestock production systems.
In any agricultural-related enterprise, profit efficiency estimation establishes a vital information source intended for the economic agent and policymakers than other efficiency measures. Therefore, the profit efficiency of fodder production at the household level has significant implications for the type of development strategies to be adopted in Kenyan rangelands where the primary livestock sector still dominates. Understanding profit efficiency levels and their association determinants can greatly help pastoralists and policymakers in formulating efficiency-enhancing policies in fodder production. So, what is profit efficiency, and how can it be measured so that farmers and policymakers can gain insights and make effective plans for the betterment of fodder production as a commercial enterprise?
In an attempt to assess fodder profit (in)efficiency and its associated influencers, three approaches can be utilized namely technical, allocative, and scale. Technical efficiency reflects the effectiveness with which a given set of inputs is used to produce output, while allocative efficiency reflects how different resource inputs are combined to produce a mix of different outputs, given their respective prices (Manyeki, 2020). In the case of profit-maximizing, a farm can be scale efficiency if its yield level is not paralleling the output price with the marginal cost. However, when farmers find different prices for various aspects of the fodder products as was the case under pastoral conditions then the production function model of quantity efficiency is not suitable and this directed the use of stochastic profit function to appraisal farm-specific characteristics deviation from efficiency levels. As indicated by Chen et al. (2015), it is rare for a farm/firm to be top of the list of all possible measures of performance. In this case, therefore, identifying the smallholder fodder-producing performance frontier across the relevant measures is an important task that is infrequently performed. Thus, this forms the premise of the present study that attempts to reveal the profit efficiency of fodder production by identifying farm-specific features that explain deviation in efficiency while assuming homogenous technology across all farms. This is because it is important to know the efficiency score and the determinants responsible for fodder production as they are a major component in increasing the poor smallholder farmers’ farm incomes and will ensure food security.
MATERIALS AND METHODS
Study Area and Data Collection
The study sites are the counties of Kajiado, Narok, and Taita Taveta where Kenya Agricultural and Livestock Research Organization (KARLO) in partnership with Netherlands Development Organization agencies (SNV) instituted research programs entitled Integrated and Climate Smart Innovations for Agro-Pastoralist Economies and Landscapes Kenya’s ASAL (in short ICSIAPL) which run for three (3) years starting from 1st January 2021–31st December 2023. The ICSIAPL project aimed at improving the livelihoods of agro-pastoralist communities through the promotion of improved forage production and livestock husbandry, building on the commercialization of climate-smart innovations and sustainable landscape management. Due to the massive challenges of climate change experienced in these areas, there was an urgency to use a wide array of appropriate genetic material and therefore twenty (20) crops were identified and promoted. The fodder crops varieties promoted in the lowland region were Brachiaria variety camelo, Panicum Maximum variety Massai, and Nutrifeed (Pennisetum glaucum hybrid), and two legumes including Cowpea (Vigna unguiculata), and Dolichos lab lab (Lablab purpureus). Four grasses (Brachiaria var. cayman and cobra, Chloris gayana var. Ex-Tozi, and Panicum var. siambasa) and five legumes namely Desmodium (Desmodium intortum), Purple vetch (Vicia benghalensis), Lupin (Lupin albus), Velvet bean (Mucuna pruriens) and Sweet potato vines var. Ex-Mukurweini (Ipomea batattas) were established in the highlands regions. In addition, four grasses namely Boma Rhodes (Chloris gayana), Bushrye (Enterepogon macrostachyus), African foxtail (Cenchrus ciliaris), and Sugargraze (Sorghum bicolor), and two legumes including Sunn hemp (crotalaria juncea) and Lucerne (Medicago sativa)) were promoted in both regions.
In estimating the profit efficiency for fodder production, there is a need to assign an economic value to important traits of consideration. Several important traits of fodder production such as Seasonal DM yield, Quality, Silage DM yield, and Persistency are recommended for consideration (McEvoy et al., 2014). In this study, we opted for seasonal DM yield as the important trait that would influence profitability at the farm level. For this study, the DM yield sampling was done from a total of 60 demo plots that were established in the three counties. The direct benefits of the improved pastures through reseeding were estimated as the numbers of 15 kg hay bales. The techniques used for valuing input are the cost of land preparation including land ploughing, harrowing, and farrow opening; cost of labour for seed planting which is the wage rate of hired labour (in man-days); weed and forage management expressed in the wage rate of hired labour and cost of herbicides; cost of planting materials (seeds). On the outputs side, the total revenue was estimated using the market price of a 15-kilogram hay bale. The valuation of both the inputs and outputs was estimated using the prevailing market for the year 2023.
Stochastic Profit Efficient Model
The concept of stochastic profit frontier measures the distance between the current profit of a farm and the efficient profit frontier and encompasses errors on the input side as well as on the output side. The literature distinguishes between standard profit efficiency and alternative profit efficiency depending on whether the hypothesis of perfect competition in the markets of inputs and outputs is assumed or not. Standard profit efficiency measures how close a farm is to operating at its maximum profit given a price level for inputs and a price level for outputs, assuming perfect competition in these markets. This means that a firm takes as given the prices of inputs and outputs and maximizes its profit by varying its quantities. The general profit efficiency estimation function can be expressed as
π=(p,w) exp (vπ )exp(-uπ), (1)
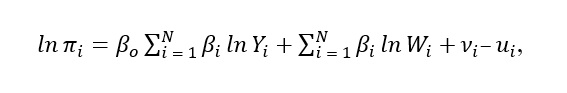
where is the profit variable, is the price vector of the variable outputs (in this case the market price of the 15 kg bale of fodder), is the cost price vector of the variable inputs. The inputs considered were converted into natural logarithms and included the cost price of land ploughing (LogLP), the cost price of land harrowing (LogLH), the cost price of furrow opening (LogFO), the cost price of labour for planting (logPla), the cost price of planting materials (LogPM), and cost price of labour for weed management (LogWM). Term presents the inefficiencies that reduce profit and represents random error. However, under pastoral and agropastoral setups, the assumption of perfect competition is not applicable in many farming situations, as farmers can exercise some discretionally market power in setting the price of outputs. Therefore, the alternative profit efficiency that measures how close the farmer is operating to its maximum profit given its level of output was found to be appropriate. In this case, the alternative profit efficiency that takes the quantity of output as given and the price of the outputs is allowed to vary freely and affect the profit of the farmer is specified as follows:
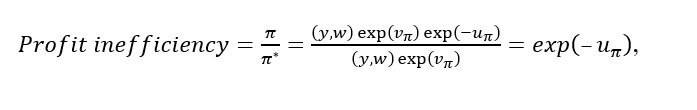
π=(y,w) exp(vπ )exp(-uπ), (2)
where the variables are as defined in (1) and is the vector of quantities of the variable outputs. Based on equation (2), the alternative profit efficiency of the farmer is defined as the ratio between the current profit and the maximum profit that the farmer could achieve if it were perfectly efficient ( . Although the basic assumption from the Resource-based view is the heterogeneity of resources between farms, from the experimental point of view, we consider that all the farm sites within the zones of highland and lowland share the same resources and technology; that is to say, they were homogeneous.
The next step involves the determination of the functional form of the stochastic frontier. One of the requirements for estimating the stochastic frontier is to specify its functional form. In this case, the common assumption was that farmers are employing the same technologies, then the traditional frontier models proposed jointly by Aigner et al (1977) and Meeusen and Van der Broeck (1977) with a Cobb-Douglas logarithmic stochastic frontier model (Kibara and Kotosz 2022), was found appropriate and was specified as:
 (3)
(3)
where is the observed scalar variable output of farmer i, and Wij is a vector of J inputs used by farmer i. In a traditional stochastic profit frontier modeling, profit-oriented inefficiency is calculated as a ratio of the observed profit to the corresponding optimal frontier profit, given the available technology.
 (4)
(4)
Here is the observed profit and presents the frontier output.
RESULTS AND DISCUSSION
Our interest was to analyze the levels and factor input that influence profit efficiencies in fodder production under the rangelands condition that would give insight into the policy recommendations. In the case of cross‐sectional data, the stochastic profit frontier model proposed can only be estimated if the inefficiency effect components, are stochastic and have particular distributional properties (Battese and Coelli, 1995). In the present study, we assumed a half-normal distribution. Since the form of the model is stochastic, then it can usually be estimated by maximum likelihood (ML) and the common practice under this scenario is to maximize the log-likelihood models. The systems of stochastic profit frontier models are estimated and presented with the parametric imposition of maximum likelihood.
Factors Responsible For (In)Efficiency For Selected Grasses Species
Table 1 shows the maximum likelihood estimates for parameters of the maximum-likelihood stochastic Cobb-Douglas logarithmic profit function. The table shows separate models for sugar graze, Nutrifeed, Camelo, Bush rye, and Foxtail for the lowland producers. Overall the empirical results are robust in the sense that the estimates for the majority of factors inputs employed across the profit frontier were significant at recommended 1%, 5%, or 10% levels, implying that differentiated patterns in input importance can be observed. Of important to note is the direction of the effect and the magnitude. The positive signs and negative signs indicate that the variable will reduce or increase profit efficiency, respectively. This suggests that the profit function is either downward-sloping with respect to negative signs or upward-sloping with respect to positive signs. For those variables that are significant but heavily negative in terms of magnitude is a clear indication that such variables would result in a high decrease in return to scare with respect to profit margin and vice versa. With regards to variables that influence profit efficiency in the lowlands of Kenya, land ploughing (logLP), land harrowing (logLH), land planting (logPla), Planting materials (logPM), and weed management (LogWM) are the most important factors to consider across all the selected fodder varieties. Similar studies applying stochastic frontier analysis concurred with the study findings where land size, the quantity of planting materials, labour for planting, and labor for weeding influenced the level of technical efficiency in fodder crops and pastures production (e.g. Qu et al., 2015; Ayuko et al., 2023). The policy implication concerning some of these variables such as the cost of the planting materials is that with a 10% increase in the price of seeds, the profit margin obtained from the grass fodder production will significantly reduce by 5.198%, 14.439%. 5.169%, 1.59%, and 0.0914% for the Sugar graze, Nutrifeed, Camelo, Bush rye, and Foxtail, respectively. The contrary argument applies to the positive case. Bush rye seems to top the list with respect to input variables such as land furrow opening (LogFO), although caution should be taken when forming a decision on whether to incur such cost, otherwise the status quo can be maintained.
Table 1 also presents the levels of profit scores for grasses that were promoted. As indicated in the table, the average profit efficiency score for the lowland grasses ranges from 0.6116 to 0.8046 which implies that fodder-producing farmers in this region can hike their profit by between 19.54% and 38.84% by effectively promoting the factors of profit inefficiency. These results mirror the findings in the research by Manyeki et al. (2023). Further, the result can also be compared with the findings in the study done by Rahman (2003) among the rice-producing farmers in Bangladesh even if the products are different as is the case in this study.
| Table 1:Stochastic profit frontier parameter estimation for the Lowlands Grasses | |||||
| Grass species | Sugar graze | Nutrifeed | Camelo | Bush rye | Foxtail |
| logLP | -0.5198*** (0.6824) | -1.4439*** (0.5796) | -0.5169***
(0.0001) |
-0.1590** (0.0092) | -0.0914* (0.1236) |
| logLH | -0.1404* (0.7001) | -0.9829*** (0.5483) | -0.3994*** (0.00005) | -0.1355*
(0.0013) |
-0.1046** (0.0984) |
| logFO | -0.1807**
(0.2919) |
-0.7414*** (0.2698) | 1.2534* (0.0002) | -4.4244***
(0.0326) |
-0.0375 (0.1469) |
| logPla | -0.1991**
(0.3851) |
-0.2177* (0.3211) | -3.1709*** (0.0012) | -0.7990*** (0.0099) | -0.0646* (0.2064) |
| logPM | -1.1497***
(0.5197) |
-0.5059** (0.5042) | 0.4675*** (0.0018) | 0.5574***
(0.0132) |
-0.0336* (0.5252) |
| LogWM | -0.8804**
(0.5026) |
-0.5532** (0.4179) | -0.2957** (0.00003) | -0.2955**
(0.0037) |
-0.0427*
(0.0348) |
| _cons | 16.964*
(10.536) |
-11.668 (7.9527) | -18.946*** (0.0113) | 35.5852
(0.1524) |
11.5856 (5.1220) |
| Inefficiency score (IS) | 0.3884 | 0.2018 | 0.1954 | 0.2757 | 0.2278 |
| Efficiency =1-IS | 0.6116 | 0.7982 | 0.8046 | 0.7243 | 0.7722 |
| Note: Note: ***, ** and * == > significance at the 1%, 5% and 10%
Sources: Authors own computation using experimental data |
|||||
Table 2 shows the stochastic profit frontier estimates scenario for the grasses that were selected for the highland regions. Similarly, the variables seem to be robust in their effect on profit efficiency in the sense that most of them are significant at either 1%, 5%, or 10% levels. Their effect seems to be fairly high in terms of magnitude as compared to the findings among the grasses that were promoted in the lowland regions. This is reflected by a relatively high-profit efficiency score that ranges from 0.7277 to 0.9875 except for the Bracharia var. Cayman which was very low (0.5368). This can be attributed to the fodder crop varieties promoted and the amount of rainfall received in the region translating to the DM biomass harvested vis-à-vis the input quantity. During the period of study, the highlands of Kenya experienced relatively more rain and this translated to high biomass.
Similarly, the input variables such as land size, the quantity of planting materials, labour for planting, and labor for weeding influenced the level of profit efficiency in grass production concurring with Ayuko et al. (2023) findings. However, as rains are not a limiting factor in the highlands of Kenya, the study can recommend the need for farmers to increase land allocation for fodder, increase planting materials, and the number of man days during planting and weeding to increase fodder output that would translate to higher profit
| Table 2: Stochastic Profit Frontier Parameter Estimation For The Highlands Grasses | |||||||
| Grass species | Sugar graze | Camelo | Bush rye | Cayman | Boma Rhodes | Cobra | PaMa |
| LogLP | -0.9322***
(0.0009) |
-0.8774***
(0.00003) |
0.2015*
(0.6506) |
-0.1066*** (0.0001) | 0.1466***
(0.0118) |
0.3009*
(0.2891) |
0.3998*
(0.2481) |
| LogLH | -0.7567***
(0.0006) |
-0.0379*
(0.00001) |
0.0284
(0.2085) |
0.1256***
(0.0002) |
-0.1812***
(0.0011) |
-0.0224
(0.2001) |
0.0653
(0.0910) |
| LogLF | 0.0795
(0.0002) |
0.8042*** (0.00008) | 0.0798
(0.8613) |
-0.2161***
(0.0003) |
0.6468***
0.0079) |
-0.3330**
(0.4711) |
0.6137**
(0.3607) |
| LogPla | -0.61428**
(0.0003) |
0.0390
(0.00005) |
-1.0061**
(0.5536) |
0.0361 (0.0001) | 0.0215
(0.0059) |
1.4097***
(0.4839) |
-0.1828
(0.2233) |
| LogPGs | 0.2703*
(0.0004) |
1.7162*** (0.0007) | 1.3455***
(1.1016) |
0.4458***
(0.0005) |
0.4627***
(0.0122) |
0.8682***
(0.2693) |
1.2415*** (0.6419) |
| LogWM | 1.5015***
(0.0008) |
0.0996*
(0.00003) |
-0.2436*
(0.1722) |
0.1725*** (0.00003) | 0.2384
(0.0012) |
-0.4112** (0.2802) | 0.0498*
(0.0670) |
| _cons | 16.51355** (0.0034) | -5.341***
(0.0042) |
6.6506 13.4726 | 7.7743***
(0.0071) |
1.1356*
(0.0001) |
-4.1125***
(0.0034) |
-6.7630
(7.2215) |
| Average Inefficiency score (IS) | 0.2723 | 0.1844 | 0.1959 | 0.4632 | 0.0125 | 0.0800 | 0.1369 |
| Efficiency =1-IS | 0.7277 | 0.8156 | 0.8044 | 0.5368 | 0.9875 | 0.9200 | 0.8631 |
| Note: Note: ***, ** and * == > significance at the 1%, 5% and 10%
Sources: Authors own computation using experimental data |
|||||||
Factors Responsible For (In)Efficiency For Selected Legume Species
Leguminous fodder crops were also promoted to enrich the protein content in a grass-legume mixed swards livestock production system. The inclusion of legume crops in the ICSIAPL project can be justified by Kebede et al. (2016) research where grass integration with legumes was found to result generally in a higher protein-rich and lower fiber content yield than in the grass only. The parameter estimation of the maximum-likelihood stochastic profit function for the legume varieties promoted in the lowland and highland regions are presented in Tables 3 and 4, respectively. Generally, in the two tables, the results seem to be robust in their effect on profit efficiency in the sense that most of them are significant at either 1%, 5%, or 10%. Comparably, the coefficients for fodder crops promoted in the two regions are generally not or only weakly significant, except for the response associated with Dolichos lablab biomass yield with respect to the cost of weed management and Lucerne biomass with respect to the cost of planting materials. Irrespective of the signs, the profit efficiency of the legume crops promoted in the two regions appears to be more responsive to the cost of land harrowing (LogLH) and cost of weed management (LogWM), except for legume crops that were promoted in the highland region that were more responsive to the cost of land preparation (logLP). To some extent, this finding can be compared to the Sibiko et al. (2013) and Saleh, et al (2016) studies where farmers were relatively efficient in the use of the production resources and technology at their disposal, with seed cost being among the most significant resources which affect the efficiency of the cereal legume production.
Regarding the profit efficiency scores, overall, the legumes that were promoted in the highland regions recorded high scores (ranging between 0.8473 to 0.9999) as compared to those that were promoted in the lowland areas (ranging between 0.7315 to 0.8478) which could perhaps be attributed to higher rainfall experienced in this region during the time of the study. This implies that the effect that results in high inefficiency in the legume production in the lowland region needs to be reduced to the bare minimum if the farmers’ target is a high-profit margin.
| Table 3: Stochastic Profit Frontier Parameter Estimation For The Lowland Legumes | ||||
| Legume species | Dolichos lablab | Cowpea | Sunn hemp | Lucerne |
| LogLP | 0.2541***
(0.0032) |
-0.0076
(0.1539) |
-0.0089 (0.1259) | 0.0164* (0.0004) |
| LogLH | 0.2250***
(0.0023) |
0.1046** (0.1956) | 0.1073** (0.0952) | 0.1369** (0.0012) |
| logLF | 0.1321*
(0.0011) |
0.0487 (0.2063) | -0.0100 (0.1031) | 0.2909***
(0.0015) |
| LogPla | 0.1906**
(0.0043) |
0.1016** (0.1886) | -0.0347 (0.0382) | -0.0661**
(0.0010) |
| LogPM | 0.1314*
(0.0029) |
0.0519
(0.1325) |
0.1274*** (0.0875) | 0.7186***
(0.0021) |
| LogWM | 1.9246***
(0.0000) |
-0.1108**
(0.1078) |
-0.0556* (0.0798) | 0.0795**
(0.0007) |
| _cons | 24.0543*** (0.0802) | 12.316***
(2.8458) |
14.042*** (1.9910) | 14.5513***
(0.5843) |
| Average Inefficiency score (IS) | 0.1588 | 0.2685 | 0.1522 | 0.2552 |
| Efficiency =1-IS | 0.8412 | 0.7315 | 0.8478 | 0.7448 |
Note: Note: ***, ** and * == > significance at the 1%, 5% and 10%
Sources: Authors own computation using experimental data
| Table 4: Stochastic Profit Frontier Parameter Estimation For The Highland Legumes | ||||||
| Legume species | Sunn hemp1 | Lucerne2 | Purple vetch3 | Velvet beans4 | Sweet potato vines5 | Greenleaf Desmodium6 |
| LogLP | 0.2088*
(0.1295) |
-.2368**
(0.0051) |
-0.5979**
(0.3089) |
0.3769***
(0.0001) |
0.4039***
(0.0051) |
0.8369***
(0.00004) |
| LogLH | -0.0859*
(0.0509) |
-0.0717*
(0.0048) |
0.1049**
(0.0549) |
0.1298*
(0.00001) |
-0.7751*** (0.0043) | -0.4498**
(0.00003) |
| LogLF | -0.4101** (0.1902) | -0.7543***
(0.0263) |
-0.2570*
(0.1774) |
-0.0439** (0.00002) | -0.1140*
(0.0054) |
-0.2903
(0.00004) |
| LogPla | 0.1224 (0.1319) | -0.0583
(0.0025) |
0.2464***
(0.0890) |
0.8339*** (0.0001) | 4.2128***
(0.0086) |
-2.3085***
(0.00009) |
| LogPGs | 0.0079
(0.3793) |
-6.5436*** (0.0273) | -0.0214
(0.0695) |
-2.2846***
(0.00008) |
3.9232***
(0.0077) |
0.4900**
(0.00002) |
| LogWM | 1.5316* (1.2716) | -0.9865***
(0.0507) |
2.4437*** (0.3674) | 4.6820***
(0.0003) |
-20.741***
(0.0002) |
-7.229*** (0.0003) |
| _cons | 1.4163 (10.3383) | 90.7418
(0.0056) |
-1.831181
(0.0512) |
-11.889***
(0.0019) |
107.3757
(0.0035) |
80.827*** (0.0026) |
| Average Inefficiency score (IS) | 0.0225 | 0.0641 | 0.1572 | 0.0634 | 0.0001 | 0.0074 |
| Efficiency =1-IS | 0.9775 | 0.9359 | 0.8473 | 0.9366 | 0.9999 | 0.9926 |
Note: Note: ***, ** and * == > significance at the 1%, 5% and 10%; [1] Crotalaria juncea, 2Medicago Sativa, 3Vicia Benghalensis, 4Mucuna Pruiens, 5Ipomoea Batattas var. Ex-Mukruweini, 6Desmodium intortum
Sources: Authors own computation using experimental data
CONCLUSION AND RECOMMENDATION
The study employed a stochastic profit frontier formulation to analyze the profit efficiency of sampled fodder-producing farmers in the counties of Kajiado, Narok, and Taita Taveta of Kenya. Using detailed sampled data obtained from the 60 fodder-producing beneficiaries under the ICSIAPL project, the study showed that profit efficiency varied moderately among the sampled farmers. It ranged from 53.68 % to 98.75% and 73.15% to 99.99% with an overall mean of 76.22% and 86.57% for the entire sampled population for grasses and leguminous crops, respectively. The overall mean level of efficiency indicates that there exists some room to increase profit by effectively improving the resource allocative efficiency. However, the coefficients reveal some variability, which confirms that the farmers in the sample have different profit frontiers, hence heterogeneity investigation is proposed as a future research endeavor. The policy implication in fodder production based on these findings is that profit inefficiency can be reduced significantly by reducing the cost of land preparation, land harrowing, fodder planting materials, and weed management, although other costs evaluated are also relevant.
ACKNOWLEDGMENTS
The authors acknowledge all government institutions and farmers who either directly or indirectly contributed to the successful completion of this activity in the counties of Kajiado, Narok, and Taita Taveta. We appreciate the European Union through the Embassy of the Kingdom of the Netherlands and SNV Netherlands Development Agencies. Special thanks also go to the KALRO Director General and SNV Project Manager for the logistic support. Finally, we acknowledge the Institute Director and KALRO staff for their tireless support both technically and morally.
REFERENCES
- Aigner, D., Lovell, C. K., & Schmidt, P. (1977). Formulation and estimation of stochastic frontier production function models. Journal of Econometrics, 6(1), 21-37.
- Ayuko, M. S., Lagat, J. K., & Huaser, M. (2023). The Level and Determinants of Technical Efficiency in Fodder Production in Homa Bay County, Kenya. Open Access Library Journal, 10(1), 1-15.
- Battese, G. E., & Coelli, T. J. (1995). A model for technical inefficiency effects in a stochastic frontier production function for panel data. Empirical economics, 20, 325-332.
- Chen, C. M., Delmas, M. A., & Lieberman, M. B. (2015). Production frontier methodologies and efficiency as a performance measure in strategic management research. Strategic Management Journal, 36(1), 19–36
- Kebede, G., Assefa, G., Feyissa, F., & Mengistu, A. (2016). Forage legumes in crop-livestock mixed farming systems: A review. International Journal of Livestock Research, 6(4), 1-18.
- Kibara, M. J., & Kotosz, B. (2022). Are livestock farmers in Kenya efficient? Evidence from a farm-level analysis. SN Business & Economics, 2(9), 131.
- Manyeki, J. K. (2020). Microeconometric models of the livestock sector: A farm-level analysis of Southern rangelands of Kenya (Doctoral dissertation, szte). http://doktori.bibl.u-szeged.hu/10521/2/John%20Kibara%20Manyeki_PhD%20Thesis%20Book_Public%20Defence_05_03_2020.pdf. https://doi.org/10.14232/phd.10521.
- Manyeki, J. K., & Kotosz, B. (2019). Efficiency estimation and its role in policy recommendations: an application to the Kenyan livestock sector. Regional Science Policy & Practice, 11(2), 367-381.
- Manyeki, J. K., Kuria, S., Kidake, B., Maweu, A., & Mulei B. (2023). Fodder Farming in The Arid and Semi-Arid Lands of Kenya: A Potential Profitable Venture. IOSR Journal of Economics and Finance (IOSR-JEF), 14(3), 18-24.
- Maweu, A. N., Korir, B. K., Kuria, S. G., Ogillo, B. P., Kisambo, B. K., Wambulwa, L. M., Kubasu, D. O., Musyimi, D. M., Manyeki, J. K., & Chege, P. W. (2023). Promoting improved forages for increased livestock productivity in the Arid and Semi-Arid Lands (ASALs) of Kenya. A case of Kajiado, Narok and Taita Taveta county. International Journal Veterinary Sciences and Animal Husbandry, 8(2), 93-101.
- McEvoy, M., McHugh, N., O’Donovan, M., Grogan, D., & Shalloo, L. (2014). Pasture profit index: updated economic values and inclusion of persistency. In EGF at 50: The future of European grasslands. Proceedings of the 25th General Meeting of the European Grassland Federation, Aberystwyth, Wales, 7-11 September 2014(pp. 843-845). IBERS, Aberystwyth University.
- Meeusen, W., & van Den Broeck, J. (1977). Efficiency estimation from Cobb-Douglas production functions with composed error. International economic review, 435-444.
- Qu, Y., Yu, C., Sun, W., Wu, J., & Li, S. (2015). Use of the stochastic frontier production function in a technical efficiency analysis of grass production: an example from the” One River and Two Tributaries” region of Tibet. Acta Prataculturae Sinica, 24(10), 70-79.
- Rahman, S. (2003). Profit efficiency among Bangladeshi rice farmers. Food policy, 28(5-6), 487-503.
- Salami, A., Kamara, A. B., & Brixiova, Z. (2010). Smallholder agriculture in East Africa: Trends, constraints, and opportunities (p. 52). Tunis, Tunisia: African Development Bank.
- Saleh, P., Tiku, N. E., & Galadima, M. (2016). Efficiency analysis of cereal-legume-based cropping system in Kachia and Kagarko local government areas of Kaduna State. Gashua Journal of Irrigation and Desertification Studies (2016), Vol. 2. No. 2 ISSN: 2489 – 0030
- Sibiko, K. W., Owuor, G., Birachi, E., Gido, E. O., Ayuya, O. I., & Mwangi, J. K. (2013). Analysis of determinants of productivity and technical efficiency among smallholder common bean farmers in eastern Uganda. Current Research Journal of Economic Theory, 5(3), 44-55.
- SNV (2013). Study on the Kenyan Animal Feed and Fodder Sub-Sectors; Kenya Feed Industry Policy and Regulatory Issues.