
The Strategy of Romokalisari Adventure Land as a Sustainable Tourism Destination Using The Business Model Canvas (BMC) Approach
- Sunarti
- 2441-2468
- May 21, 2024
- Agriculture
The Strategy of Romokalisari Adventure Land as a Sustainable Tourism Destination Using the Business Model Canvas (BMC) Approach
Sunarti
Faculty of Administarative Science, Brawijaya University
DOI: https://dx.doi.org/10.47772/IJRISS.2024.804158
Received: 09 April 2024; Accepted: 22 April 2024; Published: 21 May 2024
ABSTRACT
Planning is the initial stage for analyzing conditions of uncertainty and then developing appropriate strategies. The Business Model Canvas in this research is used to plan tourist destinations. Based on this, the research conducted by researchers was entitled “Strategy Formulation of Romokalisari Adventure Land as a Sustainable Tourism Destination Using a Business Model (BMC) Approach”. This research is descriptive research with a qualitative approach. Interviews were conducted with the manager of the Romokalisari Adventure Land tourist destination to obtain data regarding the nine building blocks of BMC and internal and external conditions. . Determining the strategy for the Romokalisari Adventure Land Tourism Destination was carried out through several stages. The input stage is carried out by dividing internal and external factors into the IFE Matrix and EFE Matrix to give a score assessment for each factor’s strengths, weaknesses, opportunities and threats. The next stage is the matching stage or matching internal and external factors using the SWOT Matrix and Internal-External Matrix to determine the strategy. The resulting strategy will be selected using the Quantitative Strategic Planning Matrix (QSPM) at the decision stage and then an analysis will be carried out on the selected strategy. The next step is to add a strategy to the BMC Romokalisari Adventure Land Tourism Destination.
Keywords: Business Model Canvas (BMC), Determination Strategy, SWOT, IE Matrix, QSPM
INTRODUCTION
Tourism is one of the economic activities that opens up large employment opportunities in Indonesia (Damanik et al., 2022). From a macroeconomic perspective, tourism provides a contribution in the form of increasing national income and increasing investment in the tourism industry (Damanik et al., 2022). Therefore, the Department of Culture, Youth and Sports and Tourism (Disbudporapar) of the City of Surabaya strives to always promote and develop Indonesian tourism by encouraging visitors and investors to come to the City of Surabaya.
Tourism offerings relate to the provision of key elements of the tourism industry by the government or business actors of the host or tourist destination area (DTW). Creating the concept of sport tourism is one of the tourism development initiatives implemented by the Surabaya City Government to increase the number of visitors coming to the City of Surabaya (iNewsSurabaya.id, 2022). Sport tourism is a tourism activity that includes sports activities both actively and passively (Coates, 2021). Sport tourism in its implementation.
On September 25 2022, the Surabaya City Government just inaugurated a sports tourism destination called Romokalisari Adventure Land (One Stop Investment & Integrated Services Service, 2022). This destination has many rides that support sport tourism activities such as horse riding arenas, canoes and lifeboats in the mangroves, ATVs and jet skis (DPM & PTSP, 2022). Apart from sports tourism rides, this destination also has other rides such as a playground and a small zoo. Romokalisari Adventure Land is located on Jl. Romokalisari I, District. It is hoped that Benowo can develop into a sports tourism destination that can boost the number of visitors and the economy of the city of Surabaya.
The gap between tourism supply and tourism demand can cause problems in the tourism industry. The World Travel & Tourism Council (WTTC) (2020) obtained research results that as many as 75 million people around the world who work in the travel and tourism sector are threatened with losing their jobs and this could have very serious implications for the world economy. The decline in the number of tourist visits has had a major impact on employment opportunities.
A business with good management will have an increased growth impact. A business with poor management will have an impact on decline so that the survival of the business will be threatened (Wibowo, 2009).
As an initial stage in the management process, planning is a primary management function. Planning is an activity that precedes and becomes the foundation for other management functions. Planning includes the process of analyzing and formulating opportunities that are predicted to arise and then how to develop appropriate strategies and actions. The purpose of planning is to minimize risks or obstacles and threats that exist around the organization which provide uncertainty in achieving goals. Planning needs to be done because it can provide positive strength to achieve the expected level of success (Wibowo, 2009).
Proper planning for a business can create a higher chance of success compared to a business without planning. One of the ways in which proper business planning can be done is with a business model. According to Rappa (2000) in the PPM Management Team (2012, p. 5), the business model is the method used by a company to run its business which makes the company survive. The business strategy carried out by the company will not be able to run optimally if it is not based on the assessment and formulation of an appropriate business model (Chesbrough, 2006).
Business Model Canvas (BMC) is an efficient tool for creating business models. The Business Model Canvas provides an overview of how a company can create, provide and capture value and how a company makes money. The Business Model Canvas has visual elements consisting of nine basic blocks, namely Customer Segment, Value Proportion, Channels, Customer Relations, Revenue Stream, Key Activities, Key Partnership, and Cost Structure. Formulating a business model with the Business Model Canvas can help in creating new business strategy alternatives because the nine blocks of the Business Model Canvas make it easier to describe a business (Osterwalder and Pigneur, 2010).
Based on this background, the author is interested in analyzing the Romokalisari Adventure Land business model using the Business Model Canvas (BMC) approach and determining appropriate strategies for Romokalisari Adventure Land, so the author raises the research title “Strategy Formulation of Romokalisari Adventure Land as a Sustainable Tourism Destination Using a Business Approach Model (BMC).
Based on the background created, the problem formulation in this research is:
1. What are the existing conditions of the internal and external environment of Alam Romokalisari Adventure Land?
2. What is the business model that Romokalisari Adventure Land has currently implemented using the Business Model Canvas (BMC) approach?
3. What is the appropriate business strategy for Romokalisari Adventure Land based on Streghts, Weakness, Opportunities and Threads (SWOT) analysis and Internal – External Factor Evaluation?
4. What are the recommendations for the Romokalisari Adventure Land Business Model Canvas (BMC) design?
The objectives of this research are as follows:
1. To determine the existing conditions of the internal and external environment of Romokalisari Adventure Land
2. To find out the business model that Romokalisari Adventure Land has currently implemented using the Business Model Canvas (BMC) approach.
3. To find out the strategies that can be applied to Romokalisari Adventure Land using Streghts, Weakness, Opportunities and Threads (SWOT) analysis and Internal – External Factor Evaluation.
4. To provide recommendations for the Romokalisari Adventure Land Business Model Canvas.
Research Contribution
This research is expected to provide the following contributions and benefits:
1. Theoretical Benefits
Theoretically, the results of this research are expected to contribute to increasing insight and can become a reference for similar research, especially regarding business modeling using the Business Model Canvas (BMC) approach.
2. Practical Benefits
Practically, the results of this research are expected to contribute in providing strategic recommendations to the management of Romokalisari Adventure Land to increase product sales and input regarding business models so that they can provide information for related parties in efforts to increase business development.
REVIEW OF LITERATURE
- Definition of Tourism
The tourism business is related to fulfilling the needs of tourists when traveling on tour. In article 1, point 7 in Law no. 10 of 2009 states “Tourism businesses are businesses that provide goods and/or services to fulfill tourist needs and organize tourism”. According to Bafhadal (2018) there are several types of tourism businesses, namely tourism services businesses, Tourist Objects and Attractions (ODTW) businesses, and tourism facilities businesses.
Bahar and Marpaung (2002, p.13) state that tourism is a temporary movement carried out by people with the aim of getting away from routine jobs, out of their place of residence. Activities are carried out during their stay at the destination and facilities are created to meet their needs. There is also a more complex definition of tourism according to Tribe in Bafhadal (2018, p. 5), namely “the sum of the phenomena and relationships arising from the interaction, in generating and hosting regions, of tourists, business suppliers, government, communities and environments” . Based on this definition, it is explained that tourism is a number of phenomena and relationships that arise from interactions between various related parties such as tourists, business people, the host community, the host government, the host environment and other related parties.
- Business Model Canvas (BMC)
The business environment is an important part to analyze, as according to Sutarno (2012) that the business environment influences the function of the business system, where the environment is all the conditions and forces that exist inside and outside each business that influence the direction of company policy in managing its business activities or operations. Companies are faced with various new difficulties and challenges due to an increasingly rapidly changing and competitive business environment, making it difficult for companies to make business decisions.
One tool that can be used to explain a company’s environment and business operations is the Business Model Canvas (BMC). The Business Model Canvas provides an overview of how a company can create, provide and capture value and how a company makes money Osterwalder and Pigneur (2010). The Business Model Canvas is a business strategy management that makes it possible to describe, design and then narrow down several business aspects into one complete business strategy. The Business Model Canvas has 9 elements or also called nine building blocks related to the company environment as follows:
Customer Segment (Customer Segment)
The customer segment block describes a group of different people or organizations that the company wants to reach or serve and is then grouped into different segments based on similar needs, behavior and other attributes. This grouping is related to satisfying customers and clarifying the company’s movements. Once the company knows the customers it will serve, the company must understand the specific needs required by the customer. A customer group will represent several separate segments if:
1) Customer needs require and allow for different offerings.
2) Customers are acquired through different Distribution Channels.
3) Customers require a different type of relationship.
4) Customers basically have different profitability.
5) Customers are willing to pay for different aspects of the offer.
Customer segments are divided into several types. They are as follows:
1) Mass Market, which does not differentiate between different customer segments, so that the value proposition, distribution channels and customer relationships focus on a large group.
2) Niche Market, which chooses to serve specific and specialized customer segments, so that the value proposition, distribution channels and customer relationships focus on one large group.
3) Segmented (segmented market), distinguishing markets based on their respective needs and problems. This condition will affect the value proposition, distribution channels, customer relationships and revenue streams.
4) Diversified (diversified market), serving two unrelated segments with very different needs and problems.
5) Multi-sided platforms (many-sided platforms or many-sided markets), serving two or more interdependent customer segments. For example, a credit card company requires credit card holders and merchants who are willing to accept purchases with that credit card.
- Value Propositions
Value propositions describe a set of products and services that create value for a specific customer segment. Value propositions can be the reason why customers choose one company over another company, looking at whether the products and services are able to meet customer needs or solve customer problems. Value propositions can be innovations and new offerings, but may be the same as existing offerings, but with additional features and attributes. The following are several elements that can create value for customers, namely:
1) Newness (new nature), meeting various customer needs that they have never received before.
2) Performance, improving product or service performance as a way to create value.
3) Customization, adjustment or customization to specific customer needs.
4) Getting the job done, value can also be created by the company by helping complete the customer’s job.
5) Design can be a very important part of the value proposition for several industries, for example in the fashion industry.
6) Brand/status (brand or status) is also an important value for customers to increase their self-esteem.
7) Price is a very important factor when offering the same value to customers with price sensitivity.
8) Cost reduction (cost reduction), which helps reduce the costs incurred by customers when using the company’s products.
9) Risk reduction, namely reducing the risks for customers that arise when they buy a product or service.
10) Accessibility, namely making it easy for customers to access products or services.
11) Convinient/usability, trying to make something more comfortable and more comfortable through the use of goods or services.
- Channels (Distribution Channels)
The distribution channel block describes how a company can reach and communicate with its customer segments to convey value propositions. Communication, distribution and sales channels are the link between the company and customers. Channels have several functions including:
1) Increase customer awareness of the products and services the company has.
2) Help customers evaluate the company’s value proposition.
3) Enable customers to buy specific products and services.
4) Deliver value propositions to customers.
5) Providing after-sales support to customers.
Channels have five different phases. Each channel can cover several or even all five phases. Companies can differentiate between direct and indirect channels, as well as between channels owned by the company or channels owned by partners.
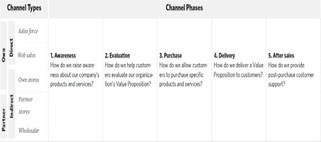
Figure 2. 1 Chanel Phases
Source: Osterwalder and Pigneur (2010)
- Customer Relationship (Customer Relationship)
The customer relationship block explains the various types of relationships that companies build with specific customer segments. Relationships can vary and are driven by various motivations as follows:
– Customer acquisition
– Retention (retaining) customers
– Increased sales (upselling)
Customer relationships can be categorized as follows:
- Personal assistance
This relationship is based on human interaction, namely customers communicating with service personnel via call centers, e-mail or other channels during the sales process or after the purchase is completed.
- Dedicated personal assistance
Relationships are created by assigning special officers in customer service intended for individual clients. This type of relationship is developed over the long term and is considered the deepest and most intimate relationship.
- Self-service
The company provides all the facilities needed for customers to be able to help themselves or self-service because the company does not have direct contact with customers.
- Automated services
This type of relationship combines a more sophisticated form of self-service with automated processes. Automated services can recognize individual customers and their characteristics and offer information related to orders and transactions.
- Communities
The user community is a great opportunity for companies. Many companies manage online communities that provide users with the opportunity to exchange knowledge and solve problems for other users, so that companies can easily understand customers better.
Co-creation
The relationships created by the company go beyond conventional relationships to become customer and vendor relationships in creating shared value. Amazon.com is one of the companies that carries out co-creation, namely by giving customers the opportunity to review the books on offer.
Revenue Stream (Income Stream)
This block describes the cash generated by the company from each customer segment it has, with the note that to generate income, costs must reduce income. If the customer is the core of the business model, then the revenue stream is its lifeblood. Business models can involve two types of revenue streams:
Transaction income that comes from one-time payment by the customer.
Recurring income that comes from ongoing payments either to provide value propositions to customers or provide post-purchase customer support.
Here are several ways to build a revenue stream:
Asset sale, which comes from the sale of ownership rights to physical products.
Usage fees, namely costs resulting from the use of certain services. The greater the use of services, the more costs paid by customers.
Subscription fees or subscription fees, namely fees resulting from selling continuous access to a service.
- Key Activities
Key activities are the most important actions that a company must take so that it can operate successfully. Key Activities differ depending on the type of business model. Key Activities are categorized as follows:
1) Production, namely this activity is related to designing, manufacturing and delivering products in large quantities and/or superior quality.
2) Problem solving, namely activities related to offering new solutions to individual customer problems.
3) Platform/network. Business models designed with the platform as a key resource are dominated by key activities related to the platform or network.
- Key Partnership
Key partnerships are blocks that explain the network of suppliers and partners that make a business model work. Partnerships are entered into by companies for various reasons and they form the basis of many business models. Companies create alliances to optimize business models, reduce risks or acquire their resources. There are four different types of partnerships, namely:
1) Non-competitor strategic alliance.
2) Coopetition (strategic partnership between competitors).
3) Joint ventures to develop new businesses.
4) Buyer-supplier relationships to ensure reliable supply.
Partnerships are established by various motivations as follows:
1) Optimization and economies of scale (optimization and economies of scale).
The most basic form of partnership or buyer–supplier relationship is designed to optimize the allocation of resources and activities. Optimization and economies of scale are usually carried out as an effort to reduce costs, and often involve outsourcing or various infrastructure.
2) Reduction of risk and uncertainty (reduction of risk and uncertainty).
Establishing partnerships can help reduce risk in a competitive environment characterized by uncertainty.
3) Acquisition of particular resources and activities (acquisition of certain resources and activities).
Only a few companies have the resources or perform all the activities described under their business model. Most companies prefer to expand their capabilities by relying on other companies to complement their resources or carry out certain activities. Partnerships can be driven by the need to gain knowledge or access to customers.
- Cost Structure (Cost Structure)
The cost structure is a block that explains all the important costs incurred to operate the business model. Creating and delivering value, maintaining customer relationships and generating revenue, results in costs being incurred.
The cost structure of business models is divided into two classes, namely:
1) Cost – driven (motivated by costs), this business model focuses on minimizing costs. The goal is to create and maintain as lean a cost structure as possible, and outsource extensively.
2) Value – driven (motivated by values). Some companies are less concerned with the cost implications of a particular business model design, and focus on value creation.
A premium value proposition and high level of personal service typically characterize this business model.
Cost structures can have the following characteristics:
1) Fixed costs, namely fixed costs incurred even if the company produces at different volumes.
2) Variable costs are costs incurred according to the volume of goods or services produced.
3) Economies of scale, obtained when a company produces in large quantities. This is achieved by getting a lower price due to the large number of purchases, resulting in a lower production price per unit.
4) Economies of scope (economic scope), the cost advantages that a business enjoys are related to a larger operational scope. In large companies, for example, the same marketing activities or distribution channels may support several products simultaneously.
The business model developed by Osterwalder and Pigneur (2010) is made in visual form of nine building blocks on a canvas called the Business Model Canvas which can be seen in Figure 2.2.
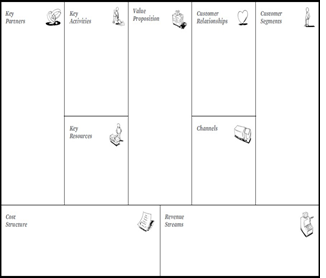
Figure 2. 2 The Business Model Canvas
Source: Osterwalder and Pigneur (2010)
- Strategy Management
Management is an open system that interacts with its environment in the process of changing the input or input of owned resources into output or output in the form of goods and/services (Priyono, 2004). Mondy & Premeaux (1995) in Wijaya (2016) stated that “management is the process of getting things done through the efforts of other people”. Management is a process of completing something or work with the help or through the efforts of other people. Management is a systematic, coordinated and cooperative process in efforts to utilize various resources (human and other) through the division of work, tasks and responsibilities that are regulated and supervised to achieve goals effectively and efficiently (Wijaya and Rifa’i, 2016 ).
Rangkuti (2013) states the definition of strategy as a tool to achieve company goals in relation to long-term goals, follow-up programs, and resource allocation priorities. Furthermore, Pearce and Robinson (1997, p. 20) provide a definition of strategic management as a set of decisions and actions that result in the formulation and implementation of plans designed to achieve company goals. Another opinion was given by Hunger and Wheelen (2003, p. 4) who explained that strategic management is a series of decisions and managerial actions that determine company performance in the long term. Strategic management includes several activities such as environmental observation, strategy formulation (strategic planning or long-term planning), strategy implementation, and evaluation and control. Strategic management emphasizes observing and evaluating environmental opportunities and threats by looking at the company’s strengths and weaknesses.
Important strategy formulation can be integrated into three stages of the strategy development framework, namely (David, 2011):
- Input stage
The input stage requires information from analysis of the internal and external environment of the organization or company. External environmental analysis focuses on identifying and evaluating trends and events that are outside the control of an organization or company. External environmental analysis reveals the main opportunities and threats faced by an organization or company. Meanwhile, internal environmental analysis focuses on identifying and evaluating the company’s strengths and weaknesses in the functional areas of the business.
This information is needed in the External Factor Evaluation (EFE) matrix and Internal Factor Evaluation (IFE) matrix to provide basic input information needed at the next stage. At this stage a good intuitive assessment is also carried out in determining the appropriate weights and rankings to form a strategy for measuring subjectivity during the initial stages of the process.
- External Factor Evaluation (EFE) Matrix
External Factor Evaluation (EFE) is used to summarize and evaluate economic, social/cultural, demographic, political/government/legal, natural, technological and competitive information (David, 2011). The EFE matrix can be developed in the following five steps:
1) Make a list of the main external factors identified in the external environmental analysis process starting from the list of opportunities first, followed by the list of threats.
2) Give a weight ranging from 0.0 (not important) to 1.0 (very important) to each opportunity and threat factor. The weights indicate the relative importance of each factor to being successful in the industry in which the company is located. The sum of all the weights given to each of these factors must be equal to 1.0.
3) Assign a rating between 1 to 4 for each external factor to indicate how effective the organization or company’s current strategy is in responding to that factor, where 4 = the response is superior, 3 = the response is above average, 2 = the response is average average, and 1 = poor response.
4) Multiply the weight of each factor by the rating to obtain a weight score for each variable.
5) Add up the weight scores for each variable to determine the total weight score for the organization or company.
- Internal Factor Evaluation (IFE) Matrix
Internal Factor Evaluation (IFE) Matrix is a method that is often used to summarize and evaluate the main strengths and weaknesses in business functional areas, namely management, marketing, finance, production/operations, research and development, and management information systems. The IFE Matrix can be developed through the following five steps:
1) Make a list of internal factors identified in the internal environmental analysis process starting from strengths and then weaknesses.
2) Give a weight ranging from 0.0 (not important) to 1.0 (all important) to each internal factor. The weight values assigned indicate the relative importance of each factor to being successful in the industry in which the company is located. Factors that have the greatest influence on organizational or company performance should be given the highest weight. The total weight must be equal to 1.0.
3) Give each factor a rating of 1 to 4 to indicate whether the factor represents a major weakness (rating = 1), minor weakness (rating = 2), minor strength (rating = 3), or major strength (rating = 4) .
4) Multiply the weight of each factor by the rating to obtain a weight score for each variable.
5) Add up the weight scores of each variable to determine the total weight score of the organization or company.
- Matching Stage
The matching stage is a strategy formulation framework that requires information from the previous stage by matching external opportunities and threats with internal strengths and weaknesses. Matching external and internal success factors is key in producing effective alternative strategies. Several techniques that can be used in this stage are the Strength-Weakness-Opportunity-Threat (SWOT) Matrix and the Internal-External Matrix.
- SWOT Matrix
Strengths, weaknesses, opportunities, threats (SWOT) is one of the most long-standing situational analysis tools and is widely used by companies in formulating strategy analysis. SWOT analysis consists of four components (Rangkuti, 2013), namely:
– Strength, namely the elements that the company can excel at, such as superiority in reliable products, having skills that are also reliable and different from other products which can make it stronger than its competitors. Strengths are specific competencies that give a company a comparative advantage in the market. Power can be contained in resources, image, market leadership, finance, or buyer-supplier relationships.
– Weakness, namely a lack or limitation in terms of the company’s existing resources, whether skills or abilities, which can be an obstacle to organizational performance. Limitations or deficiencies in resources, skills and capabilities that can seriously hinder the company’s effective performance. Facilities, financial resources, management capabilities, marketing skills, and brand image can be sources of weakness.
– Opportunities, namely various things and situations that are profitable for a company. Important favorable situations in the corporate environment, important trends are one source of opportunity. Identification of previously neglected market segments, changes in the competitive or regulatory environment, changes in technology, and improved relationships with buyers or suppliers can provide opportunities for the company.
– Threats, namely environmental factors that are unfavorable for the company, if not addressed, will become obstacles for the company concerned both now and in the future. Threats are major disruptions to a company’s current or desired position. The entry of new competitors, slow market growth, increased bargaining power of key buyers or suppliers, technological changes, and new or revised regulations can all pose threats to a company’s success.
According to Rangkuti (2013), SWOT is the systematic identity of various factors to formulate service strategies. This analysis is based on logic that can maximize opportunities while also minimizing shortcomings and threats. SWOT analysis compares external factors and internal factors.
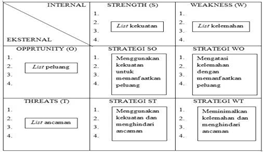
Figure 2. 3 SWOT Matrix
Source: David (2011)
The SWOT matrix produces four strategies based on the quadrants of the diagram previously explained. The four strategies according to David (2011) are:
– Quadrant I: SO Strategy (Strength–Opportunities)
This strategy uses the company’s internal strengths to seize opportunities that exist outside the company. All managers certainly want their organizations to be in a position where internal strengths can be used to take advantage of various external trends and events. In general, companies try to implement WO, ST, or WT strategies to implement SO strategies. Therefore, if a company has many weaknesses, inevitably the company must overcome these weaknesses in order to become strong.
– Quadrant II: ST Strategy (Strength–Threats)
Through this strategy the company tries to avoid or reduce the impact of external threats. This does not mean that a strong organization must always face threats directly in the external environment.
– Quadrant III: WO Strategy (Weaknesses–Opportunities)
The WO strategy aims to improve internal weaknesses by exploiting external opportunities. Sometimes key external opportunities exist, but the company has internal weaknesses that prevent it from taking advantage of those opportunities. For example, there may be high demand for electronic devices to control the amount and timing of fuel injection in automobile engines (opportunity), but certain auto parts manufacturers may lack the technology needed to produce these devices (weakness). One possible WO strategy is to acquire this technology by forming a joint venture with a company that has competence in this area.
– Quadrant IV: WT Strategy (Weaknesses–Threats)
This strategy is a tactic to survive by reducing internal weaknesses and avoiding threats. A company that is faced with a number of internal and external threats is essentially in a dangerous position.
- Internal-External (IE) Matrix
The Internal-External (IE) Matrix consists of nine parts. The IE matrix is based on two key dimensions: total eighted score IFE on the x-axis and EFE on the y-axis. On the x-axis of the I-E Matrix, IFE total weight values of 1.0 to 1.99 represent a weak internal position; a score of 2.0 to 2.99 is considered average; and a score of 3.0 to 4.0 is strong. Similarly, on the y-axis, EFE total weight values of 1.0 to 1.99 are considered low; a score of 2.0 to 2.99 is medium; and a score of 3.0 to 4.0 is high (David, 2011).
The I-E matrix can be divided into three main areas that have different strategic implications. First, the divisions contained in cells I, II, or IV can be described as growing and developing. Intensive (market penetration, market development, and product development) or integrative integration (backward integration, forward integration, and horizontal integration) may be the most appropriate strategy for this division. Second, cells III, V, or VII can be managed well with survival and defense strategies; Market penetration and product development are two commonly used strategies for this type of division. Third, the strategy in cells VI, VIII, or IX is harvest or divestment (David, 2011).
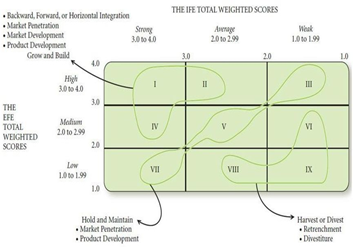
Figure 2. 4 Internal-External (IE) Matrix
Source: David (2011)
- Decision Stage
Analysis and intuition provide the basis for making strategy formulation decisions. The previous stage reveals viable alternative strategies. Existing strategies are then rated on a scale of 1 to 4 so that a priority list of the best strategies can be achieved. The method used at this stage is the Quantitative Strategic Planning Matrix (David, 2011).
QSPM is a tool that allows to evaluate alternative strategies objectively, based on previously identified external and internal critical success factors. This technique objectively shows which alternative strategy is the best. QSPM uses input from stage 1 analysis and matching results from stage 2 analysis to decide objectively between available alternative strategies. The top line of the QSPM consists of alternative strategies derived from the SWOT Matrix and I-E Matrix. Meanwhile, the left column of the QSPM consists of the main external and internal factors obtained directly from the EFE Matrix and IFE Matrix.
These matching tools usually produce viable alternatives. However, not all strategies suggested by matching techniques should be evaluated in QSPM. Strategists must use good intuitive judgment in selecting the strategies included in this matrix. The components of QSPM are Strategic Alternatives, Key Factors, Weights, Attractive Score, Total Attractive Score, and Total Attractive Score. QSPM can be developed through the following steps:
1) Make a list of the company’s main external opportunities/threats and internal strengths/weaknesses in the left column of the QSPM taken from the EFE Matrix and IFE Matrix. There are at least 10 external key success factors and 10 internal key success factors that must be included in the QSPM.
2) Assign weights to each external and internal factor. These weights are identical to the weights in the EFE Matrix and IFE Matrix. The weight values are presented in a straight column to the right of the external and internal critical success factors.
3) Determine and identify alternative strategies that the organization must consider implementing from the matching stage. List the strategies on the top line of the QSPM.
4) Determine the Attractive Score which shows the relative attractiveness of each strategy in a certain set of alternatives. The Attractive Score is determined by examining each external or internal factor of the organization and considering how influential each factor is on the strategic choices made. An Attractive Score should be assigned to all strategies to indicate the relative attractiveness of one strategy over another, taking certain factors into account. The Attractive Score range is 1 = not attractive, 2 = somewhat attractive, 3 = quite attractive, and 4 = very attractive. If a key factor does not influence the specific choice made, then an Attractive Score is not assigned to the strategies in that series. Use a dash to indicate that the key factor did not influence the choice made. Note: If assigning an Attractive Score score to one strategy, then assign an Attractive Score score to the other strategy. In other words, if one strategy accepts hyphens, then all other strategies must receive hyphens in the same sequence.
5) Calculate the total Attractiveness Score by multiplying the weight by the Attractive Score in each row. The Total Attractiveness Score shows the relative attractiveness of each alternative strategy, the higher the value, the more attractive the strategic alternative.
6) Calculate the Total Attraction Score by adding the Total Attraction Score in each strategy column. The Total Attractiveness Scores indicate the most attractive strategy in each set of alternatives. A higher score indicates a more attractive strategy resulting from consideration of all relevant external and internal factors that influence strategic decisions. The magnitude of the difference between the Total Attractiveness Scores within a given set of alternative strategies indicates the relative desirability of one strategy over another.
RESEARCH METHOD
Types of Research
The type of research applied in this research is descriptive research with a qualitative approach. Qualitative research is characterized by natural, objective conditions in research. Descriptive methods are used to discover the elements, characteristics and nature of a phenomenon by collecting, analyzing and interpreting data (Suryana, 2010). If related to business as the field being researched, this research can be defined as a scientific way to obtain valid data so that knowledge can be discovered, proven and developed to understand, solve and anticipate problems in the business field (Enny Radjab and Andi Jam’an , 2017). In this research, the author acts as a key instrument which requires extensive insight and theoretical provisions in carrying out research.
Research focus
The focus of the research is the core problem in the research topic which is the center of problem solving so that the data collected and analyzed by the research can be sorted and adjusted to the research objectives. The core of the problem must be detailed and clear so that it makes research easier and the determination is carried out through limitations with existing theories, so that a research focus can be found (Enny Radjab and Andi Jam’an, 2017). The research focus in this study is:
- Analysis of the internal and external environment of Romokalisari Adventure land
- Business modeling at Romokalisari Adventure Land into nine building blocks from the Business Model Canvas (BMC), namely Customer Segment, Value Proportion, Channels, Customer Relationship, Revenue Stream, Key Activities, Key Partnership, and Cost Structure.
- Analysis of the Romokalisari Adventure land strategy with the following stages:
- Analysis of internal and external business factors.
- Strengths, weaknesses, opportunities and threads (SWOT) analysis.
- Formulation of alternative strategies using the I-E (Internal – External) matrix.
- Designing business model recommendations using the Business Model Canvas (BMC) approach based on the results of the business model evaluation.
Research Locations and Sites
The research location is a place or environment that is related to the objectives or problems in the research. The research location is in Surabaya. at Romokalisari Adventure Land. Romokalisari Adventure Land is located on Jl. Romokalisari I, Romokalisari, District. Benowo, Surabaya City, East Java, 60192. The reason for choosing this location is because this destination is a sports tourism destination which has just been inaugurated in the City of Surabaya. Until now there has been no research that uses Romokalisari Adventure Land as the research object.
So the site that is the focus of the research is Romokalisari Adventure Land. Romokalisari Adventure Land is located on Jl. Romokalisari I, Romokalisari, District. Benowo, Surabaya City, East Java, 60192. The reason for choosing this location is because this destination is a sports tourism destination which has just been inaugurated in the City of Surabaya. Until now there has been no research that uses Romokalisari Adventure Land as the research object. The creation of a Memorable Tourism Experience as a visitor evaluation is a topic of discussion that will be researched and assessed as having the potential to increase Intention to Return to Romokalisari Adventure Land. as one of the businesses in the tourism and creative economy sector and how the business is run, then an analysis and formulation of the business model is carried out.
Data source
In order for research objectives to be met, data is needed as a source of information (Gulo, 2002). Data sources are research subjects from which data can be obtained. Data sources can be objects, places, people, movements, certain processes, and so on (Enny Radjab and Andi Jam’an, 2017). Data sources in research are divided into two types, namely primary data and secondary data. The following is the data needed in this research:
Primary Data
Primary data is data obtained by researchers from the source, recorded and observed then the results are used to solve problems (Agung, 2012). Primary data is obtained from sources or informants who are rich in the information needed (information rich) through interviews and observations. Rich informants are those who have the required information and are involved or directly experience the symptoms, events, problems (Raco, 2010). Sources who become informants. Based on the research focus that has been determined, the primary data needed is data regarding the general description, internal-external environment and business model based on the nine building blocks of BMC from Romokalisari Adventure Land.
Secondary Data
Secondary data is data obtained or collected by other people or parties which is further processed in forms such as pictures, tables, graphs, and others so that the data becomes more informative (Agung, 2012). Secondary data in this research is needed as supporting or complementary data to primary data. Secondary data used in this research comes from literature, books, documents, articles and regional general descriptions.
Data collection
Data collection can be carried out using various methods according to research needs in order to obtain reliable and valid data. There are various data collection methods, including interviews, observations, questionnaires and documentaries (Gulo, 2002). The data collection method applied in this research is as follows:
Interview
Conversational interview between two parties with a specific aim or purpose (Moleong, 2015, p.186). The purpose of interviews in this research is to obtain or collect the required information. According to Ali in Gulo (2002) the benefits of the interview method are:
- Interviews can be conducted with each individual without making age or reading ability a barrier.
- The objectivity of the data obtained can be known directly because the interviews were carried out face to face.
- Interviews can be conducted directly with respondents who are the data source.
- Interviews can improve the results obtained both through observations of human and non-human objects as well as results obtained through questionnaires.
- Interviews can be more flexible and dynamic in their implementation because there is a direct relationship, so that explanations can be given to respondents if the questions asked are difficult to understand.
Interviews can be conducted using several approaches (Cooper and Schindler, 2017, p. 180), namely unstructured interviews, semi-structured interviews and structured interviews. Unstructured interviews are interviews that are tailored to the participant and generally begin with a narrative by the participant without a specific order of topics or questions to be discussed. Semi-structured interviews are interviews that begin with specific questions and then flow following the individual’s problems to find out their thoughts and views. A structured interview is an interview that uses an interview guide to guide the researcher in asking specific questions and in sequence.
Observation (observation)
Gulo (2002) stated that observation is a data collection method in which researchers record information according to what they witness while conducting research. Events are witnessed by seeing, hearing, feeling, and then written down or recorded as objectively as possible. There are several reasons for using observation in data collection according to Moleong (2015, p. 175), namely the researcher’s abilities can be optimized through observation, observation can encourage the formation of knowledge, observation allows researchers to see the world from the perspective of the research subject, and researchers can feel what they feel. by research subjects through observation. The participatory relationship between the observer and the group being observed can influence the role of the observer (Gulo, 2002), as explained below:
- Full participation
Full participation is when the observer feels comfortable with the person being studied or is a member of the group being observed. The aim is for observers to feel and appreciate what the research subjects feel.
- Participants as observers
Participants as observers, namely researchers, have limitations in participating in observations or not fully immersing themselves in the group being studied.
- Observer as participant.
Observers as participants, namely researchers, simply participate as long as needed in their research.
- Perfect observer (complete observer).
A perfect observer means that the researcher does not participate in the group being observed or is only an observer.
In this research, the type of observation used was the observer as participant.
Documentation
Documentation according to Pawito (2007) in Wahyuningsih (2013) is a data collection technique carried out by searching, collecting and studying documents relevant to research in the form of archives and other literature. Documentation techniques are used in this research to obtain data that can support and assist research such as pictures, photos, writing, general descriptions of research locations and recorded interviews.
Research Instrument
The tools used in research to obtain or collect the required data are called research instruments. The research instruments were chosen according to the method used to collect data, namely interview guidelines, observation guidelines, questionnaire lists, and so on (Gulo, 2002). This research instrument includes:
Researcher himself.
According to Moleong (2015, p.9), humans or researchers are the main data collection tool because researchers themselves can relate to research objects or subjects and can understand the relationship between the realities that occur in the field. Therefore, in this research the researcher becomes an important instrument that is useful in obtaining data.
Interview guide
The use of interview guidelines is as a guide in guiding questions, flow and sequence in interviews and helps limit data collection so that it does not stray from the theme or research topic. The topic of the interview in this research is the business model, internal environment and external environment of Romokalisari Adventure which are described in several questions based on indicators that the researcher studied from related theories used in the research. These questions are included in the interview guide to serve as a guide during conducting the interview so that the implementation can focus on the research topic.
Supporting tools
This research can run well with research support tools such as field notes and cell phones or smartphones. Field notes are used to record the results of observations or observations when involved at the research site. Field notes have an important role in providing an overview of the general conditions of daily activities at the research site. Apart from field notes, cell phones or smartphones were also used to take photos and record interviews. Researchers need to record interview activities in the form of photos and audio as a form of documentation. Apart from helping in making interview transcripts, the recording results can be proof of the validity of the research data.
Analysis Method
Analysis is the activity of systematically organizing material from observations or interviews, interpreting it to produce new thoughts, opinions, ideas or theories (Raco, 2010). Data analysis is an important research activity to be carried out after data collection in order to solve the problem being studied. Sharpness and accuracy in using data analysis tools will influence the accuracy of drawing conclusions, so that data analysis activities are a process that cannot be ignored in research activities (Enny Radjab and Andi Jam’an, 2017). Data analysis in this research was carried out through the following stages:
Data collection
Data collection in research was carried out using several techniques, namely observation or direct observation at the Romokalisari Adventure research site, interviews with informants, and documentation to collect various data that could complement the research.
Data reduction
Sorting data by summarizing, selecting the main things, focusing on the important things, and looking for themes and patterns from the data obtained are activities carried out in data reduction. Data from observations, interviews and documentation in this research were reduced using the research objectives as a reference.
Presentation of data
The stage after data reduction is data presentation. At the data presentation stage, researchers write or explain the reduced data into short descriptions, charts and other forms so that the research data can be understood easily.
Drawing conclusions
Drawing conclusions is the final stage in which the researcher simplifies the data that has been presented referring to the formulation of the research problem. In this research, conclusions are drawn by making the data presentation simpler without departing from the research problem formulation that has been determined.
RESULTS AND DISCUSSION
General Description of Research Locations
Surabaya is located in East Java Province, and is also the capital of the Province. Borders with Sidoarjo Regency, Madura Strait and Gresik Regency. Geographically, the City of Surabaya is located at 7° 9’– 7° 21′ South Latitude and 112° 36′ – 112° 54′ East Longitude (Surabaya City Government, 2022). The city of Surabaya itself has a lot of tourism potential with 476 tourist destinations spread throughout the city (Disbudporapar, 2022). The types of tourist attractions in the city of Surabaya include: museums, heritage and history, monuments, religious tourism, shopping centers, cultural heritage, arts and culture, MICE, culinary tourism and sports tourism, one of which is Romokalisari Adventure Land.
Romokalisari Adventure Land stands on an area of 76,769 m2 and is located on Jl. Romokalisari I, Kel. Romokalisari, District. Benowo, Surabaya City. Romokalisari Adventure Land was inaugurated on September 25 2022 by the Mayor of Surabaya, Eri Cahyadi. This destination is managed by the Surabaya City Food and Agriculture Security Service (DKPP) under the supervision of the Fisheries and Maritime Affairs Sector. The function of DKPP is to increase food security, improve the quality of the city’s clean and green living environment through the construction of grand forest parks, improve the quality of public services, and increase accountability in implementation. The following is the organizational structure of the Surabaya City Food and Agriculture Security Service (DKPP).
Data Presentation
Internal Environmental Analysis
Analysis of the company’s environment is the first step in determining a strategy where the results of the analysis become material for consideration in determining the right strategy. Marketing can be described as the process of defining, anticipating, creating, and fulfilling customer needs and desires for products and services (David, 2011). The marketing carried out by Romokalisari is active marketing and passive marketing.
Romokalisari Adventure Land is a sports tourism, educational tour, and fish sales stand and food court. Romokalisari Adventure Land attracts a lot of visitors because of the many tourist attractions and is suitable for unwinding on the weekend. Apart from sports tourism and educational tourism, this destination also has a children’s play area, a beautiful park which is often used for picnics by visitors and a mini zoo where there is a collection of birds, turtles, rabbits and sheep. For sports tourism, the types of facilities for rent include: canoes, lifeboats, water boats, duck boats, horse riding, ATVs and jet skis. For educational tourism, the educational material is fish cultivation and types of pine trees.
Access to Romokalisari Adventure Land is quite easy because this destination is near the Osowilangun warehouse, Romokalisari toll gate and Osowilangun Tambak Terminal. Almost all types of public and private transportation can be used to access destinations. On Saturdays and Sundays there is a Free Bus. Osowilangun Pond Terminal. Almost all types of public and private transportation can be used to access this destination. One of the public transportation that can be used to get to this destination is the Suroboyo Bus on Saturdays and Sundays only. Visitors do not need to pay a penny to enter Romokalisari Adventure Land, but it is different if visitors want to rent the facilities provided. The following are the prices for renting facilities at Romokalisari Adventure Land Surabaya:
Table 4.1 Fasilitas di Romokalisari Adventure Land
| Fasilitas | Harga Sewa |
| Kano | Rp 10.000 / trip |
| Sekoci | Rp 10.000 / trip |
| Perahu | Rp 10.000 / trip |
| Perahu Bebek | Rp 10.000 / 15 menit |
| ATV | Rp 25.000 / 2 putaran (rute pendek) Rp 50.000 / 2 putaran (rute panjang) |
| Berkuda | Rp 20.000 / 2 putaran |
| Jetski | Rp 500.000 – Rp 700.000 / 30 menit (Photo Trip)
Rp 1.000.000 – Rp 1.500.000 / 1 – 1,5 jam (Beginner Ride Package – Suramadu Fun Trip) Rp 2.000.000 – Rp 3. 000.000 / 2,5 – 3 54fg,jam (Intermediate Ride Package – Karang Jamuang Sea Trip) |
External Environmental Analysis
Analysis of the external environment reveals the main opportunities and threats facing the organization so that managers can formulate strategies to exploit opportunities and avoid or reduce the impact of threats (David, 2011).
The following are the steps in determining a strategy which consists of several stages. The stages in determining strategy according to David (2011) are input stage, matching stage, and decision stage.
Input Stage
Input tools require strategists to measure subjectivity during the early stages of the strategy formulation process. Making small decisions within the input matrix regarding the relative importance of external and internal factors allows strategists to more effectively generate and evaluate alternative strategies (David, 2011). The input stage is carried out by grouping each internal factor and external factor of Romokalisari adventure. Internal factors are divided into strengths and weaknesses. Meanwhile, external factors are divided into opportunities and threats.Internal Factor Evaluation (IFE) Matrix
The summary step in conducting an internal strategic management analysis is to prepare an Internal Factor Evaluation (IFE). This strategy formulation tool summarizes and evaluates the main strengths and weaknesses in the functional areas of the business, and also provides a basis for identifying and evaluating the relationships between these areas (David, 2011). Romokalisari adventure’s internal strategic factors. given an assessment or score on the matrix. The score for each factor is obtained from the product of the weight and rating. IFE Matrix from Romokalisari adventure. can be seen in table 4.4.
Tabel 4. 4 Matriks IFE
| INTERNAL STRATEGIC FACTORS | ||||
| Strenghts | Weight | Relative Weight | Ratings | Score |
| There are various interesting jet sky rides | 4 | 0.083 | 4 | 0.333 |
| There are fish stalls and various food preparations made from fish | 3 | 0.063 | 3 | 0.188 |
| There is an attraction to explore the mangrove forest by boat/canoe while seeing the nature of Surabaya | 3 | 0.063 | 3.5 | 0.219 |
| Have horse riding tours | 3 | 0.063 | 4 | 0.250 |
| Has a variety of animals | 4 | 0.083 | 3.7 | 0.308 |
| INTERNAL STRATEGIC FACTORS | |||||
| Weakness | Weight | Weight Relatively | Ratings | Score | |
| Lack of promotion | 4 | 0.083 | 2 | 0.167 | |
| Lack of trained workforce | 3 | 0.063 | 2 | 0.125 | |
| amount | 22 | 0.375 | 0.833 | ||
| Total | 48 | 1,000 | 2,788 | ||
Regardless of how many factors are included in the IFE Matrix, the total score can range from a low of 1.0 to a high of 4.0, with an average score of 2.5. A weighted total score well below 2.5 indicates an internally weak organization, while a score significantly above 2.5 indicates a strong internal position (David, 2011). Based on
Table 4.4 shows that internal business factors have a total calculation score of 2.788. The total score shows that Romokalisari Adventure has a strong internal position.
External Factor Evaluation (EFE) Matrix
External Factor Evaluation (EFE) is used to summarize and evaluate economic, social/cultural, demographic, political/government/legal, natural, technological and competitive information (David, 2011). External strategic factors are obtained from primary data which includes opportunities and threats. These factors are given an assessment or score on the EFE matrix. The score for each factor is obtained from the product of the weight and rating. The total score resulting from the assessment of each opportunity and threat factor shows how the company responds to opportunities and threats in the company’s external environment.
The total score shows whether the company’s current strategy is effective or ineffective in exploiting existing opportunities as well as the company’s ability to minimize the potential negative impact of external threats. The opportunity and threat factors assessed in the EFE matrix are obtained based on an analysis of Romokalisari Adventure’s external environment which covers areas including economic, social, political, ecological, remote environment and operational environment. An assessment of these factors can be seen in table 4.
Tabel 4. 5 Matriks EFE
| EXTERNAL STRATEGIC FACTORS | ||||
| Opportunity | Weight | Relative Weight | Ratings | Score |
| Romokalisari adventure has affordable prices | 3 | 0.071 | 3.7 | 0.264 |
| Romokalisari adventure is a suitable place for traveling as an educational activity or as an outlet for hobbies | 3 | 0.071 | 3.5 | 0.250 |
| Becomes a favorite tourist attraction in the city of Surabaya | 4 | 0.095 | 3.7 | 0.352 |
| There is a lack of nature-themed tourist attractions in Surabaya | 3 | 0.071 | 3 | 0.214 |
| Government policies and programs
in the context of strengthening the economy |
4 | 0.095 | 3 | 0.286 |
| Advances in information technology | 4 | 0.095 | 2 | 0.190 |
| People who have a high interest in tourism | 3 | 0.071 | 3 | 0.214 |
| Has 8 natural tourist attractions | 4 | 0.095 | 3 | 0.286 |
| Amount | 28 | 0.667 | 2,057 | |
| Threats | Weight | Weight Relatively | Ratings | Score |
| Covid-19 pandemic | 4 | 0.095 | 1 | 0.095 |
Source: Processed by the author (2023)
Regardless of the number of key opportunities and threats included in the EFE Matrix, the highest possible total weighted score for an organization is 4.0 and the lowest possible total weighted score is 1.0. The total weighted average score is 2.5. A total weighted score of 4.0 indicates that the organization is responding in an extraordinary way to the opportunities and threats that exist in its industry. In other words, the company’s strategy effectively exploits existing opportunities and minimizes the potential negative impact of external threats (David, 2011). Based on Table 4.5, it is known that external business factors have a total calculation score of 2.795. This score shows that Romokalisari Adventure can take advantage of existing opportunities and can avoid the threats it faces quite well.
Matching Stage
Matching stage is the stage of matching each internal factor and external factor to produce a strategy that can be applied. Strategy is sometimes defined as the match that an organization makes between its internal resources and skills and the opportunities and risks created by its external factors. Matching external and internal critical success factors is the key to effectively generating viable alternative strategies (David, 2011). The matching stage is carried out using the SWOT Matrix and Internal-External Matrix.
SWOT Matrix
The SWOT matrix is an important matching tool in helping managers develop four types of strategies: SO Strategy (strengths-opportunities), WO Strategy (weaknesses-opportunities), ST Strategy (strengths-threats), and WT Strategy (weaknesses-threats). SO Strategy uses the company’s internal strengths to exploit external opportunities and WO Strategy aims to improve internal weaknesses by exploiting external opportunities. ST Strategy uses company strengths to avoid or reduce the impact of external threats and WT Strategy is a defensive tactic directed at reducing internal weaknesses and avoiding external threats (David, 2011). These strategies are formulated using a SWOT matrix which divides internal and external factors into strengths, weaknesses, opportunities and threats which are then combined to obtain the right strategy.
Matching strategies for Romokalisari Adventure is done by combining strengths and opportunities, namely using Romokalisari Adventure’s strengths to take advantage of opportunities and weaknesses to improve Romokalisari Adventure’s weaknesses by taking advantage of opportunities. The strength-threat combination is using Romokalisari Adventure’s strengths to avoid or reduce the impact of threats and the weakness-threat combination to reduce Romokalisari Adventure’s weaknesses and avoid SWOT matrix threats. Romokalisari Adventure’s SWOT matrix can be seen more clearly in Table 4.6.
Tabel 4. 6 SWOT Matrix
| Strengths (S) | Weakness (W) |
| 1) Has an interesting jet sky ride
2) There are fish stalls and various processed fish foods 3) Have horse riding tours 4) Has the attraction of exploring the mangrove forest by boat or canoe 5) Has a variety of animals |
1) Lack of promotion
2) Lack of trained workforce |
| Opportunities (O) | Threats (T) |
| 1) Romokalisari adventure has affordable prices
2) Romokalisari adventure is a suitable place to do news as an educational activity or to channel your hobby 3) Becomes a favorite tourist attraction in the city of Surabaya 4) There are very few tourist attractions with a natural theme in Surabaya 5) Government policies and programs in the context of strengthening the economy 6) Technology advances 7) Communities that have high tourism 8) It has 8 natural attractions that are considered unique by visitors |
1) Covid-19 pandemic |
Source: Processed by the author (2023)
- The recommended strategy based on the SWOT matrix is as follows:
- S-O Strategy
– Added variety of attractions (S1,S3, S8, O1).
– Maintain product quality and service quality and provide discounts for school group visits (S1, S2, S3, 08).
– Optimize existing attractions
– Utilizing government programs to develop tourist destinations (S5, O5)
- W-O Strategy Figure 4. 4 SWOT Diagram
Internal-External Matrix
– Increase promotion by creating a website and utilizing existing social media as promotional media (W1, W6, O1, O2, O6).
– Utilize government support to help promote the Romokalisari Adventure destination (W1, W4, W6, O5).
– Absorb more workers who are unemployed (W2, O4).
- S-T Strategy
– Maintain destination quality and innovate to be competitive (S1, S2, S3, S4, T1, T3, T4).
- W-T Strategy
– Optimize promotions to attract more visitors (W1, T1,T3,T4)
IV.1.1.2 SWOT Diagram
In the IFE and EFE analysis of Romokalisari Adventure, the scores for each factor were obtained, namely:
- Strength factor score: 1.954
- Weakness factor score: 0.833
- Opportunity factor score: 2.057
- Threat factor score: 0.738
The scores of these factors are used to determine the coordinates of Romokalisari Adventure’s position on the SWOT diagram. Determining the coordinates of Romokalisari Adventure on the SWOT diagram will make it easier to obtain the right management strategy for business development. Romokalisari Adventure coordinates are determined using the following calculations: X axis
X = (Total strength score– Total weakness score)
= (1,954 – 0,833)
= 1,121
- Y axis
Y = (Total opportunity score– Total threat score)= (2,057 – 0,738)
= 1,319
In the calculation above, the coordinate points obtained are (1.121 ; 1.319).
The diagram of the results of the SWOT analysis of Romokalisari Adventure can be seen in figure 4.4.
In the SWOT diagram, it is known that Romokalisari Adventure’s position is in quadrant I. The right combination of strategies for companies in quadrant I is an aggressive strategy that supports growth policies or growth oriented strategy. Various strategies that can be implemented are forward integration, backward integration, horizontal integration, market penetration, product development and diversification.
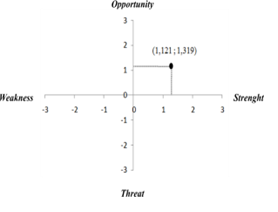
Picture 4. 4 Diagram SWOT
Internal-External Matrix
IE Matix is a strategy analysis tool that uses weighted IFE and EFE scores to determine the condition of the Romokalisari adventure and the strategies that can be applied. The IE matrix is based on two main dimensions: the IFE total weight score on the x-axis and the EFE total weight score on the y-axis (David, 2011). Based on the results of calculating the IFE and EFE weight scores, the value obtained on the X axis is 2.788 and on the Y axis is 2.795. Romokalisari’s IE Matrix can be seen in Figure 4.5.
Based on the IE matrix in the image above, Romokalisari Adventure is in the fifth cell. On the X-axis Romokalisari Adventure is in the average column with a score of 2.788 and on the Y-axis Romokalisari Adventure is in the medium bars. The fifth cell shows the internal conditions of the medium and the external conditions of the medium. Company positions in cells III, V, or VII can implement a hold and maintain strategy, namely by penetrating the market and developing products (David, 2011).
| Strong (3,0-4,0) | Avarage (2,0-2,99) | Weak (1,0-1,99) | |
| High (3,0-4,0) | I | II | III |
| Medium (2,0-2,99) | IV | V
(2,788 ; 2,795) |
VI |
| Low (1,0-1,99) | VII | VIII | IX |
Decision Stage
The Decesion stage is the final stage in determining the selected strategy using the Quantitative Strategic Planning Matrix (QSPM) analysis tool. Before determining the selected strategy using QSPM, several alternative strategies will be filtered and selected based on the existing business conditions or in this case adjusted to the existing conditions of Romokalisari Adventure.
ANALYSIS AND DISCUSSION
Market Penetration Strategy
The market penetration strategy is the most recommended strategy for Romokalisari Adventure based on the QSPM assessment. Market penetration as a company growth strategy by increasing sales of current tourism products without changing the product (Kotler, 2008). A similar strategy was also chosen by Amirah (2018) and Pharamita, Tama, and Ardianwiliandri (2017). In research conducted by Amirah (2018), the selected strategy based on QSPM was a market penetration strategy with a TAS of 15,984. The market penetration strategy offered by Amirah is divided into two, namely increasing awareness and action to buy. Efforts to increase consumer attention can be done by carrying out digital marketing, namely utilizing the social media and website features that Nizar has. The strategy offered by Pharamita, Tama, and Ardianwiliandri (2017) PT. Kusumasatria Agrobio Taniperkasa in its research regarding strategies to increase sales of Yoguku products is market penetration and market development, namely by intensifying promotions or advertising and developing distribution channels in collaboration with tour agents. As for this research, efforts that can be made to increase sales are related to market penetration strategies, namely: Increasing promotions
Promotion is one important aspect that influences visiting interest. Romokalisari Adventure is currently doing passive marketing. In order to increase tourist visits, Romokalisari Adventure needs to increase promotions which can be done by conducting digital marketing both through social media and websites. The advantage of digital marketing is connecting potential tourists and Romokalisari Adventure via the internet, reaching more consumers, increasing brand awareness.
- Based on the 2020 Global Digital Report, it is known that the number of active social media users in Indonesia is 160 million users, of which 130 million are Facebook users and 63 million are Instagram users. Then according to Tech In Asia, 45% of Indonesian Instagram users admitted that they often buy products they see on Instagram social media. So that the use of social media Instagram and Facebook can increase the reach of the Romokalisari tourist destination. Apart from that, there is a Facebook Ads Manager advertising service which can share product advertisements on Instagram and Facebook stories or feeds to users who are potential customers. Romokalisari Adventure already has social media Instagram and Facebook but they have not been utilized optimally as promotional media, so Romokalisari Adventure needs to try to manage these social media for promotional purposes.
Recommendations for Romokalisari Adventure’s Business Model Canvas (BMC) Design
The strategy that has been formulated using the strategy determination framework by David (2011) can be used to provide recommendations for the development of BMC from Romokalisari Adventure. The resulting strategy is added to BMC Romokalisari Adventure and then determines the addition of supporting strategies to other BMC elements so that the added strategy can run in the business model. Research by Bernd Polling, Marcus Mergentheler, Wolf Lorleberg (2016) produced a business model for developing non-organic and organic agriculture that focuses on low prices, differentiation and diversification. In this research, the recommended strategy for developing the Romokalisari Adventure business model focuses on increasing promotions and efforts to increase tourist/visitor visits. Recommendations for adding strategies to the BMC Romokalisari Adventure design include the following elements: Value Propotions
The new value proposition that can be offered is natural destinations.
Channels
The channels or distribution channels owned by Romokalisari Adventure are divided into two types, namely direct and indirect. Direct channel, that is, visitors come directly to Romokalisari adventure. Recommendations for the Romokalisari Adventure business model design are also depicted in the business model canvas which includes additional strategies in the value proportions and channels elements.
CONCLUSION
Conclusions from the research results regarding “Strategy Formulation of Romokalisari Adventure Land as a Sustainable Tourism Destination Using a Business Model Canvas Approach, namely:
- The condition of the Romokalisari Adventure tourist destination based on an evaluation of its internal and external environmental analysis using IFE and EFE shows a medium internal position (average) with a total weight of 2.788 and a moderate external position (medium) with a total weight of 2.795. The internal strength factor with the highest weight is the uniqueness of the quality of natural tourist destinations. Meanwhile, the threat factor with the lowest weight is the Covid-19 pandemic.
- The Business Model Canvas (BMC) currently being implemented by the Romokali Sari Adventure tourist destination is still not optimal.
- Strategies that can be implemented by the Romokalisari Adventure tourist destination using Streghts, Weakness, Opportunities and Threads (SWOT) analysis and Internal – External Factor Evaluation, namely market penetration. The market penetration strategy is a growth strategy for Romokalisari Adventure by increasing tourist visits, namely by increasing promotions and winning the hearts of tourists. Promotion can be increased by carrying out digital marketing both through social media and websites that highlight the advantages and uniqueness of Romokalisari adventure as a tourist destination.
- Recommendations for Romokalisari adventure’s Business Model Canvas (BMC) design
- Value Proportions. The value propositions that can be offered are the uniqueness of the tourist destination and its attractions and price affordability.
- Channels. This can be done by creating a website-based online shop and managing Instagram and Facebook social media. Using a website as a means of increasing interest in visiting potential tourists.
SUGGESTIONS
Based on the conclusions of the research results above, the researcher provides several suggestions as follows:
- At Romokalisari Adventure are:
- Implementing appropriate market penetration strategies, namely by increasing promotions and capturing the interest of potential tourists.
- Adding a strategy to value proportions is to provide a unique natural tourist destination
- Adding website-based marketing communication channels and managing Instagram and Facebook social media.
- In further research, you should: Use other strategy analysis tools such as the Competitive Profile Matrix, SPACE Matrix or Grand Strategy Matrix. Carrying out business financial analysis to measure business development and become a consideration for determining strategy
REFERENCES
- Adiloglu-Yalcinkaya, L., dan Besler, S. (2020). Institutional factors influencing business models : The case of Turkish Airlines. Elsevier – Jurnal of Air Transport Management 91 (2021) 101989.
- Cooper, D.R. dan Schindler, P.S. (2017). Metode Penelitian Bisnis (Business Research Methods). Jakarta : Salemba Empat.
- Creswell, John W. 2014. Penelitian Kualitatif & Desain Riset (Qualitative Research & Research Design). Yogyakarta: PUSTAKA PELAJAR.
- David, F. R. (2011). Strategic Management:Concept and Cases (13th ed.). New Jersey : Prentice Hall.
- Gulo, W. (2002). Metodologi Penelitian (Research methodology). Jakarta: Gramedia Widiasarana Indonesia.
- Hunger, David K. dan Thomas L. Wheelen. (2003). Manajemen Strategis (Strategic Management). Yogyakarta: Penerbit Andi
- Ismayanti. (2010). Pengantar Pariwisata (Introduction to Tourism). Jakarta: Gramedia Widasarana Indonesia.
- Kotler. (2008). Manajemen Pemasaran (edisi ke 11) (Marketing Management (11th ed.). Jakarta: PT. Indeks Kelompok Media.
- Moleong, L. J. (2015). Metode Penelitian Kualitatif (Edisi Revisi) (Qualitative Research Methods (Revised Edition). Bandung : PT Remaja Rosdakarya.
- Osterwalder, A. dan Pigneur, Y. (2010). Bussiness Model Generation. New Jersey : John Wiley & Sons, Inc.
- Pearce, John A. dan Richard B. Robinson. (1997). Manajemen Strategik: Formulasi, Implementasi dan Pengendalian, (Strategic Management: Formulation, Implementation and Control) Jilid I. Jakarta: Binarupa Aksara.
- Polling, B., Mergentheler, M., dan Lorleberg, W. (2016). Professional urban agriculture and its characteristic business models in Metropolis Ruhr, Germany. Elsevier – Land Use Policy 58 (2016) 366 -379.
- Raco, J. R. (2010). Metode Penelitian Kualitatif : Jenis, Karakteristik, dan Keunggulannya (Qualitative Research Methods: Types, Characteristics and Advantages). Jakarta : PT Grasindo.
- Rangkuti, F. 2013. Teknik Membedah Kasus Bisnis Analisis SWOT Cara Perhitungan Bobot, Rating, dan OCAI. Jakarta: PT. Gramedia Pustaka Utama.
- Schmoll, G.A. (1997). Tourism Promotion: Marketing Background, Promotion Techniques and Promotion Planning. London: Tourism International Press.
- Suwena, I.K. dan Widyatmaja, I.G.N. (2017). Pengetahuan Dasar Ilmu Pariwisata (Edisi Revisi) (Basic Knowledge of Tourism Science (Revised Edition). Bali: Pustaka Larasan.