
Appraising the Effectiveness of Value Chain Models of Public-Private Partnership Extension Services on the Productivity Improvement and Livelihood Development of Tea Smallholding Sector in Sri Lanka
- M.K.S.L.D. Amarathunga
- Dilip Jayasinghe
- 2677-2693
- Aug 17, 2024
- Agriculture
Appraising the Effectiveness of Value Chain Models of Public-Private Partnership Extension Services on the Productivity Improvement and Livelihood Development of Tea Smallholding Sector in Sri Lanka
M.K.S.L.D. Amarathunga1* and Dilip Jayasinghe2
1Department of Export Agriculture, Faculty of Animal Science and Export Agriculture Uva Wellassa University, Passara Road, 90000 Badulla, Sri Lanka
2Akkara 29, Bombuwela, Kalutara South, Sri Lanka
*Corresponding Author
DOI: https://dx.doi.org/10.47772/IJRISS.2024.807209
Received: 03 July 2024; Revised: 16 July 2024; Accepted: 17 July 2024; Published: 17 August 2024
ABSTRACT
With the financial constraints and inadequate manpower availability, the public extension network is not sufficiently expanded to fulfill the increasing demand of smallholder needs. Under such a scenario, the emerging partnership extension services between public and private sectors are of paramount importance to provide effective extension services to the tea smallholding sector. This study aims to appraise the factors affecting the success of Public-Private Partnerships extension models (PPP) currently operating, namely Tea Factory Based (FBM), Input Supplier Based (ISBM) and Development Agency Based (DABM). Six key components of a successful partnership, i.e. trust and cohesiveness, motivation to participate, resource sharing, support to achieve long-term expectations, sharing technical information and satisfaction with the model, were used to appraise the success. A pre-tested questionnaire was administered to collect primary data from randomly selected 90 smallholders. Success factors showed a significant relationship with age, experience, tea land extent and productivity. FBM buildup trust and cohesiveness by frequently conducting extension programs and social participation of smallholders in such programmes. ISBM provides significantly higher assistance to tea smallholders sharing resources. DABM highly appraised the livelihood of poorer tea smallholders. Trust and cohesiveness, resource sharing, technical information sharing and motivation to work are the key success factors for straightening the partnership and land productivity of tea small/Middle-level holdings. Therefore, strengthening the success factors of the partnership will enhance the productivity of tea smallholdings and thereby develop their livelihood.
Keywords: Public-Private Partnership, Tea factory-based partnership, Input supplier-based, Development agency-based partnership, Tea smallholders, Extension service
INTRODUCTION
The tea industry in Sri Lanka provides a significant contribution to its national economy by earning foreign exchange for the country and providing employment to about two million people. Total tea production in 2018, was 303.8 million kilograms (Anon, 2018). The tea smallholding sector produces nearly 75% of the total tea production in Sri Lanka, while the regional plantation sector contributes the remaining balance. The research findings reveal that the potential average annual productivity of tea land established with improved cultivars is over 3000 kg/ha/year (Anon,2000). Even though the smallholding sector is the most dynamic and important segment of the tea industry, the average annual productivity was 1958 kg/ha (Anon, 2018), which is far below its potential productivity. Amarathunga (2019) reported that the low productivity of tea smallholding lands could be attributed to the poor adoption of proven technology and essential cultural practices and the limited use of improved varieties for planting. Although tea technologies are being continuously developed, the majority of tea smallholders who are living in remote areas have less opportunities to access for the formal extension services. Therefore, they do not receive an appropriate technical advice for the site-specific problems of their lands as well as a required inputs and financial assistances on time. Although the technology dissemination in the tea smallholdings sector is handled by both public and private organizations, the formal and official extension channel catering to the tea smallholding in the Sri Lanka is Tea Small Holding Development Authority (TSHDA). With the financial constraints and inadequate manpower availability, the above public extension network is not sufficiently expanded to fulfill the increasing demand of smallholder needs. The field extension officer to smallholder ratio at present is nearly 1:2700 (Obeysekara, 2009). The above ratio should be 1:1000 to provide effective extension services. This shows the need for expansion of the TSHDA staff strength as well as the need for more collaborative and partnership approaches to provide better services for the tea smallholders. The extension channels of private organizations such as agro-input and service suppliers are often operating through bought leaf factories and provide information to promote their products (Amarathunga, et al., 2017). These private sector channels indirectly recover their costs through the profit margin of the relevant product/s that they are promoting, and their involvement in disseminating information helps to increase the coverage and effectiveness of the public sector extension services (Obeysekara, 2009). Under this scenario, the emerging partnership extension services between public and private sectors are of paramount importance to provide effective extension services to the tea smallholding sector.
Public-Private Partnership Model
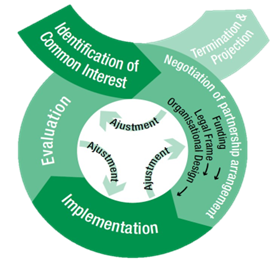
Figure 1 The building process of Public Private Partnership (Hartwich et al., 2008)
The Public Private Producer (PPP) is defined by Spielman & Grebmer, (2004) as any collaborative effort between the public and private sectors, that involve in, and contributes to planning, supply of resources, and activities needed to accomplish a mutual objective. The building building of PPP consists of five phases (Hartwich et al., 2008), namely identifying common interests, negotiating, implementing the partnership, evaluating the partnership and deciding to continue or close the partnership (Figure 1).
The main design of the organization includes representation, decision-making, work organization, information exchange and communication among partners, monitoring and evaluation and administration of financial resources. Success and properly functioning partnerships can be identified by partners’ confidence and understanding among partners and the development of strategic visions that fulfil the partners’ interests. Continuous evaluation is needed, and this evaluation can focus on different criteria. They focus on intermediate and final results and the usefulness of those to partners, the functioning of the partnership, evaluation of the partnership or how to adapt to the partnership. The overall aspect of the evaluation improves the partnership activities (Hartwich et al., 2008). Further more evaluation of such PPP models will help to identify the present situation of their collaboration, strengths, and limitations (Krell et al., 2016).
Hence, this study was carried out to appraise the performance of three Public Private Partnership extension service models operating in the tea smallholding sector in Sri Lanka and identify factors affecting such PPP models’ success.
General objective
To assess the effectiveness of Public-Private Partnership Extension Service Models operating in the Low country in improving the productivity of tea smallholders’ lands and their livelihood development.
Specific objectives
- To assess the effectiveness of three Public-Private partnership extension models, FBM, ISBM and DABM, implemented in the tea smallholding sector in the Low Country
- To understand the relationship between the socio-economic characteristics of tea smallholders and the success of extension partnerships
- To make recommendations on success factors for the improvement of Public-Private Partnership extension models operating in the Low country to provide the most effective extension services to tea smallholding sector
METHODOLOGY
The PPP concept in technology dissemination process of tea smallholdings sector was proposed by Amarathunga et.al. (2020) based on Hartwich’s model (Hartwich et al., 2008). The conceptual framework developed for this study is given in figure. 2.
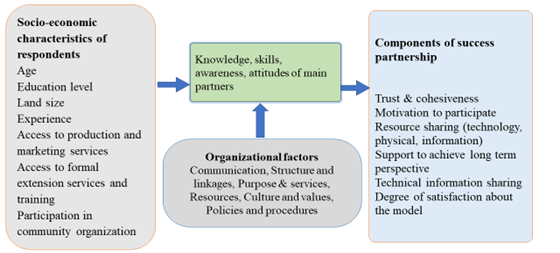
Figure 2. Conceptual framework for the assessing the success of partnership extension models implemented in tea smallholding sector (Amarathunga et.al., 2020)
Three different well established leading partnership extension models i.e. Tea factory-based partnership extension model- (FBM) (Public Private partnership-3P is implemented by the Tea Smallholder Factories PLC., has field extension service for improving productivity and thereby tea smallholder’s livelihood development), Input supplier-based partnership extension model- (ISBM) (Public Private partnerships -3P is implemented the CIC Agribusiness which is a diversified subsidiary that is involved in promoting the use of high-quality agricultural inputs and services) and Development agency-based partnership extension model- (DABM) (Public et al. -4P is implemented by the International Fund for Agricultural Development-IFAD conducting smallholder agri-business project in order to provide better services of funancial and input to tea smallholders) operating in the smallholder tea land in the Low Country region were selected for the study. The above-mentioned partnership models are operating in geographically three different districts such as Galle, Kalutara and Ratnapura districts, and therefore, it prevents one respondent tea smallholder from getting benefits from the above two different partnership extension models.
Table 1: Demographic factors oriented independent variables and the measurements
| Variable | Description | Measurements |
| Age | Age of respondent | Years |
| Gender | Gender of respondent | 1-Male or 0-Female |
| Education level | Education level of respondent | Years |
| Experience | Experience in tea cultivation of respondent | Years |
| Involvement in tea cultivation | Involvement in tea cultivation by tea smallholder and family members | 1 full time or 2 half time, 1 full time & 1 half time, 2 full time & 4 half time |
| The position of tea smallholding society | The position of tea smallholding society | 4 President, Secretary, Treasurer 3 Vice president, Vice Secretary, 2 Member, 1 Not Member |
| Level of participation in CBO activities | Level of participation in CBO activities by tea smallholder | 3Always,2 Sometime,1 Not at all |
| Land use | Tea cultivated the land area | Acres |
| Cultivated cultivars | Cultivar | |
| The productivity of the land | kg/month/acre | |
| Age of tea cultivation | Years |
(Source: Amarathunga et.al,’ 2020)
The primary data was collected by conducting interviews with randomly selected 90 smallholders (30 from each partnership model) and relevant extension partners using a pretested questionnaire schedule (Tables 1 and 2). The questionnaires were subjected to the Cronbach alpha reliability test (Cronbach, 1951), and the reliability coefficient was above 0.7. An expert panel also tested the questionnaires for validity. Six key components of a successful partnership, i.e. trust and cohesiveness, motivation to participate, resource sharing, support to achieve long-term expectations, sharing technical information and satisfaction with the model, were used to assess the success of PPP (Table 3). Secondary data was obtained from various sources such as the TRISL, TSHDA, Central Bank Reports, tea smallholders record books and records of tea factories. Collected data were coded and constructed. Constructs in some variables were made with weights according to Saravanan and Veerabhadraiah (2003) and Amarathunga (2015).
Table 2: Extension servicers oriented independent variables and measurement
| Variable | Description | Measurements |
| Extension service | Types of services provide by partners | Maintenance service, planting services, facilities services. 2 or more services |
| The frequency of participating extension officers | 6-Once/week, 5-Once/month, 4-Once/3 months, 3-Once/ 6 months, 2-Once/year, 1-Never | |
| Reason for participating extension officers | Observe field, training programs, collecting leaves, marketing inputs, 2 or more services | |
| Availability of service | 3-Any time, 2-sometime, 1-not | |
| Usefulness of the service | 3-Very useful, 2-useful,1- not useful | |
| The frequency of conducting extension programs | The frequency of conducting extension programs by extension partners | Number |
| The frequency of participating in extension programs | The level of participation extension programs | 1-Low, 2-Moderate, 3-High |
(Source: Amarathunga et.al,’ 2020)
Table 3: Dependent variables and measurements
| Variable | Description | Measurements |
| Trust and cohesiveness | Level of trust and cohesiveness among partners | 6 constructs |
| Motivation | Level of motivation to work in the model | 6 constructs |
| Resource sharing | Level of resource sharing among the partners | 4 constructs |
| Long term perspective | Level of support to achieve long term perspective | 4 constructs |
| Technology information sharing | Level of technology information sharing among the partners | 4 constructs |
| Degree of satisfaction | Level of satisfaction of partners towards the model | 5 constructs |
(Source: Amarathunga et.al,’ 2020)
Descriptive statistics, one-way ANOVA, and Spearman’s correlation analysis were used to test the relationship between socio-economic factors (age, education level, experience, tea land extent, and productivity) and respondents’ dependent variables. Data analysis was done using SPSS Software.
RESULTS AND DISCUSSION:
Socio-economic characters of respondent tea smallholders
Age range of smallholders: The majority of tea smallholders are aged between 26 and 55, with 30% being over 56 (Department of Census and Statistics, 2005). The mean age of the respondents is 50.88 years, with a standard deviation of 10.78. Interestingly, 11.1% of smallholders under 35 are involved in the tea sector, indicating some interest from younger individuals. The majority of smallholders in various models are within the 36 to 65 age group (Table 4).
Table 4. Distribution of respondent tea smallholders according to age, education level and the model
| Characteristic | Factory-based model (n = 30) | Input supplier-based model (n = 30) | Development agency-based model (n = 30) | Frequency (n=90) | Percentage (n=90) |
| Age (years) | |||||
| Up to 35 | 13.3 | 13.3 | 6.7 | 10 | 11.1 |
| 36 – 50 | 33.3 | 26.7 | 36.7 | 29 | 32.2 |
| 51 – 65 | 46.7 | 56.7 | 46.7 | 45 | 50.0 |
| >65 | 6.7 | 3.3 | 10.0 | 06 | 6.7 |
| Education level | |||||
| Grade 5 – 8 | 0 | 6.7 | 3.3 | 03 | 3.3 |
| GCE (O/L) | 63.3 | 80.0 | 90.0 | 70 | 77.8 |
| GCE (A/L) | 33.3 | 13.3 | 06.7 | 16 | 17.8 |
| Diploma | 3.3 | 0 | 0 | 01 | 1.1 |
According to the Department of Census and Statistics (2005), the majority (60%) of tea smallholders are below GCE (O/L) in education level. 7.9% of tea smallholders passed GCE (A/L), and 7.9% have a degree or higher education qualifications (Obesekara, 2009). The majority (77.80%) of the tea smallholders belong to the GCE (O/L) education category (mean = 11.24 and SD = 1.20) (Table 4.1). One tea smallholder has a diploma, and 17.8% of tea smallholders faced GCE (A/L) examination 11.1% faced in the art stream, 4.4% faced commerce and 22% from the science stream. Smallholders with good educational backgrounds had good attitudes about extension services of the public and private institutes, and they actively participated in answering the questions when collecting data more than others. Also, they try to develop and maintain their tea cultivations properly. One-third of respondents had studied up to GCE (A/L) in the factory-based model (Table 4). Respondents in the development agency-based model, 90.0% of the respondents have studied up to GCE (O/L). In the input supplier-based model, 80% of respondents had studied up to GCE (O/L) (Table 4.). The majority of the tea smallholders have good education backgrounds due to good schooling facilities in these areas.
Cultivated tea land extent:
The distribution of respondent tea smallholders according to tea land extent is shown in Table 5.
Table 5 Distribution of respondent tea smallholders according to tea cultivated land extent and partnership model
| Land extent (acres) | Percentage | ||
| Factory-based model (n = 30) | Input supplier-based model (n = 30) | Development agency-based model (n = 30) | |
| Less than 1.0 or 1.0 | 26.7 | 60.0 | 66.7 |
| 1.1 -2.0 | 30.0 | 33.3 | 26.7 |
| 2.1 – 3.0 | 10.0 | 6.7 | 3.3 |
| 3.1 – 5.0 | 16.7 | 0 | 3.3 |
| > 5 | 16.7 | 0 | 0 |
Respondents’ tea land extent varied from 0.25 acres to 6.5 acres. The majority (51.1%) of the respondents have less than 1 acre of tea land. The mean extent of the tea land is 1.68 acres (SD = 1.46). 5.6 % of the respondents have more than 5 acres of tea land extent (Table 5).
No respondents had more than 3 acres of tea land in the input supplier-based model and no respondents had more than 5 acres of tea land in the development agency-based model. In the factory-based extension model, tea land extent ranged from 0.50 acres to 6.5 acres (Table 4.3).
Respondents (98.9%) are tea smallholders who have the proper road facilities to access the tea land and can take vehicles near their land, and 1.1% do not have good road facilities to access the tea land.
Productivity of the tea lands of the respondents
The productivity of green leaves varies from 1,778.40 kg/ha/yr to 23,712.00 kg/ha/yr, with a mean of 10,236.08 kg/ha/yr (SD = 4,699.12). The productivity of processed tea leaves ranges from 373.46 kg/ha/yr to 4,979.52 kg/ha/yr, with a mean of 2,149.58 kg/ha/yr (SD = 986.82). 12.2% of the respondents have a productivity of less than 1000 kg/ha/yr for processed tea, while the majority (35.6%) of smallholders produce 1001 – 2000 kg/ha/yr of processed tea.
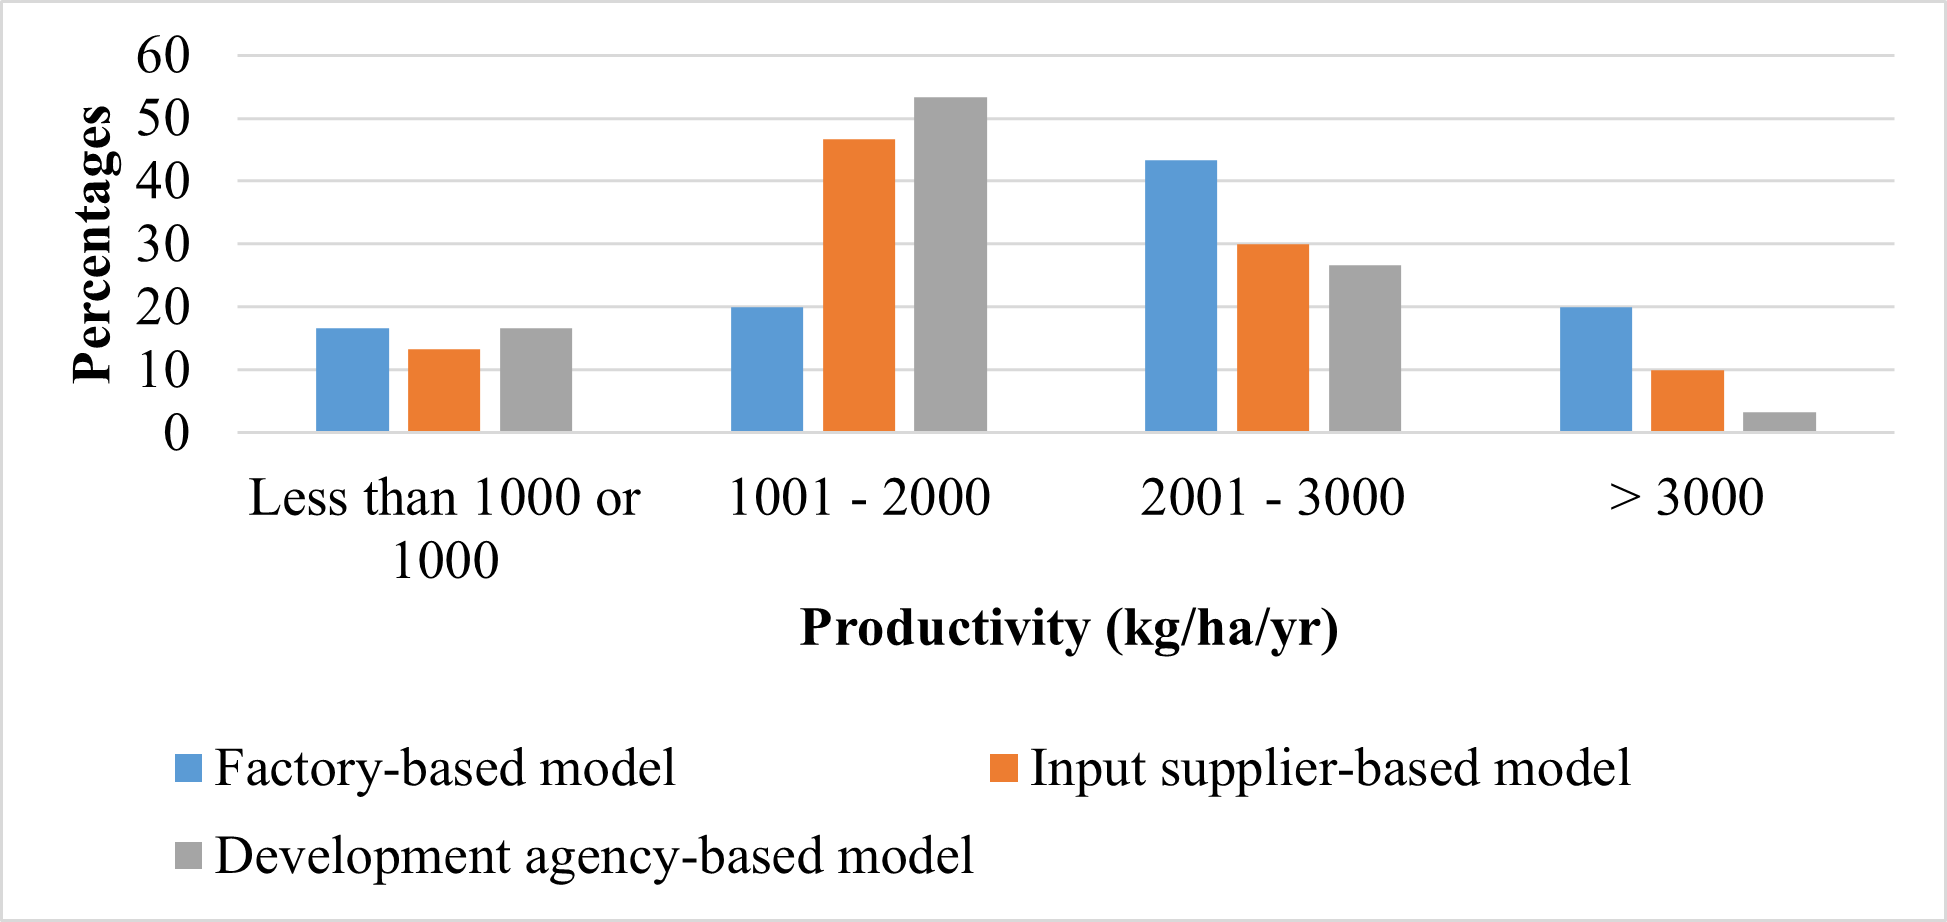
Figure 3. Made tea productivity changes in the tea lands of respondents according to the partnership model
Based on the TSHDA (2015) report, the average productivity of made tea is 2,123 kg/ha/yr. However, in this study, majority of the smallholders had very low productivity. This could be due to the lack of a proper infilling program among tea smallholders and low productivity of aging plants in the field (Figure 3).
In the factory-based model, the productivity ranges from 711.45 kg/ha/yr to 4979.52 kg/ha/yr, with a mean of 2528 kg/ha/yr and a standard deviation of 1150.36. The total made tea production of the respondents in this model is 75,862.18 kg/ha/yr.
In the input supplier-based model, the total made tea production of the respondents is 62,620.14 kg/ha/yr. The productivity ranges from 746.93 kg/ha/yr to 3734.64 kg/ha/yr, with a mean of 2087.34 kg/ha/yr and a standard deviation of 873.08.
For the development agency-based model, the total made tea production of the respondents is 54,979.50 kg/ha/yr. The productivity ranges from 373.46 kg/ha/yr to 3734.64 kg/ha/yr, with a mean of 1832.65 kg/ha/yr and a standard deviation of 803.95.
Tea smallholders’ experience in tea cultivation
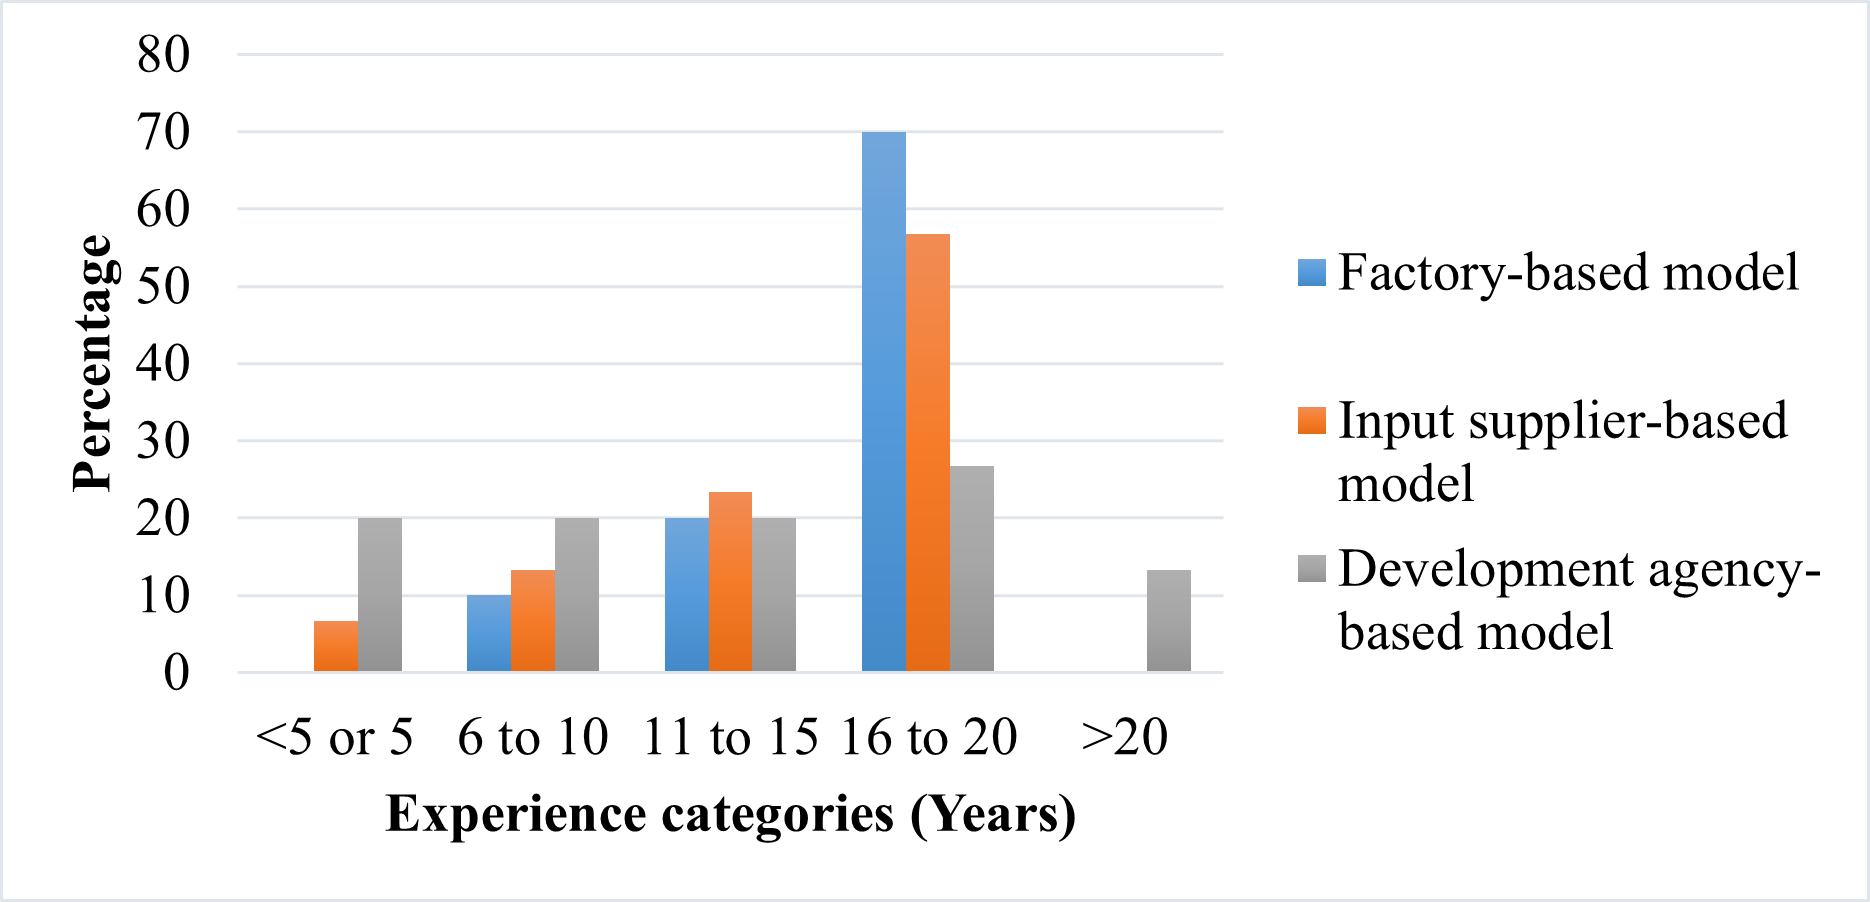
Figure 4: Distribution of respondent tea smallholders according to experience in tea cultivation and partnership model
In factory-based model majority (70%) of the respondents have 16 to 20 year experience (Mean = 26.90 years and SD = 9.54). Mean of the experience in development agency-based model is 14.30 years (SD = 7.97). In input supplier-based model mean of the experience on tea cultivation is 24.17 years (SD = 8.11). The factory-based model has a high mean value for experience in tea cultivation (Figure 4).
The average age of the tea plants of the responded tea smallholders
The tea plants have an average age ranging from 2.4 to 30 years, with a mean age of 11.63 (standard deviation = 6.54). The majority of the tea plants (26.7%) have an average age ranging from 5 to 10 years, while 13.3% of the tea plants are 30 years old. Approximately 52.3% of the tea plants have an average age between 5 and 15 years.
The situation of households and their participation in tea cultivation of the responded tea smallholders
The majority of households (67.8%) consist of 3 to 5 members. Only 14.4% of the respondents have more than 5 members in their households, while 17.8% have one or two family members (with a mean of 3.43 and a standard deviation of 0.99).
In terms of family involvement in tea cultivation, 31.1% have one member participating full-time, and 21.1% have one member fully involved and another member partially involved. The highest percentage (46.7%) involves two family members being fully involved. Only 1.1% have two members fully involved and one member partially involved.
Social Participation in Tea Smallholders’ Societies
Nearly one-fourth (23.3%) of the respondents were not members of any tea smallholder society, and 38.9% do not participate in tea smallholders’ society meetings.
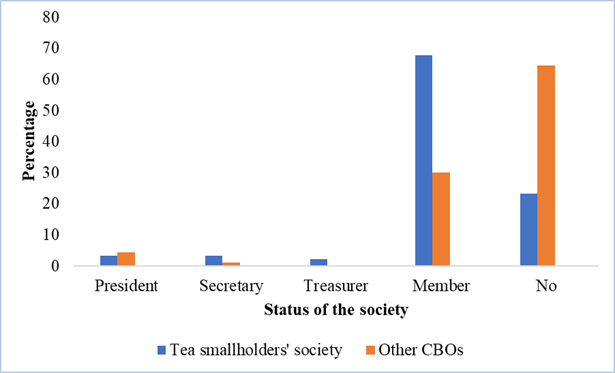
Figure 5. Status of respondent tea smallholders in tea smallholder societies and other CBOs
Only 8.8% of the respondents hold leadership positions in tea smallholder societies, while 23.3% of the respondents are not members of any tea smallholder society (Figure 5). In the last 3 months, 4.4% of the respondents highly participated in tea smallholder society meetings, 23.3% had a medium level of participation, 33.3% had a low level of participation, and 38.9% did not participate at all. The reasons for changes in participation in tea smallholders’ society include low interest, unfair incidents in the societies, and societies not functioning well. The majority (71.1%) of the respondents do not participate in other Community-Based Organizations (CBOs), and 64.4% of the respondents are not members of any CBOs. Reasons for this include a lack of interest in participating and unfair benefit sharing.
Access for extension services and training for responded tea smallholders
Figures 6 and 7 show frequencies of meeting public and leading partners by respondent tea smallholders
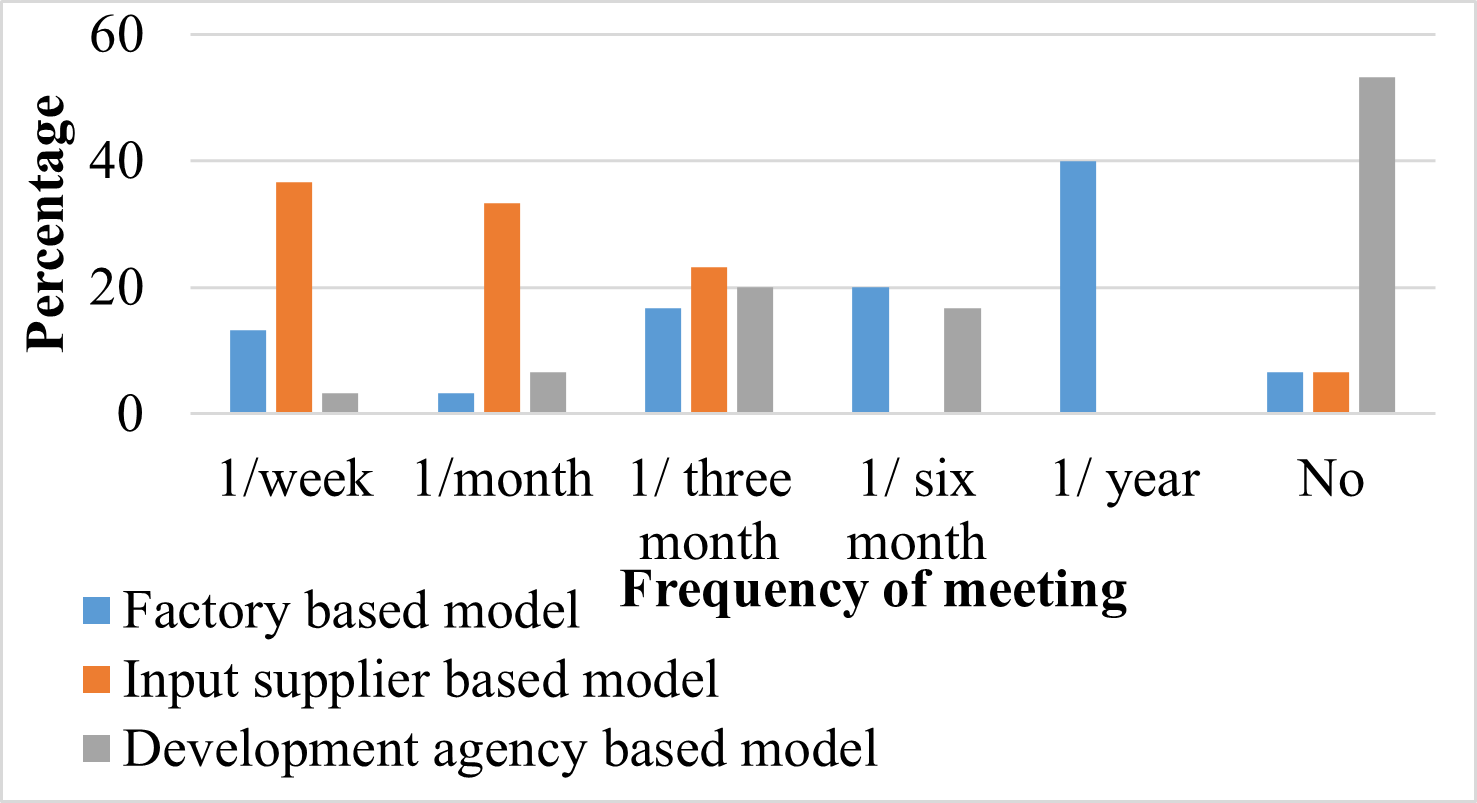
Figure 6: Frequency of meeting public partners by respondents
In the factory-based partnership model, all the respondents meet the leading partner once a week, while meetings with the public partner are infrequent. In the input supplier-based model, 91.9% of the respondents meet the leading partner at least once every six months, and 93.3% of the respondents meet the public partner at least once every three months. In the development agency-based model, the majority (53.3%) of respondents do not receive public service, but 50% of the respondents meet the leading partner at least once per month to receive extension service (Figures 6 and 7).
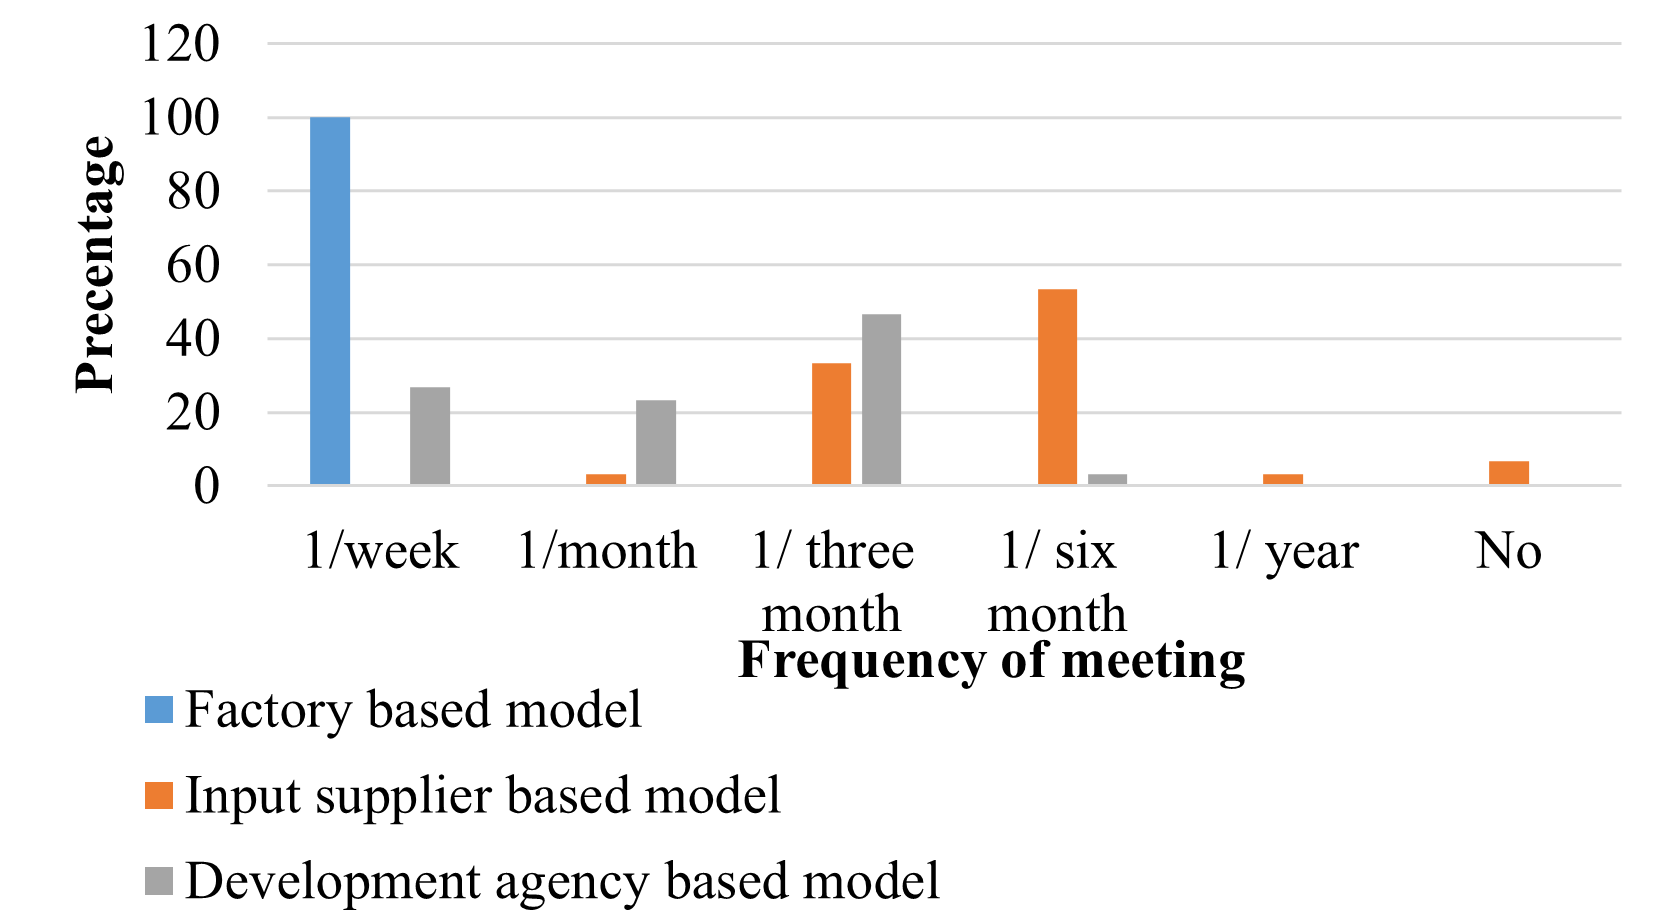
Figure 7. Frequency of meeting leading partners by respondents
In the factory-based partnership model, public partners offer three main categories of services: planting, maintenance, and facilitation. 80% of the respondents receive at least 2 of these services, and 60% find the services useful while 33.3% find them very useful. Private partners provide 2 or more services to the respondents and 90% find these services very useful.
Table 6. Percentages of participation respondent tea smallholder in partnership extension programs
| Level of participation | Percentage | ||
| Factory-based model (n = 30) | Input supplier-based model (n = 30) | Development agency-based model (n = 30) | |
| No | 0 | 16.7 | 83.3 |
| Low | 16.7 | 20 | 16.7 |
| Medium | 46.7 | 56.7 | 0 |
| High | 36.7 | 6.7 | 0 |
In the input supply organization-based model, 90% of the respondents receive two or more services from the public partner and 63.3% find them very useful. From the private partner, 80% of the respondents receive maintenance services, with 46.7% finding them very useful and an equal percentage finding them useful.
In the development agency-based model, 53.3% of smallholder tea respondents do not receive any services from the public partner, while 6.7% receive 2 or more services. 53.3% of the respondents feel that the services from the public partner are not enough. From the private partner, 63.3% receive planting services, 23.3% receive no services, and 6.7% receive 2 or more services.
A significant proportion of small-scale tea farmers take part in extension programs under the factory-based model (Mean = 2.2) and the input supplier-based model (Mean = 1.53). However, tea smallholders’ participation in extension programs is considerably lower under the development agency-based model (Mean = 0.17) (Table 6). In this model, partners conducted fewer extension programs for tea smallholders.
Access to marketing and finance
a. Facilities for selling tea leaves and buying fertilizers
Tea smallholders have three main methods for selling their green tea leaves. In the factory-based partnership model, 86.6% sell their leaves to partners through factory leaf collectors, while 13.4% sell directly to the factories. In the development agency-based model, 56.7% sell through private leaf collectors, and 40% sell through factory leaf collectors. In the input supply organization-based model, 50% sell through private leaf collectors, and 46.7% sell through factory leaf collectors. When it comes to buying fertilizer, the majority of smallholders in the factory-based partnership model (73.3%) purchase fertilizer through factory leaf collectors. In the input supplier-based model, 50% buy fertilizer through factory leaf collectors. In the development agency-based model, 56.7% buy through private leaf collectors, 33.3% through factory leaf collectors, and 6.7% through fertilizer shops.
b. Facilities for respondent tea smallholders for finance
All of the tea smallholders surveyed are aware of the financial assistance (subsidies) provided by TSHDA. However, only 38.9% of them actually utilize this assistance. It was found that 38.9% of the tea smallholders surveyed obtained loan facilities from tea factories to develop their cultivations. A loan program is being implemented by the tea factories to help smallholders replant their tea lands. Additionally, a development agency-based model has implemented an infilling program and a loan program to improve the condition of the respondents’ tea lands.
Assessing the effectiveness of three Public-Private partnership extension models
As a result of conducting more frequent collaborative extension activities, TSHDA officials have more opportunities to meet their tea smallholders in FBM and ISBM models (Table 7 and Figure 8). Therefore, the level of trust and cohesiveness between TSHDA and tea smallholders is significantly higher in the factory-based model (FBM) and input supplier-based model (ISBM) than the development agency-based model (DABM) (p < 0.01).
Table 7 Mean level of components of success according to tea smallholders
| Components of success | Partnership1 | FBM | ISBM | DABM |
| Trust and cohesiveness among the partners | A | 27.39** | 27.34** | 18.34 |
| B | 21.0** | 26.79** | 10.41 | |
| C | 27.39** | 27.34** | 18.34 | |
| Level of the motivation of partners to participate in the model | A | 21.24** | 25.04** | 14.64 |
| B | 16.88* | 22.08** | 8.96 | |
| C | 28.64** | 21.96 | 20.24 | |
| Level of resource sharing among the partners | A | 17.1* | 20.65** | 12.1 |
| B | 13.85* | 18.7** | 7.25 | |
| C | 23.85** | 17.45 | 16.35 | |
| Level of model support to achieve long term perspective | 12.79* | 11.37 | 10.04 | |
| Level of technical information sharing in the model | 24.36** | 20.42** | 16.38 | |
| Level of satisfaction about the partnership model | 27.68** | 23.53* | 19.29 | |
(Source: Amarathunga et.al,’ 2020) **Significant at 0.01 *Significant at 0.05,
1 A – Partnership b/w TSHDA & Tea smallholders, B – Partnership b/w TSHDA & Leading partner, C – Partnership b/w Leading partner & Tea smallholders
The DABM has conducted a Smallholder Agri-business Project (SAP) in cooperation with the regional staff of TSHDA and other model partners. Therefore, there is a high level of trust and cohesiveness between TSHDA officials and smallholders and between other partners and smallholders.
The level of motivation amid TSHDA and the leading partners to participate in the model is significantly higher in ISBM than the other two partnership models (p < 0.01). A leading partner in ISBM provides sponsors for extension programs, and they conduct more frequent collaborative extension activities.
As a result of frequent contact with smallholders by the other factory base extension coordinators for the purpose of continuation of the green leaf supply chain in a sustainable manner, the level of motivation among leading partners and tea smallholders to participate in the model is significantly higher in the FBM than other two partnership models (p < 0.01).
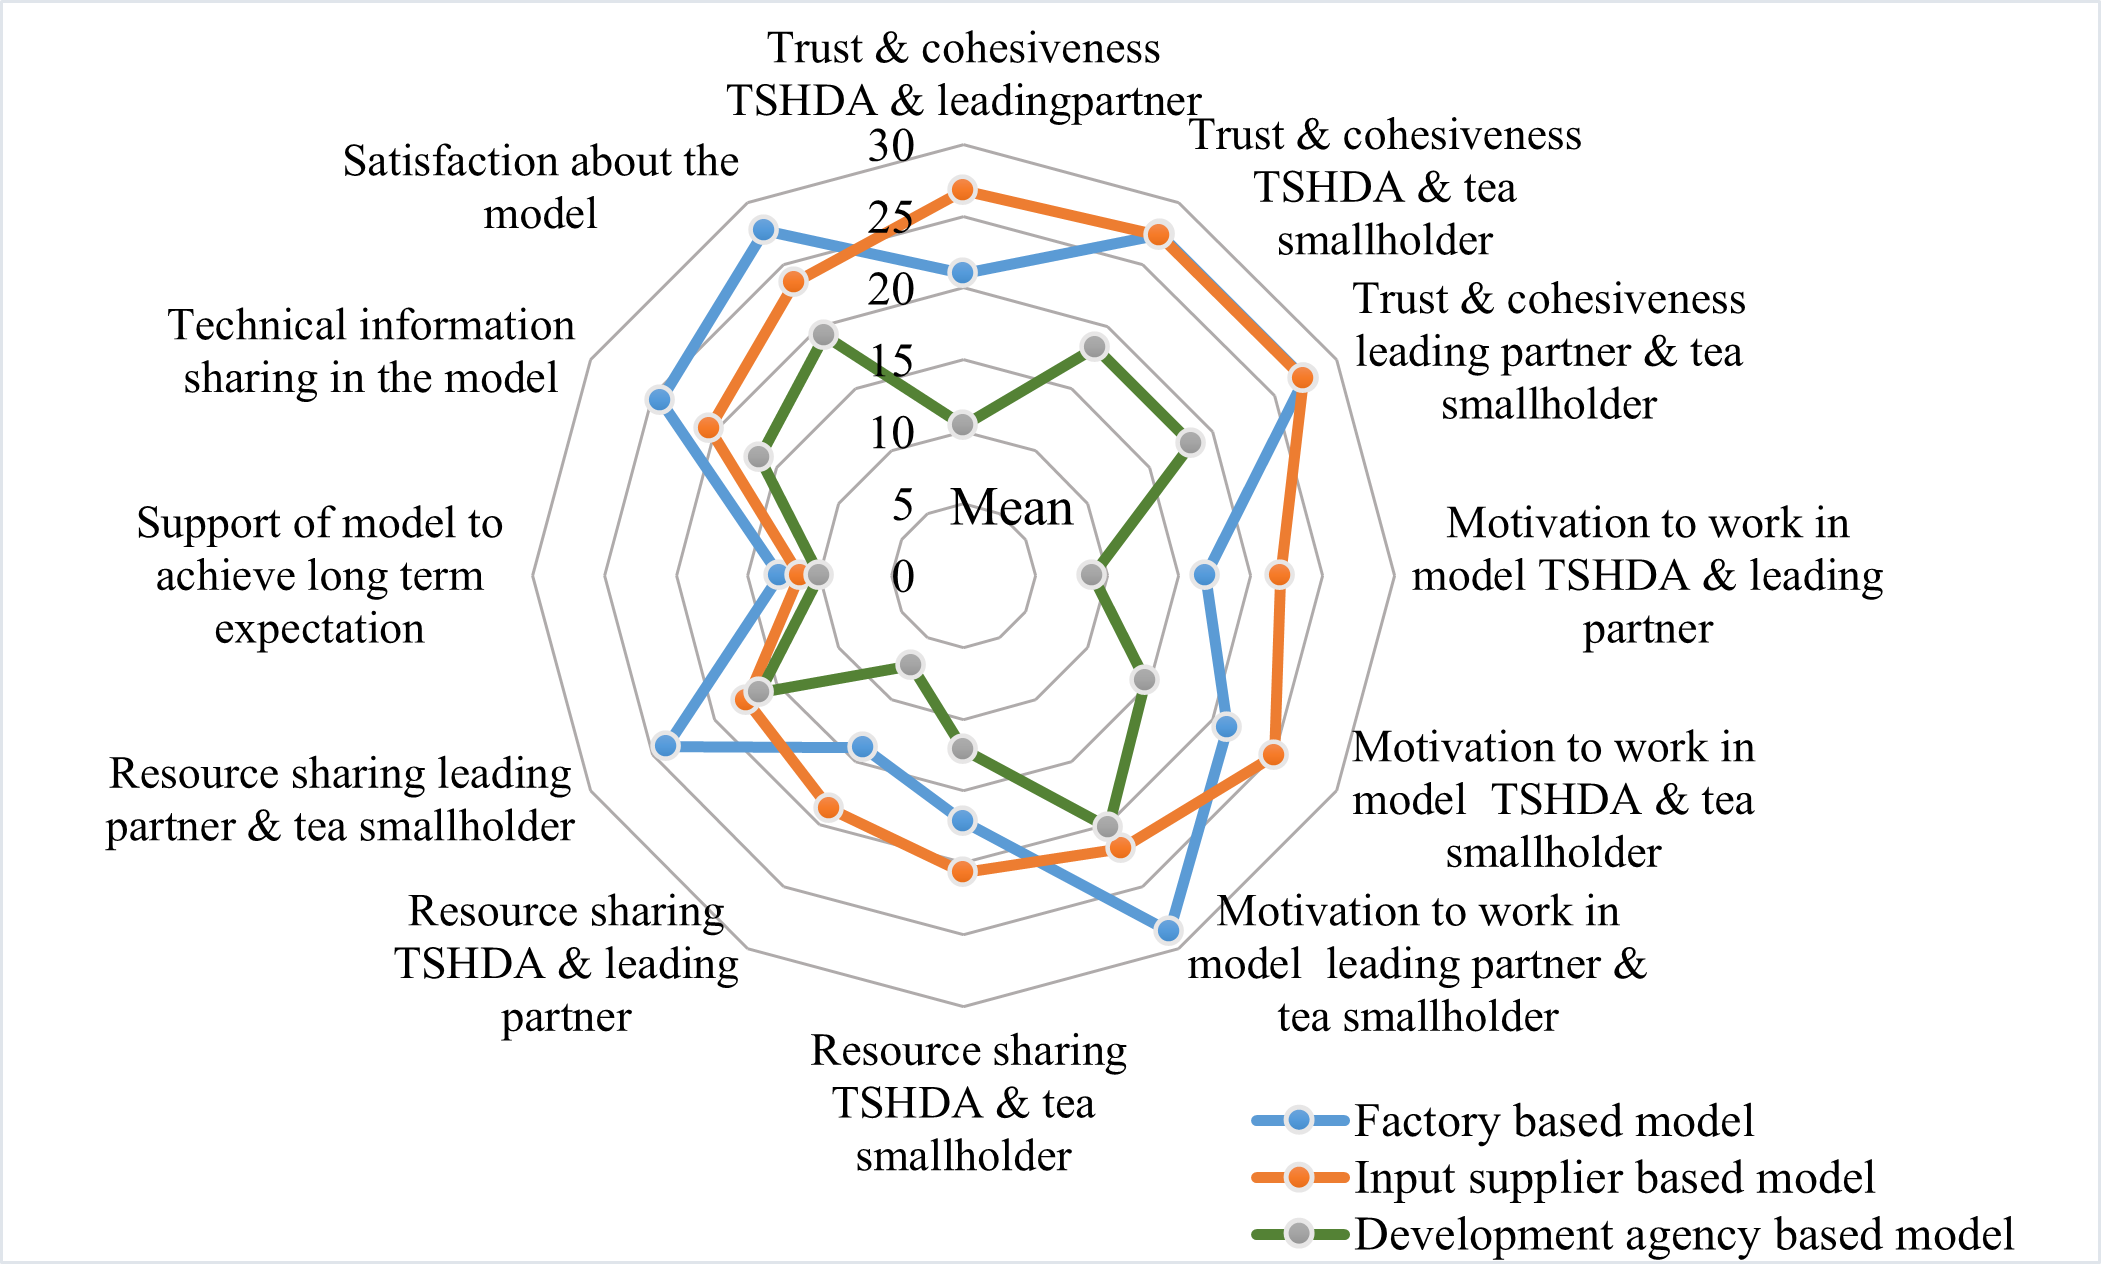
Figure 8: Mean comparison of factors of success partnership according to respondent tea smallholders
The level of resource sharing among TSHDA and tea smallholders is significantly higher in the FBM than in the DABM (p < 0.05). FBM coordinates to get land development subsidies for tea smallholders from TSHDA. The factory extension team facilitates financial support to smallholders for improving land productivity in the short term as well as the long term, it also conducts Extension programs frequently and provides inputs such as fertilizer, agro equipment, nursery plants, etc.
As a result of the leading partner providing sponsorships for TSHDA extension programs, the Level of resource sharing between TSHDA and leading partners is significantly higher in the ISBM than in the other two partnership models (p < 0.01). The level of resource sharing between the leading partners and tea smallholders is also significantly higher in the FBM than in ISBM and DABM (p < 0.01). Tea smallholders benefited from loans, bonuses, and machines to succeed by leading partners, and tea smallholders provided quality tea leaves to leading partners in FBM.
Relationship between socioeconomic characteristics and the success of extension partnerships
A positive association was observed between the extent of smallholders in the tea land and the level of trust and cohesiveness in the FBM (Table 8). Tea factories always expect more green leaves to reach the capacity of the factory and, hence, are motivated to maintain a close relationship with tea smallholders who have a higher extent of tea land and more focus on maintaining close rapport with the elderly and experienced smallholders who are willing to motivate for sharing of their knowledge and resource with neighbouring smallholders.
As a result of conducting more frequent collaborative extension activities, TSHDA officials have more opportunities to meet their tea smallholders in FBM. Therefore, level of trust and cohesiveness between TSHDA and tea smallholders is significantly higher in the factory-based model (p < 0.05). The factory extension team facilitates financial support to smallholders in order to improve land productivity in the short term as well as the long term, it also conducts Extension programs frequently and provides inputs such as fertilizer, agro equipment, nursery plants, etc. Additionally, they have conducted community and social relationship programs, such as heath camps, welfare society, and annual bonus scheme for their smallholders and family members attached to each factory supply base.
Table 8. Correlation between socio-economic characteristics of smallholders and success factors on FBM
| Factors of success | Age | Education level | Experience | Tea extent | Productivity | |||||
| r value | Sig. (p) | r value | Sig. (p) | r value | Sig. (p) | r value | Sig. (p) | r value | Sig. (p) | |
| Trust and cohesiveness | 0.09 | 0.96 | -0.12 | 0.53 | 0.04 | 0.85 | 0.36 | 0.04* | 0.14 | 0.45 |
| Motivation to participate | 0.18 | 0.36 | -0.02 | 0.93 | 0.20 | 0.29 | 0.43 | 0.02* | 0.31 | 0.1 |
| Resource sharing | 0.17 | 0.36 | -0.11 | 0.57 | 0.17 | 0.36 | 0.34 | 0.07 | 0.26 | 0.17 |
| Support to long term expectation | 0.02 | 0.99 | 0.12 | 0.52 | 0.08 | 0.69 | -0.02 | 0.92 | 0.21 | 0.26 |
| Sharing of information | 0.36 | 0.04* | -0.19 | 0.32 | 0.41 | 0.03* | -0.10 | 0.61 | 0.74 | 0.70 |
| Level of satisfaction | 0.23 | 0.22 | -0.10 | 0.59 | 0.32 | 0.09 | 0.16 | 0.41 | 0.13 | 0.50 |
(Source: Amarathunga et.al,’ 2020)
*Correlation is significant at a 0.05 level
Motivation of smallholders through frequent social participation for such extension and welfare programs will enhance the level of trust and cohesiveness between Factory extension staff and tea smallholders. These positive partnership associations will help to enhance the productivity of nuclear middle-level holdings as well as their surrounding peer smallholdings. Further partners in the factory-based model will benefit when their tea factories receive higher quantities of green leaves to operate the factories at full capacity. Therefore, they highly motivate to tea smallholders who have higher land extent. Therefore, strengthening the success factors of the partnership will enhance the productivity of tea’s small and middle holdings and also bring benefits to all stakeholders in the bought-leaf supply chain to varying extents.
Table 9 shows that positive association between tea smallholders who have higher land extents with the success factors of the ISBM model, such as Trust and cohesiveness (p < 05), motivation to social participation (p < 01) and resource sharing. Leading partners in ISBM provide sponsors for extension programs, and they are conducting more frequent collaborative extension activities.
Table 9 Correlation between socio-economic characteristics of tea smallholders and success factors on ISBM
| Factors of success | Age | Education level | Experience | Tea extent | Productivity | |||||
| r value | Sig. (p) | r value | Sig. (p) | r value | Sig. (p) | r value | Sig. (p) | r value | Sig. (p) | |
| Trust and cohesiveness | -0.10 | 0.6 | 0.19 | 0.31 | 0.37 | 0.04* | 0.40 | 0.03* | -0.42 | 0.02* |
| Motivation to participate | -0.05 | 0.80 | 0.31 | 0.10 | 0.37 | 0.04* | 0.47 | 0.01** | -0.47 | 0.01** |
| Resource sharing | 0.05 | 0.80 | 0.29 | 0.12 | 0.47 | 0.01** | 0.53 | 0.01** | -0.49 | 0.01** |
| Support to long term expectation | 0.04 | 0.84 | 0.05 | 0.08 | 0.17 | 0.38 | 0.37 | 0.04* | -0.20 | 0.30 |
| Sharing of information | 0.10 | 0.58 | -0.07 | 0.70 | 0.25 | 0.18 | 0.39 | 0.03* | -0.31 | 0.10 |
| Level of satisfaction | -0.01 | 0.96 | 0.14 | 0.47 | 0.23 | 0.23 | 0.47 | 0.01** | -0.02 | 0.29 |
(Source: Amarathunga et.al,’ 2020)
**Correlation is significant at 0.01 level, *Correlation is significant at 0.05 level
Input suppliers may focus on motivating smallholders who have a greater extent of tea lands to promote their products and develop the market for their products. The studied all success factors on effective partnership are positively associated with the land extent of smallholder lands whilst those factors are negatively associated with land productivity. Additionally, extension staff of this model also positively interact and motivate experienced smallholders for the strengthening of their input supply base, and partners may maintain good mutual understanding with old customers to retain further with the model.
According to the analysis, it was evident that the leading extension partner of the DABM was more concerned with the development of tea smallholders with smaller lands than the large extent of land (Table 10). The public partner and leading partner of this model have paid more attention to uplifting the livelihood of the poorer segment of smallholders who have smaller tea extent. Partnerships in DABM showed a positive association among success factors such as sharing information and inputs (distributing nursery plants for infilling) with the long-term expectation of enhancing the productivity of smallholding (p < 0.01).
Table 10 Correlation between socio-economic characteristics of tea smallholders and success factors on partnership in DABM
| Factors of success | Age | Education level | Experience | Tea extent | Productivity | |||||
| r value | Sig. (p) | r value | Sig. (p) | r value | Sig. (p) | r value | Sig. (p) | r value | Sig. (p) | |
| Trust and cohesiveness | 0.26 | 0.16 | 0.27 | 0.14 | 0.26 | 0.16 | -0.41 | 0.02* | 0.32 | 0.09 |
| Motivation to participate | 0.31 | 0.10 | 0.21 | 0.28 | 0.20 | 0.29 | -0.38 | 0.04* | 0.27 | 0.15 |
| Resource sharing | 0.29 | 0.12 | 0.22 | 0.25 | 0.23 | 0.23 | -0.38 | 0.04* | 0.31 | 0.10 |
| Support to long term expectation | 0.50 | 0.01** | 0.15 | 0.44 | 0.13 | 0.50 | -0.46 | 0.01** | 0.37 | 0.04** |
| Sharing of information | 0.39 | 0.04* | 0.29 | 0.12 | 0.32 | 0.07 | -0.31 | 0.10 | 0.36 | 0.04* |
| Level of satisfaction | 0.36 | 0.06 | 0.06 | 0.76 | 0.04 | 0.82 | -0.47 | 0.01** | 0.24 | 0.20 |
**Correlation is significant at 0.01 level, *Correlation is significant at 0.05 level
(Source: Amarathunga et.al,’ 2020)
To strengthen the partnership, extension partners in DABM will provide more benefits for their old customers. DABM has conducted the Smallholder Agri-business Partnership Project (SAP) to enhance the land productivity of the poorer segment of smallholders by coordinating between the regional staff of TSHDA and other leading partners of the model. Therefore, it was observed that there is a high level of trust and cohesiveness between TSHDA officials and smallholders and between other partners and smallholders.
However, these interactions are not significant compared with the same components studied in relevant groups of the other two partnership models. It was also observed that all success factors on effective partnership are positively associated with the productivity of smallholder lands, whilst the level of technical information sharing and support to achieve long-term expectations have a significantly positive association with the productivity of smallholding. Therefore, strengthening the success factors of the partnership will enhance the productivity of tea smallholdings
CONCLUSIONS:
- FBM Extension partners build more trust and cohesiveness with their tea smallholders by more frequently conducting extension programs and social participation of smallholders for such programs.
- Productivity showed a significant negative relationship with trust and cohesiveness, resource sharing, and motivation, while the above parameters have a positive correlation with higher tea extent in the ISB model.
- DABM was highly focused on long-term expectations of productivity improvement and livelihood development of poorer tea smallholders.
- Extension partners of FBM and ISBM are more concerned about strengthening Trust and cohesiveness with elderly, experienced middle-level holders who have a larger area of land, more resources, and capacities. They are willing to motivate neighboring smallholders to share their knowledge and resources.
- Trust and cohesiveness, resource sharing, technical information sharing, and motivation to work are the key success factors for straightening the partnership and land productivity of tea small/middle-level holdings. Therefore, strengthening the success factors of the partnership will enhance the productivity of tea smallholdings and thereby develop their livelihoods.
RECOMMENDATIONS:
Based on the findings and conclusions, it is recommended that when planning strategies for the establishment of effective public-private partnership extension models in the tea smallholding sector, the following policy-level recommendations should be considered:
- Prioritize Long-term Expectations: DABM’s focus on long-term expectations of productivity improvement and livelihood development for poorer tea smallholders should be taken into account. Government policies and private initiatives should align with long-term goals and provide support for sustainable improvement and development.
- Empower Elderly and Experienced Smallholders: Extension partners should specifically focus on building trust and cohesiveness with elderly, experienced middle-level smallholders who have a larger area of land, more resources, and capacities. Policies should aim to support and empower these smallholders to become mentors and leaders within the community.
- Encourage Knowledge and Resource Sharing: Policies should promote and incentivize the sharing of knowledge, resources, and technical information among smallholders. This can be achieved through targeted training programs, creating platforms for knowledge exchange, and providing support for collaborative initiatives.
- Foster Social Participation: Extension programs should emphasize social participation of smallholders. Policies should encourage and facilitate the active involvement of smallholders in extension programs, decision-making processes, and community development activities to strengthen trust and cohesiveness.
- Address Productivity Challenges: There is a need to address the significant negative relationship between productivity and trust, cohesiveness, resource sharing, and motivation. Policies should aim to identify the root causes of this relationship and implement targeted interventions to improve productivity while fostering collaboration and trust among smallholders.
- Strengthen Success Factors: Policies should focus on strengthening the key success factors, including trust and cohesiveness, resource sharing, technical information sharing, and motivation to work. This can be achieved through capacity building, investment in infrastructure, and creating supportive environments for partnership development.
- Promote Inclusive Partnerships: Extension models should ensure that all smallholders, including those with smaller landholdings, are included in partnership initiatives. Policies should promote inclusive practices and provide support for the participation of smallholders of varying capacities and resources.
By incorporating these recommendations into policy-level strategies, it is possible to establish effective public-private partnership extension models that can positively impact the productivity and livelihoods of tea smallholders.
REFERENCES
- Amarathunga M.K.S.L.D., Jayasinghe J, Mapatuna Y and Thalagoda.S,(2020) Assessment on Performance of Partnership Extension models Implemented in Tea Smallholding Sector in Sri Lanka. International Index Journal AGROSYM (Volume 5, Issue 1; ISSN 2490-3434 – Printed; ISSN 2490-3442)
- Amarathunga, M.K.S.L.D. (2019) Public Private Partnership Extension Model for Tea Smallholding sector. Textbook, Publisher Scholars press, International Book Marketing service Ltd 17, Meldrum, street, Beau Bassein, 71569, Mauritius, p 1-263.
- Amarathunga, M.K.S.L.D., Wanigasundera, W.A.D.P. and Wijeratne M. (2017) ‘Clientele satisfaction towards the Public-Private Partnership Extension Model introduced for technology dissemination in tea smallholdings sector in Sri Lanka’, Tropical Agricultural Research, 347 – 363.
- Anon, (2002) Annual Report- 2002, Talawakelle, Sri Lanka: Tea Research Institute of Sri Lanka.
- Anon (2017) Annual Report- 2017, Battaramulla, Sri Lanka: Tea Smallholdings Development Authority.
- Anon (2018) Annual report 2018, Colombo: Central bank of Sri Lanka.
- Cronbach, L.J. (1951) Coefficient alpha and the internal structure of tests, Available at: Psychometrical 16 (3), 297–334(Accessed: https://doi.org/10.1007/BF02310555).
- Hartwich, F., Tola, J., Engler, A., Gonzalez, C., Ghezan, G., Alvardo. J.M.P.V., Silva J.A., Espinoza, J.D.J., and Gottret M.V. (2008) Building Public-Private Partnership for Agriculture Innovation, Washington: International Food Policy Research Institute.
- Krell R.K., Fisher M.L., and Steffey K.L. (2016) ‘A Proposal for Public and Private Partnership in Extension’, Journal of Integrated Pest Management, pp. 1-10.
- Obeysekara, K.G.B. (2009) Agricultural extension in the tea small holding sector in Sri Lanka. Experiences and challengers in agricultural extension: meeting farmer needs, Peradeniya: Sri Lankan Agricultural Extension Association, pp. 160 -181.
- Saravanan R. and Veerabhadraiah V. (2003) ‘Clientele satisfaction and their willingness to pay for Public and Private Agricultural Extension Services’, Tropical Agricultural Research, pp. 87 – 97.
- Spielman D.J. and Grebmer, K. V. (2004) Public-Private Partnership in agricultural research: Analysis of challenges facing industry and the consultative group on international agricultural research, Washington: International Food Policy Research Institute.