Bioremediation of Crude Oil Polluted Soil by Cyanobacteria and Bacterial Consortium in Izombe Community of Imo State, Nigeria.
- Vitus Ikechi Onyeneho
- Ugochukwu Chukwuma Okafor
- Chijioke Christian Aniekwu
- Chisom Ejelugha
- 225-237
- Apr 7, 2024
- Environmental Impact
Bioremediation of Crude Oil Polluted Soil by Cyanobacteria and Bacterial Consortium in Izombe Community of Imo State, Nigeria.
Vitus Ikechi Onyeneho1, Ugochukwu Chukwuma Okafor2, Chijioke Christian Aniekwu2 Chisom Ejelugha3
1Public Health Department, National Open University of Nigeria.
2Department of Applied Microbiology and Brewing, Faculty of Biosciences, Nnamdi Azikiwe University, Awka, Nigeria.
3Department of Science Laboratory Technology, Imo State Polytechnic Omuma, Imo State
DOI: https://doi.org/10.51584/IJRIAS.2024.90322
Received: 28 February 2024; Revised: 11 March 2024; Accepted: 16 March 2024; Published: 07 April 2024
ABSTRACT
The bioremediation of Crude Oil Polluted Soil by Cyanobacteria and bacteria consortium was done using random sampling method. Two sets of soil samples were collected (Sample A and B). Sample A, 1.0 kg each of the oil polluted soil was collected from ten points at a depth of 15cm to give a total of 10kg of soil sample; while sample B, 2.0 kg each of the unpolluted soil was also collected from ten points on the site at a depth of 15cm to give a total of 20kg of soil sample for the biodegradation. The samples were homogenized, collected in a sack bag and immediately transported to the Laboratory for analysis. Cyanobacteria and Indigenous bacteria were isolated and identified using standard methods to molecular level. Synechoccocus elongates and Microcystis holsatica were identified as Cyanobacteria; while Pseudomonas, Bacillus, Aeromonas, Enterobacter and Corynebacterium identified as bacteria. Physicochemical parameters, heavy metals of the bacteria isolates were also determined. Inoculum development and biodegradation experiment was carried out in standard laboratory condition. The soil sample was autoclaved, divided into four parts of 5kg each and was poured into sterile transparent bucket labeled X, Y, Z and C. To prevent any fungal, bacterial and cyanobacterial activity, 0.25 g/kg each of nystatin, streptomycin, CuSO4 was added to the respective buckets. Bacterial growth of each set of samples was measured by viable counts on nutrient agar; pH, temperature and moisture content were also measured. The depletion on the total hydrocarbon was monitored using gas chromatography, while heavy metals were monitored using Atomic Absorption Spectroscopy. The data generated were analyzed using analysis of variance (ANOVA) and Duncan alpha test at p≤ 0.05. The result shows that the pH level after the experiment decreased from 6.17 to 5.85, 6.17 to 6.04 and 6.17 to 5.92 for set up X, Y and Z respectively, thus showing a level of acidity. The moisture content increased progressively rom6.20 to 14.10,6.20 to 11.0 and 6.20 to 13.8 for the three set up respectively, the temperature recorded 31oC to 32oC for all the set ups, which shows that the isolates were mesophiles. Heavy metals concentrations were drastically reduced after three months; for instance, Arsenic showed a highest reduction from 5.10ppm – 0.10ppm for set up Y. Silicon shows the highest reduction of 10.81ppm – 0,10ppm for set up Z. Zinc in set up X decreased from 19.36ppm – 0.15ppm, Lead in set up Y decreased from 3.11ppm – 0.39ppm. Mercury and Nitrate showed a reduction of 0.06ppm – 0.04ppm, and 2.85mg/kg – 4.07mg/kg for set up Y respectively. Phosphate recorded an increase of 2.1mg/kg – 44.03mg/kg. The findings of this study obviously established the ability of Cyanobacteria and bacteria consortia in the different set ups to degrade crude hydrocarbon. The setup Y performed best in the heavy metals’ concentration reduction followed by Setup X then finally Setup Z which was the lowest in performance. This shows that the combination of Cyanobacteria and bacteria can be used in cleanup of heavy metal and total petroleum hydrocarbon in a polluted area, which has been the most severe environmental problems facing Nigeria.
Key words: Bioremediation; Heavy metals; Crude Oil; polluted soil; Cyanobacteria; Bacteria consortium
INTRODUCTION
Bioremediation involves the use of living microorganism to remove, neutralize or transform pollutants from a contaminated site. The objective of bioremediation is to immobilize contaminants or to transform them into products that will no longer be hazardous to the environment. Biodegradation denotes complete microbial mineralization of complex organic compounds into simple inorganic constituents such as carbon (IV) oxide, water and minerals as well as biomass. In aquatic and terrestrial environments, the biodegradation of crude oil and other petroleum complexes predominantly revolves around the actions of bacterial and fungal populations [1]. Biodegradation of hydrocarbons, a product from crude oil is often relatively slow under normal conditions due to the complex interaction that involves hydrocarbons, the environment and the composition of the microbial community. Hydrocarbons interact with the environment and microorganisms determining the fate of the contaminant relative to their chemical nature and microbial degradative capabilities. This is affected by environmental factors that influence microbial activities and absence of inhibitors of metabolism [2].
Crude oil is Nigeria’s and the world’s most important derived energy source [3]. It is a raw material that is refined to petroleum and other petroleum products through fractional distillation. Due to growth and activities of petroleum and petroleum associated industries in Nigeria and world over, there have been increased occurrences of petroleum oil pollution in our environment. The characteristics of crude oil has made it one of the most significant pollutants in the environment as it is capable of causing serious damages to humans and the ecosystem [4]. In Nigeria, oil producing areas especially the Niger Delta have a devastating experience of oil spillages on both the terrestrial and aquatic environments in the past 50 years of crude oil exploration and production [5]. The Niger Delta is among the ten most significant wetland and marine ecosystems in the world whose ecosystem has been severely damaged by petroleum pollution due to poorly managed oil exploration activities [6]. Contamination of surface water with petroleum hydrocarbon is reportedly among the most severe environmental problems facing Nigeria [7]. The contamination of water bodies by crude oil has adverse effects on aquatic organisms and impacts negatively on the ecosystem [8]. Physical and chemical methods of remediation are the first response option though they do not achieve complete remediation of contaminated sites. Mechanical methods currently in use can recover little percentage of crude after a major spill and most times leave the contaminated site in worse conditions [8].
Cyanobacteria have been recognized as an excellent source of vitamins, proteins and have a great deal of potential as a source of fine chemicals, biofertilizer and renewable fuel [9]. They are photosynthetic prokaryotes that capture sunlight for energy using chlorophyll and various accessory pigments. The metabolic activities such as photosynthesis performed by cyanobacterial cells can affect the oxygen and pH conditions of the surrounding water and change the amounts of available organic compounds and nutrients as well as abundances of antibacterial compounds [10]. For example, many planktonic cyanobacterial species can fix atmospheric nitrogen and convert it into forms which can be accessed by other organisms. Some species of cyanobacteria can fix atmospheric nitrogen, which may aid biodegradation mainly in nutrients limited environments. Biodegradation studies conducted previously showed that the rates of oil biodegradation increase when nitrogen and phosphorus are provided [11]. The associated hydrocarbonoclastic bacteria are held in mucilagenous sheaths of the cyanobacteria to prevent washing out. The oxygen released by the cyanobacteria through photosynthesis is utilized by the bacteria while the carbon dioxide released by the bacteria through degradation processes is utilized by the cyanobacteria, hence forming a mutualistic relationship.
The association of cyanobacteria and aerobic heterotrophic bacteria appear to signify a promising consortium favorable for breakdown and remediation of crude oil polluted sites [12]. The difficulty encountered in cultivating cyanobacteria in axenic culture represents the relationship between cyanobacteria and bacteria. Also,[13] established that the aerobic heterotrophic bacteria associated with Oscillatoria were responsible for the biodegradation of n-alkanes in their study. This shows that they could be utilized together for bioremediation of oil polluted sites. In spite of findings showing the potential of cyanobacteria to utilize many organic compounds, an irrefutable proof is still not yet available. It is doubtful to conclude that cyanobacteria with the ability to fix CO2 by photosynthesis also utilize oil constituents to get organic carbon. The ability to utilize external carbon source which is known as heterotrophy is so uncommon in cyanobacteria [14]. Despite the fact that much is now known about cyanobacteria and their effects on natural aquatic microbial communities, there is little report on their possible effects on crude oil biodegradation [11]. Much is yet to be known about cyanobacteria and its biodegradation potential on soil. Therefore, the aim of this study is to determine the hydrocarbon degradation potential of cyanobacteria isolated from oil polluted soil and their ability to remediate crude oil polluted soil in Izombe community in Imo state.
MATERIAL AND METHODS
Study Area: This study was carried out in Izombe community, located at Oguta Local Government area of Imo State, Nigeria. This community is also part of the areas where oil exploration and production activities commenced since 1960s. Four major multinational oil companies including Chevron, Texaco, Shell and Addax Petroleum operate in the area producing over 70% of total oil from the community. Oguta LGA is the major oil producing area in Imo State and is located within the Southwest senatorial district of the state.
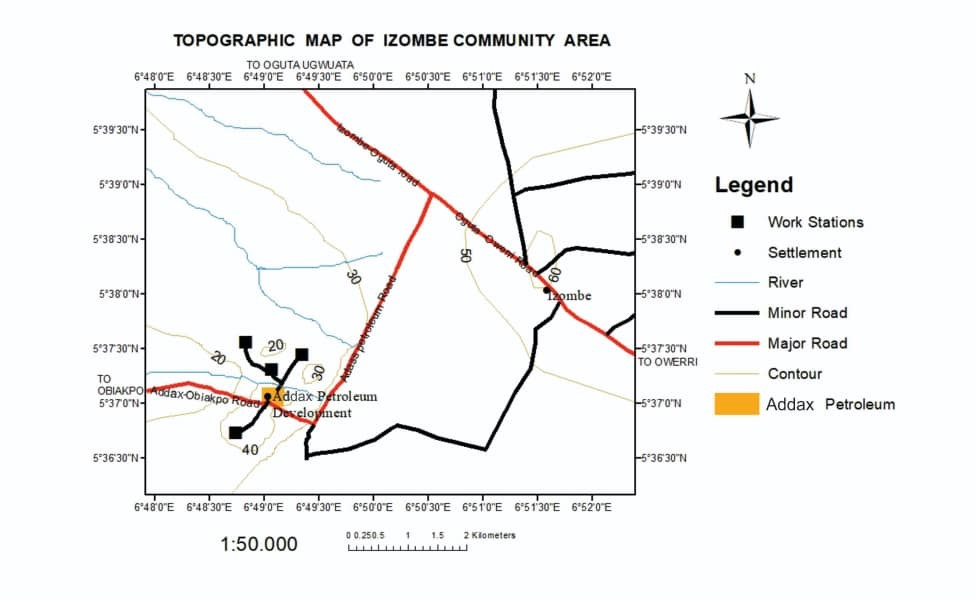
Fig 1: Location of Izombe Community on the maps
Sample Collection: Soil Samples were collected from Addax Petroleum Development in Izombe community, two sets of soil samples were collected (Sample A and B). For Sample A, 1.0 kg each of the oil polluted soil was collected from ten random points on the site at a depth of 15cm to give a total of 10kg of soil sample for microbial isolation. For Sample B, 2.0 kg each of the unpolluted soil was collected from ten random points on the site at a depth of 15cm to give a total of 20kg of soil sample for the study. Samples from the site were collected by random sampling method using auger. The samples were homogenized, collected in a sack bag and immediately transported to Microbiology Laboratory, Nnamdi Azikiwe University, Awka to be analyzed and to determine the physicochemical parameters, heavy metals and isolate the indigenous bacteria and cyanobacteria.
Physicochemical Analysis of Crude Oil Polluted and Unpolluted Soil Samples: Physicochemical properties includes pH, moisture content, temperature, and total petroleum hydrocarbon content of the soil samples were determined using standard methods according to [15].
Heavy Metal Analysis of Crude Oil Polluted and Unpolluted Soil Samples: Heavy metals including arsenic, silicon, copper, iron, zinc, lead and mercury were analyzed using Varian AA240 Atomic Absorption Spectrophotometer according to [16]. 2.0g of the soil sample was weighed and transferred into a muffle furnace. The soil was heated in the furnace for 2 hours at 5500C. After heating, the sample was diluted with 20 ml of 20% H2SO4, filtered with filter paper and made up to 50 ml with distilled water, while the preparation of Reference Solution was prepared by series of standard metal solutions in the optimum concentration range, the solutions were prepared daily by diluting the single stock element solutions with water containing 1.5ml concentrated nitric acid/litre. A calibration blank was prepared using all the reagents except for the metal stock solutions. Calibration curve for each metal was prepared by plotting the absorbance of standards versus their concentrations.
Enumeration, Isolation and Biochemical Identification of the Bacterial and Cyanobacteria Isolates: The enumeration of total heterotrophic bacteria was carried out using the method adopted by [17]. One gram of the polluted soil was transferred into 9.0 ml of sterile distilled water. Exactly 1.0 ml aliquot amount was aseptically transferred into 9.0 ml amount of sterile dilution blank (10-1 dilution). The sample was diluted in tenfold serial dilution up to 10-8 dilutions. Nutrient agar media was prepared and poured into petri dishes and allowed to set. Using sterile adjustable pipette tips, 100 µl aliquot (0.1 ml) of inoculum from 10-7 dilution was inoculated onto the sterile disposable Petri dish which had been poured with nutrient agar respectively in triplicates. The plates were subsequently incubated in an incubator at 35 ± 2oC for 24 hours. The plates were observed for growth and colonies observed were counted and multiplied by reciprocal of the dilution and reported as colony forming units per g (cfu/g); while the isolation of Aerobic Heterotrophic Bacteria using the method adopted from [18]. The colonies from the total culturable aerobic heterotrophic bacteria (TCHB) counts for polluted soil were picked based on their colonial morphology. The selected colonies were subsequently purified by sub culturing onto nutrient agar plates. The isolates were characterized based on their cultural characteristics, cell morphology, and biochemical tests. Cyanobacteria were isolated using the method adopted from [1] BG-13 medium. For isolation, 2.0g of the soil sample was inoculated into the BG-13 medium in a flask and placed near the window for sunlight in order to aid photosynthesis. The culture was incubated under room temperature, night and day until growth was observed within two weeks. Nystatin, cycloheximide and chlorampenicol were added to the culture medium during preparation at a concentration of 0.1mg/ml to prevent fungal and bacterial contamination.
The cyanobacterial colonies growing on the BG-13 medium were picked by a sterile wire loop and were transferred aseptically into 50 ml of sterile BG-13 medium. The mixed culture was incubated for 2 to 4 weeks under the conditions described previously in order to obtain sufficient cyanobacterial biomass, and then 400µl of a sterile nutrient solution (SNS) consisting of 2.5% (wt/vol) sucrose, 0.5% (wt/vol) yeast extract, and 0.5% (wt/vol) Bacto-Peptone was added along with 400 RI of sterile antibiotic solution [Aqueous stock solutions (0.5% [wt/vol]) of cefoxitin, ampicillin, penicillin G, imipenem, and cycloheximide (1.25% [wt/vol]) were prepared fresh, sterilized by filtration, and added to a cooled broth media] to give a final antibiotic concentration of 100 µg/ml. The culture then was incubated for 18 to 24 h. After incubation, the cyanobacteria were harvested by centrifugation at 17,000 x g for 15 min at 25°C. It was then pipetted and plated onto BG-13 agar containing nystatin and cycloheximide. The plates were incubated for 2 to 4 weeks and observed at weekly intervals for the growth of cyanobacteria. Purified colonies of cyanobacteria were picked and transferred to plates of BG-13 agar. The purity of isolates were observed by light microscopy and by inoculating cyanobacterial growth into BG-13 broth supplemented with 0.01% (wt/vol) (each) glucose, yeast extract, and Bacto-Peptone and into GNB broth medium, which consisted of 1.0% (wt/vol), glucose and 0.8% (wt/vol) nutrient broth. Broth cultures were incubated at 25°C with shaking at 180 to 200 rpm under ambient atmosphere and statically under anaerobic conditions in an anaerobic jar. The culture was judged axenic as there was no growth of heterotrophic bacteria.
The isolates were subjected to biochemical tests for identification. The various cultural appearances of the isolated pure cultures were recorded, followed by the microscopic and biochemical test to identify the isolates. Microscopic and biochemical tests were done using the standard method according to [18]; thus include Gram’s staining, methyl red and voges proskauer (MRVP) Test, catalase test, coagulase test, indole test, citrate test, oxidase test, urease activity, motility test, glucose and lactose were used for the bacterial sugar fermentation.
Biodegradation Experiment: The level of crude oil degradation by the microbial consortia was tested using soil sample collected from an unpolluted soil. The soil sample was autoclaved, divided into four parts of 5kg each and was poured into sterile transparent bucket labeled X, Y, Z and C. The Escravos light crude oil (obtained from Chevron Nigeria Limited) which met the intervention limit of 3000mg/kg – 5000mg/kg for the test was autoclaved at 121oC for 15 minutes, cooled to room temperature, and 10 % v/kg of the sterile Escravos light crude oil was introduced into the buckets respectively. 0.5L of the escravos crude oil was added to 5kg of soil in each setup. To prevent any fungal, bacterial and cyanobacterial activity, 0.25 g/kg each of nystatin, streptomycin, CuSO4 was added to the respective buckets. The buckets containing the unpolluted sterile soil and the sterile crude oil were then marked as setup X, Y, Z and C. To SETUP X, 200 ml of culture suspension of the bacteria consortium was inoculated; to SETUP Y, 200 ml of culture suspension of the cyanobacteria was inoculated; to SETUP Z, 200 ml each of culture suspension of bacteria and cyanobacteria consortia were inoculated while SETUP C served as the control where no organism was inoculated. After inoculation of the setups with bacteria and cyanobacteria consortia from a broth culture of the bacteria and cyanobacteria, the setups were incubated at room temperature near a transparent glass window to allow rays of sunlight to reach the setups and were monitored throughout the experimental period of 90 days. Bacterial growth was measured by viable counts on nutrient agar; pH, temperature and moisture content were also measured in the four buckets. The depletion of the total hydrocarbon content was also monitored using gas chromatography (GC-FID) and the heavy metals were monitored using Atomic Absorption Spectroscopy (AAS).
Table 1: Composition of the Biodegradation Experimental Setup
| SETUPS | COMPOSITION |
| SETUP X | Unpolluted sterile soil + crude oil + Bacteria consortium + Nystatin + CuSO4 |
| SETUP Y | Unpolluted sterile soil + crude oil + Cyanobacteria + bacteria consortium + Nystatin. |
| SETUP Z
SETUP C |
Unpolluted sterile soil + Crude oil + Cyanobacteria + Nystatin + Streptomycin
Unpolluted sterile soil + Crude oil |
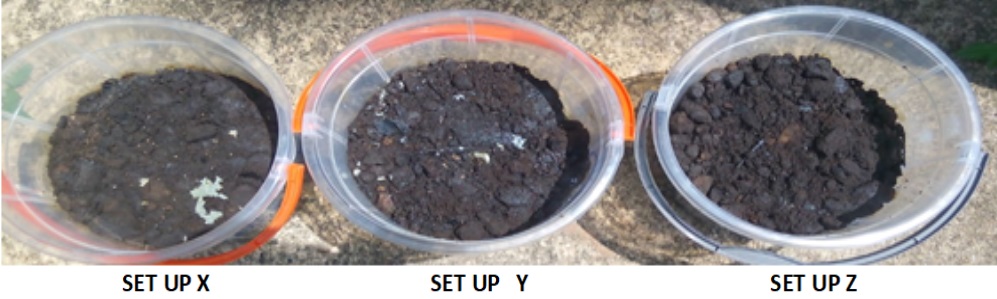
Fig 2: Composition of the Biodegradation Experimental Setup
Data Analyses: The data generated were analyzed using analysis of variance (ANOVA) and Duncan alpha test at p≤ 0.05 as shown in the Appendix II. A comparison was considered statistically significant if the p value was < 0.05.
RESULTS
Change in pH in the Biodegradation Setups:
The change in pH during the biodegradation is shown in Table 1. The pH of setup X decreased from 6.17 to 5.85, setup Y decreased from 6.17 to 6.04 while setup Z decreased from 6.17 to 5.92 during the biodegradation period. The control setup decreased from 6.17 to 5.85.
Table 1: Changes in pH in the Biodegradation Setups
| Time (months) | Setup X | Setup Y | Setup Z Setup C |
| 0 | 6.17a±0.01 | 6.17a±0.01 | 6.17a±0.01 6.17a±0.01 |
| 1 | 5.98a±0.01 | 6.10b±0.10 | 5.94a±0.01 5.96a±0.01 |
| 2 | 5.93a±0.01 | 6.07b±0.01 | 5.93a±0.01 5.89ab±0.00 |
| 3 | 5.85a±0.01 | 6.04c±0.01 | 5.92b±0.01 5.85a±0.01 |
Setup X: Bacteria
Setup Y: Bacteria + Cyanobacteria
Setup Z: Cyanobacteria
Setup C: Control
Results are in Mean± Standard deviation
Means in the same row with same superscript are not significantly different (p>0.05)
Changes in Moisture Content (%) in the Biodegradation Setups
The change in moisture content during the biodegradation is shown in Table 2. The moisture content of the setup X increased from 6.20 to 14.10%, for setup Y it increased from 6.20 to 11.0% and setup Z, it increased from 6.20 to 13.80% during the three (3) months biodegradation test; in control setup it increased from 6.20 to 13.95.
Table 2: Changes in Moisture (%) Content in the Biodegradation Setups
| Time (months) | Setup X | Setup Y | Setup Z | Setup C |
| 0 | 6.20a±0.10 | 6.20a±0.10 | 6.20a±0.10 | 6.20a±0.10 |
| 1 | 8.95a±0.01 | 10.20d±0.10 | 9.10b±0.10 | 9.93c±0.01 |
| 2 | 8.05c±0.01 | 9.40d±0.10 | 7.70a±0.10 | 7.88b±0.01 |
| 3 | 14.10d±0.10 | 11.00a±0.50 | 13.80b±0.10 | 13.95c±0.01 |
Setup X: Bacteria
Setup Y: Bacteria + Cyanobacteria
Setup Z: Cyanobacteria
Setup C: Control
Results are in Mean± Standard deviation
Means with the same superscript in a row are not significantly different (p<0.05)
Changes in Temperature (°C) in the Biodegradation Setups
The changes in temperature of the setups X, Y, Z and C are presented in Table 3. Setup X recorded the highest temperature (32.30°C) at the end of the experiment and lowest temperature (31°C) at the first month. Setup Y recorded 32.00°C at the start of the experiment and lowest temperature 30.80°C at the second month. Setup Z recorded the highest temperature of 32.7°C at the second month and 30.4°C at the second month. Setup C recorded the highest temperature of 32.35°C at the second month and lowest temperature of 30.70°C at the second month.
Table 3: Changes in Temperature in the Biodegradation Setups
| Time (months) | Setup X | Setup Y | Setup Z Setup C |
| 0 | 32.00a±1.00 | 32.00a±1.00 | 32.00a±1.00 32.00a±1.00 |
| 1 | 31.00a±1.00 | 31.60bc±0.10 | 30.40b±0.02 30.70c±0.10 |
| 2 | 32.00b±1.00 | 30.80a±0.10 | 32.70c±0.10 32.35c±0.01 |
| 3 | 32.30c±0.20 | 32.00b±1.00 | 31.00a±1.00 31.65d±0.01 |
Setup X: Bacteria
Setup Y: Bacteria+ Cyanobacteria
Setup Z: Cyanobacteria
Setup C: Control
Results are in Mean± Standard deviation
Means with the same superscript in a row are not significantly different (p<0.05)
Changes in Physicochemical Properties and Heavy Metal Analysis in the Biodegradation Setups X, Y and Z
There were notable changes in the physicochemical content in the biodegradation setups during the experiment as presented in Table 4. Nitrate in Setup Y increased from 2.85 mg/kg to 4.07 mg/kg, and phosphate in Setup Z increased from 2.16 mg/kg to 44.03 mg/kg while sulphate in Setup Z reduced from 14.20 mg/kg to 1.29 mg/kg.
There were reductions in the concentration of the heavy metals during biodegradation. Arsenic decreased from 5.10 ppm at the start of the study to 0.10 ppm after the experimental period of three months in Setup Y which was the best decrease observed. The highest decrease for silicon was observed in Setup Z which decreased from 10.81 ppm to 0.10 ppm. Copper in Setup Y decreased from 2.42 ppm to 1.45ppm. A little decrease in Iron in Setup X from 21.40 ppm to 21.06 ppm; zinc in Setup X decreased from 19.36ppm to 0.15ppm lead in Setup Y decreased from 3.11 ppm to 0.39 ppm, and mercury in Setup Z decreased from 0.06 ppm to 0.02 ppm. Setup Y performed best in heavy metal reduction in all the four experimental setups while there was no significant decrease or increase in the heavy metal concentration observed in the control setup as presented in Table 4.
Table 4: Changes in the Physicochemical Properties of the Biodegradation Setups
| Parameters | Start | Setup X (End) | Setup Y (End) | Setup Z (End) | Control |
| Nitrate (mg/kg) | 2.85a±0.01 | 3.09b±0.00 | 4.07d±0.01 | 3.57c±0.01 | 2.71a±0.01 |
| Sulphate(mg/kg) | 14.20d±0.10 | 12.34b±0.01 | 13.20c±0.10 | 1.29a±0.00 | 14.21d±0.01 |
| Phosphate (mg/kg) | 2.16b±0.01 | 1.86a±0.01 | 21.11c±0.01 | 44.03d±0.01 | 2.18b±0.01 |
| Total nitrogen (%) | 0.16a±0.01 | 1.00d±0.00 | 0.62cd±0.02 | 0.22ab±0.01 | 0.16a±0.00 |
| Organic carbon (%) | 0.08ab±0.01 | 0.09b±0.00 | 0.10d±0.00 | 0.06a±0.01 | 0.08a±0.01 |
Setup X: Bacteria
Setup Y: Bacteria+ Cyanobacteria
Setup Z: Cyanobacteria
Setup C: Control
Results are in Mean± Standard deviation
Means with the same superscript in a row are not significantly different (p<0.05)
Heavy Metal Analysis of the Unpolluted and Polluted Soil Samples:
The heavy metal analysis of the unpolluted and polluted soil samples is shown in Table 5. Arsenic of the unpolluted soil is 0.45ppm while that of the polluted soil is 5.36ppm. Silicon of the unpolluted soil is 0.18ppm while that of the polluted soil is 11.22ppm. Copper of the unpolluted soil is 0.61ppm while that of the polluted soil is 0.43ppm. Iron of the unpolluted soil is 16.43ppm while that of the polluted soil is 21.40ppm. Zinc of the unpolluted soil is 1.56ppm while that of the polluted soil is 19.48ppm. Lead of the unpolluted soil is 0.25ppm while that of the polluted soil is 3.11ppm. Mercury of the unpolluted soil is 0.02ppm while that of the polluted soil is 0.06ppm.
Table 5: Heavy metals of the Unpolluted and Polluted Soil Sample
| Parameters | Unpolluted Soil Sample (Concentration) | Polluted Soil Sample(Concentration) | |
| Arsenic (ppm) | 0.45a±0.01 | 5.36b±0.02 | |
| Silicon (ppm) | 0.18a±0.01 | 11.22b±0.02 | |
| Copper (ppm) | 1.61a±0.10 | 0.43b±0.01 | |
| Iron (ppm) | 16.43a±0.01 | 21.40b±0.01 | |
| Cadmium (ppm) | 0.00a±0.00 | 0.00a±0.00 | |
| Zinc (ppm) | 1.56a±0.01 | 19.48b±0.01 | |
| Lead (ppm) | 0.25a±0.01 | 3.11b±0.01 | |
| Mercury (ppm) | 0.02a±0.01 | 0.06b±0.01 | |
Results are in Mean± Standard deviation.
Means with the same superscript in a row are not significantly different (p<0.05)
Enumeration, Isolation and Biochemical Identification of the Bacterial and Cyanobacteria Isolates
Exactly Five (5) bacteria genera Pseudomonas, Bacillus, Aeromonas, Enterobacter and Corynebacterium were identified from the crude oil polluted site in Sample A using Gram’s staining and biochemical tests as shown in Table 6.
Table 6: Characteristics of Bacterial Isolates from the Crude Oil Polluted Site in Sample A
| Isolate code | Gram reaction | Morphology | Catalase test | Oxidase test | Motility | Lactose | MR | VP | Indole | Citrate | Urease | Glucose | Colour | Identity |
| IC6 | _ | Rods | + | + | + | – | – | – | – | + | – | – | Blue-green | Pseudomonas sp. |
| IC2 | – | Rods | + | – | – | – | – | + | + | + | – | + | Cream | Aeromonas sp. |
| IC1 | – | Rods | + | – | – | + | – | – | – | + | – | + | Cream | Enterobacter sp. |
| IC7 | + | Rods | + | – | – | – | + | – | – | – | + | + | Cream | Corynebacterium sp. |
| IC8 | – | Rods | + | + | + | – | – | + | – | + | – | + | Cream | Bacillus sp. |
Key: MR= Methyl red; VP = Voges Proskauer, + = Positive; – = Negative, IC=Isolate Code
Isolation of Cyanobacteria
The following cyanobacterial species were identified from the crude oil polluted site in Sample A; Synechoccocus elongates M10607D accession number GQ130146.1and Microcystis holsatica NIES4379 accession number U40336.1.
Biodegradation Experiment in three months: Changes in Total Petroleum Hydrocarbon values in the Biodegradation Setups shows that Setups X and Y as presented in Table 7; Setup X contains bacteria alone while setup Y contains both bacteria and cyanobacteria. TCHB counts in setup X and Y is presented in Table 7. The TCHB count in Setup C was higher than that observed in setup X which may be as a result of the mutualistic interaction between the cyanobacteria and bacteria in setup Y. The change in TPH values in the biodegradation setups during the study is tabulated in same table 7. From the Gas Chromatographic results, setup Y having both bacteria and cyanobacteria had the highest percentage biodegradation of 95.3 % while setup Z having only cyanobacteria had the lowest percentage biodegradation of 91.1 %. Setup X had 94.1% percentage degradation while the control setup had only 2.1% TPH reduction.
Table 7: Changes in Total Petroleum Hydrocarbon Content in the Biodegradation Setups in three months.
| Time (months) | Setup X | Setup Y | Setup Z | Setup C |
| 0 | 4132.30a±0.10 | 4132.30a±0.10 | 4132.30a±0.10 | 4132.30a±0.10 |
| 1 | 1052.98b±0.01 | 741.58a±0.01 | 1258.09c±0.00 | 4112.15d±0.01 |
| 2 | 565.36b±0.02 | 387.72a±0.02 | 984.50c±0.10 | 4105.45d±0.01 |
| 3 | 241.93b±0.10 | 194.09a±0.00 | 367.54c±0.01 | 4046.92d±0.01 |
| % TPH Loss | 94.10d±0.01 | 95.30c±0.01 | 91.10b±0.10 | 2.10a±0.01 |
Setup X: Bacteria
Setup Y: Bacteria + cyanobacteria
Setup Z: Cyanobacteria
Setup C: Control
Results are in Mean± Standard deviation
Means with the same superscript in a row are not significantly different (p<0.05)
DISCUSSION
In this study, the pH of the crude oil polluted soil was observed to be 6.17 which is slightly acidic and almost neutral. Other parameters like nitrate and phosphate which are known as limiting nutrients in biodegradation processes were also determined and the concentration was observed to be lower in the crude oil polluted soil when compared to the unpolluted soil collected from the same study area. Previous studies have demonstrated that the pH range optimal for biodegradation of hydrocarbons is 6-7 [12]. The pH of setup X decreased from 6.17 to 5.85, setup Y decreased from 6.17 to 6.04 while setup Z decreased from decreased from 6.17 to 5.92 and setup C 6.17 to 5.85 during the biodegradation period as shown in Table 1. There was a decrease in pH in all the biodegradation setups during the study. Similar result on pH changes during biodegradation was reported by [18] [19]. The decrease in pH in the setups may be as a result of the metabolites released by the microbes as they carryout biodegradation and other metabolic activities. The release of acidic metabolites causes a decrease in pH making the medium more acidic while the release of more basic metabolites makes the medium more alkaline in nature. However, [20] [21] in their study showed that pH had no significant effect on bacterial growth.
The moisture content of the setup X increased from 6.20 to 14.10%, for setup Y, it increased from 6.20 to 11.0%, setup Z, it increased from 6.20 to 13.80% and in setup C it increased from 6.20 to 13.9 during the three (3) months biodegradation test as shown in Table 2. Generally, there was a progressive increase in the moisture content in the biodegradation setups. It has been reported that the degradation of petroleum compounds is dependent of soil moisture content [22]. During the study, setup X recorded the highest temperature (32.30°C) at the end of the experiment and lowest temperature (31°C) at the first month. Setup Y recorded 32.00°C at the start of the experiment and lowest temperature 30.80°C at the second month. Setup Z recorded the highest temperature of 32.7°C at the second month and 30.4°C at the first month. Setup C recorded the highest temperature of 32.35°C at the second month and lowest temperature of 30.70°C at the first month in Table 3. All the temperature records throughout the experiment fell within mesophilic range which is suitable for the microorganisms used in this biodegradation study. The temperature measurements obtained are within optimum environmental temperature range. Similar result showing increase in biodegradation rate with increase in temperature was reported by [23]. There were reductions in the concentration of the heavy metals during biodegradation. Arsenic decreased from 5.10 ppm at the start of the study to 0.10 ppm after the experimental period of three months in Setup Y which was the best decrease observed. The highest decrease for silicon was observed in Setup Z which decreased from 10.81 ppm to 0.10 ppm. There was no decrease in the concentration of copper in all the three setups. A little decrease in Iron in Setup X from 21.40 ppm to 21.06 ppm; zinc in Setup X from 19.36 to 0.15; lead in Setup Y decreased from 3.11 ppm to 0.39 ppm; mercury in Setup Y from 0.06 ppm to 0.04 ppm; nitrate in Setup Y increased from 2.85 mg/kg to 4.07 mg/kg; sulphate in Setup Y increased from 14.20 mg/kg 2.98 mg/kg and phosphate in Setup Z increased from 2.16 mg/kg to 44.03 mg/kg. Setup Y performed best in heavy metal reduction in all the three experimental setups. The reductions in the concentration of heavy metals observed in this may be as a result of biotransformation, bioconcentration, bioconversion or bioaccumulation processes through the metabolic activities of the microorganisms involved. The setup containing bacteria and cyanobacteria consortia (Setup Y) performed best in the heavy metals’ concentration reduction followed by Setup X then finally Setup Z which was the lowest in performance. This shows that the combination of cyanobacteria and bacteria can be used in cleanup of heavy metal polluted sites.
The Total Culturable Heterotrophic Bacteria count in setup Y was higher than that observed in setup X. This may be as a result of the mutualistic interaction between the cyanobacteria and bacteria in setup Y. A similar result was reported by [13]. Cyanobacteria have been observed to form a strong relationship with bacteria in consortia which results in the difficulty in separating them. This relationship is also believed to work in metabolic synergy during biodegradation hence may result in increase in bacterial counts because cyanobacteria have been reported to secrete compounds that can be utilized by heterotrophic bacteria [14]. The results of the Total Petroleum Hydrocarbon degradation showed setup Y having both bacteria and cyanobacteria to have a significant percentage biodegradation level in the study, the highest percentage biodegradation of 95.3 % while setup Z having only cyanobacteria had the lowest percentage biodegradation of 91.1 % and setup X having only bacteria had 94.1 % level of biodegradation. The control setup had only 2.1% reduction the level of TPH which indicates that the higher reduction observed in other setups is as a result of the microorganisms in them. Biodegradation of crude oil by cyanobacteria and aerobic heterotrophic bacteria has been previously reported [14]. [13] Examined degradation of hydrocarbons by cyanobacteria and other aerobic heterotrophic bacteria and found out that they were chiefly responsible. Similar observations have been also reported previously in aquatic setting [18]; [1].
The result obtained in setup X is in accordance with previous finding by [13]. [18] and [1] which states that aerobic heterotrophic bacteria have the ability to degrade crude oil. Also, similar results about hydrocarbon degradation by cyanobacteria as observed in setup Z were reported by [24]. The result observed in setup Y concurred with previous reports that heterotrophic bacteria and cyanobacteria consortia form an effective consortium for the breakdown of hydrocarbons [13];[25]. The removal rate of TPH obtained correlates with the values of TCHB obtained in the setups. The setup with the highest TCHB increase (which is a measure of microbial proliferation) also had the highest TPH loss which can be attributed to the metabolic activities of the multiplying microbes which led to the degradation of the TPH in the setup. The combination of cyanobacteria and bacteria consortia in setup Y is the principal reason for the higher TPH loss when compared to other setups with either cyanobacteria or bacteria consortium [26]. The interaction of
cyanobacteria and bacteria led to the higher TPH loss which was observed.
CONCLUSION
The result of this study had shown that the combination of bacteria and cyanobacteria can enhance the degradation of petroleum hydrocarbon. It was observed in this study that bacteria are better petroleum hydrocarbon degraders when compared to cyanobacteria. It study also showed that the combination of bacteria and cyanobacteria in biodegradation is a better option than using them singly. The result had shown that bacteria can remediate heavy metal concentration in the environment. Furthermore, this study showed that cyanobacteria can also be used to achieve same result but bacteria performed extremely better than cyanobacteria in the level of heavy metal concentration reduction observed. A combination of both bacteria and cyanobacteria performed extremely better than bacteria or cyanobacteria consortia. The results obtained in this study both in biodegradation and heavy metal remediation conclude that a combination of bacteria and cyanobacteria is a better option for the cleanup of either crude oil or heavy metal polluted site.
REFERENCES
- Ichor, T., Okerentugba, P. O., Okpokwasili, G. C. (2014). Biodegradation of total petroleum hydrocarbon by aerobic heterotrophicbacteria isolated from crude oil contaminated brackish waters of bodo creek. Journal of Bioremediation and Biodegradation, 12(5): 34-41.
- Chikere, C. B., Surridge, K., Okpokwasili, G. C., and Cloete, T. E. (2012). Dynamics of indigenous bacterial communities associated with crude oil degradation in soil microcosms during nutrient-enhanced bioremediation. Waste Management Resource, 30: 225-236.
- Moffat, A.O., and Linden, P. (2005). Perception and reality. Journal of Environmental Science and Technology, 1: 283-297
- Onwurah, I. N. E., Ogugua V. N., Onyike, N. B., Ochonogor, A. E and Otitoju, O. F. (2007). Crude oil spills in the environment, effect and some innovative clean up biotechnologies. International Journal of Environmental Research, 4 (1): 307-320.
- Kadafa, A. A. (2012). Oil exploration and spillage in the Niger Delta of Nigeria. Civil Environment and Resource, 2: 38-51.
- Federal Ministry of Environment. (2006). Niger Delta natural resource damage assessment and restoration project: Phase 1- Scoping report. Federal Ministry of Environment, Abuja, Nigerian Conservation Foundation, Lagos, WWF UK and CEESP-IUCN Commission on Environmental, Economic and Social Policy, May 31, 2006.
- UNEP. (2011). Environmental setting in Ogoniland and the Niger Delta: Environmental Assessment of Ogoniland. United Nations Environment Programme, Nairobi, Kenya, 30-33.
- Ibiene, A. A., Orji, F. A., and Orji-Nwosu, E. C. (2011b). Microbial population dynamics in crude oil-polluted soils in the Niger Delta. Nigerian Journal of Agriculture, Food and Environment, 7(3):8-13.
- El-Bestawy, E. A., Abd El-Salam, A. Z., and Mansy, A. E. R. H. (2007). Potential use of environmental cyanobacterial species in bioremediation of lindane-contaminated effluents. International Biodeterioration and Biodegradation, 59: 180-192.
- Millioli, V. S., Servulo, E. l. C, Sobral, L. G. S., Declor, W., and Iho, D. E. (2009). Bioremedation of crude of bearing soil: Evaluating the effect of Rhamnnolipid addition to soil toxicity and to crude oil biodegration efficiency. Global Nest Journal. 11(2): 181-188.
- Ibraheem, I. B. M. (2010). Biodegradability of hydrocarbons by cyanobacteria. Journal of phycology, 46: 818-824.
- Chikere C. B., and Ekwuabu, C. B. (2014). Culture-dependent characterization of hydrocarbon utilizing bacteria in selected crude oil-impacted sites in Bodo, Ogoniland, Nigeria. African Journal Environmental Science and Technology, 8(6): 401-406.
- Koster, J. (2005). The direct role of aerobic heterotrophic bacteria associated with cyanobacteria in the degradation of oil compounds. International Biodeterioration and Biodegradation, 55: 29-37.
- Abed, R. M. M. (2010). Interaction between cyanobacteria and aerobic heterotrophic bacteria in the degradation of hydrocarbons. International Journal of Biodeterioration and Biodegradation, 64(1): 5864.
- Zaiad, G.M. (2010). Physicochemical analysis of soils in Al-Khums city, Libya. Journal of Applied Science Research, 6 (8): 1040-1044.
- Pujar, K. G., Hiremath, S. C., Pujar, A.S., Pujeri, U.S., Yadawe, M.S. (2012). Physicochemical and Heavy metal concentration in soil of Bijapur Taluka, Karnataka. International Journal of Environmental Research, 2 (1): 76-79.
- Ibiene, A. A., Orji, F. A., and Orji-Nwosu, E. C. (2011a). Microbial population dynamics in crude oil polluted soils in Niger delta. Nigerian Journal of Agriculture, Food and Environment, 7(3): 8-11.
- Adebusoye, S. A., Ilori, M. O., Amund, O. O, Teniola, O. D., and Olatope, (2006). Microbial degradation of petroleum hydrocarbon in a polluted tropical stream. Journal of American Science, 2(3):48-57.
- Ugochukwu C. Okafor, Michael U. Orji, Kingsley C.Agu, Nsikak S. Awah, Benjamin C. Okeke, Onyedika I. Okafor and Nnenna C.N. Okoro. Bioremediation of Crude Oil-polluted Soil Using Broiler-Chicken Droppings. Journal of Applied & Environmental Microbiology. 2016; 4(4):75-84. doi: 10.12691/jaem-4-4-2
- Shin, K. H., Kim, K. W., and Seagren, E. A. (2004). Combined effects of pH and biosurfactant addition on solubilization and biodegradation of phenanthrene. Applied Microbiology and Biotechnology, 65: 336-343.
- Ugochukwu C. Okafor, Michael U. Orji, Amechi S. Nwankwegu, Chikaodili G. Anaukwu, Samuel C. Onuorah, Etim J. Archibong, Ifeanyi E. Obika, Kingsley C. Agu (2016). Effect of Chicken droppings amendment on bioremediation of crude oil polluted soil. European Journal of Experimental Biology. 6 (4), 62-68
- Wan, Y. Z., Honglin, L., He, F., Liang, H., Huang, Y., and Li, X. L. (2009). Mechanical, moisture absorption, and biodegradation behaviours of bacterial cellulose fibre-reinforced starch biocomposites. Composites Science and Technology, 69: 12121217.
- Lim, B. R., Huang, X., Hu, H. Y., Goto, N., and Fujie, K. (2001). Effects of temperature on biodegradation characteristics of organic pollutants and microbial community in a solid phase aerobic bioreactor treating high strength organic wastewater. Water Science Technology. 43 (1):131-7.
- Grotzschel, S., Köster, J., Abed, R. M. M., and de Beer, D. (2002). Degradation of petroleum compounds immobilized on clay by a hypersaline microbial mat. Biodegradation, 13:273-83.
- Sanchez, O., Ferrera, I., Vigues, N., de Oteyza, T. G., Grimalt, J., and Mas, J. (2006). Role of cyanobacteria in oil biodegradation by microbial mats. International Biodeterioration and Biodegradation, 58: 186-195.
- Okafor, U. C. (2023). Evaluation of the Impact of Crude Oil Contamination on Soil’s Physicochemical Characteristics, Micro-flora and Crop Yield. Tropical Aquatic and Soil Pollution, 3(1), 24-35. https://doi.org/10.53623/tasp.v3i1.132