Lettuce Response to Enhanced Struvite Recovered from Faecal Sludge Effluent and the Probabilistic Health Risk Assessment of Heavy Metals Through the Intake of the Lettuce.
- Isaac Enyemadze
- Sampson Oduro-Kwarteng
- Helen Essandoh
- Francis W. Y. Momade
- Eli A. Gaveh
- Benson K. Asamoah
- 317-335
- Apr 14, 2024
- Health
Lettuce Response to Enhanced Struvite Recovered from Faecal Sludge Effluent and the Probabilistic Health Risk Assessment of Heavy Metals Through the Intake of the Lettuce.
Isaac Enyemadze1*, Sampson Oduro-Kwarteng1, Helen Essandoh1, Francis W. Y. Momade2, Eli A. Gaveh3, Benson K. Asamoah3
1Department of Civil Engineering, Regional Water and Environmental Sanitation Center Kumasi (RWESCK), Kwame Nkrumah University of Science and Technology, Kumasi, Ghana
2Department of Material Engineering, College of Engineering, Kwame Nkrumah University of Science and Technology, Kumasi, Ghana
3Department of Horticulture, College of Agriculture and Natural Resources, Kwame Nkrumah University of Science and Technology, Kumasi, Ghana
*Corresponding Author
DOI: https://doi.org/10.51584/IJRIAS.2024.90330
Received: 04 March 2024; Accepted: 09 March 2024; Published: 14 April 2024
ABSTRACT
Precipitating magnesium ammonium phosphate (MAP) to include potassium (K) has been explored to improve the fertilizing ability of the product. The present study aims to precipitate a MAP that also contains K and determine the probable risk to human health through the daily consumption of lettuce cultivated with the enhanced struvite. Analysis of the precipitate revealed that adding cocoa bean husk as seed produced MAP with potassium (K) content. The concentration of the heavy metals in the fresh leaves (concentration range, safe limits in mg/kg) was Cu (6.14 – 12.13, 73.3), Cd (0.11 – 0.43, 0.2), Ni (0.44 – 0.85, 67.9), Pb (0.85 – 1.38, 0.3). The estimated daily intake of heavy metals via the consumption of lettuce grown with struvite was below the tolerable upper dietary intake levels. The 95th percentile of the hazard index for the control, NPK and struvite are 0.047, 0.605, (0.214 – 0.759) respectively. The struvite produced can significantly improve its performance as an alternate phosphorus fertilizer and also show if struvite is safe for use as a fertilizer.
Keywords: heavy metals; lettuce; NPK; risk assessment; struvite
INTRODUCTION
From the literature, seed material has been used primarily in phosphorus (P) recovery to increase the crystals’ size. Some include quartz sand(Battistoni et al., 2000), struvite in the form of MAP(Yu et al., 2013), zeolite and molecular sieve(Xiaoning Liu et al., 2014b), dolomite(Xueyu Liu et al., 2015), snail shell (Oladoja et al., 2012), and calcite(Song et al., 2006). Moreover, seeds can be chosen to enhance the quality of the struvite product for use as fertilizer. Potassium (K) is essential for plant growth as it acts as an enzyme activator, stimulating metabolic processes. It has been shown to demonstrate the ability to enhance plants’ resistance to diseases, increase the size of grains and seeds, and enhance the quality of fruits and vegetables. This study seeks to use cocoa bean husk as seed material for struvite precipitation. A scanning electron microscope image of a cocoa bean husk shows a rough fibrous surface(Daud et al., 2013) which is a good seed characteristic. Moreover, chemical analysis of cocoa bean husk shows a high potassium content(Donkoh et al., 1991). Chemically, it is impossible to precipitate struvite as MgKNH4PO4.6H2O, and struvite has been precipitated either as MAP (MgNH4PO4.6H2O) or K-struvite (KMgPO4.6H2O). The research gap that looks at the possibility of adding a seed that contains another essential plant nutrient (potassium, K) is explored in this study.
Heavy metals have been found to induce electrolyte imbalance, and osmotic imbalance, as well as interfere with the absorption process on the negatively charged sites of enzymes(Macoveanu et al., 2010). According to (Gall et al., 2015), heavy metals have the potential to interact with biomolecules, interfering with essential biological processes directly. This disruption can lead to toxicity, and in severe cases, heavy metals can accumulate in the kidney and liver, ultimately leading to organ failure. Also, when heavy metals exceed certain concentration limits they can cause anomalies such as reduced growth, genetic effects and increased mortality(Khan et al., 2010; Q. S. Li et al., 2010; Luo et al., 2011). Heavy metals such as Cd and Pb are known to cause a reduction of the antioxidants and enzymes that have the thiol (-SH) group in the body. They destroy the antioxidant defences in the cells and lead to what is called oxidative stress(Ercal et al., 2001). The primary route of human metal exposure is via the intake of food and water, which gives rise to health issues owing to the possible accumulation of metals across the food chain(Mehta et al., 2018). The intake of vegetables significantly contributes to the exposure of humans to cadmium (Cd), accounting for a substantial proportion ranging from 70% to 90%(Huang et al., 2017). Studies have reported that the consumption of vegetables by humans contributes to about 90 % of the total metal intake(Ferré-Huguet et al., 2008; Khan et al., 2014; Kim et al., 2009; Martorell et al., 2011).
The potential human health risk connected with the consumption of crops grown with struvite has not received much attention, as previous studies have indicated that heavy metal levels in struvite remain below the established safe limits. However, due to the accumulation of some heavy metals that can occur in edible portions of plants, there is a need to conduct human health risks associated with the intake of crops cultivated with struvite. In risk assessment, the mean or median values have often been used in what is called deterministic risk assessment. This method can usually lead to overestimation or underestimation of the health risk. Due to the variabilities of the input parameters in human health risk assessment, uncertainties cannot be avoided. Fortunately, probabilistic human health risk assessment can successfully characterize these uncertainties by using a probability distribution of the input parameters in a risk model(Giri & Singh, 2015; Yang et al., 2019). The Monte Carlo simulation method has been carried out, in this present study, to describe the probability distribution of the input parameters. Afterwards, the probability that a hazard will occur is estimated. Also, the Monte Carlo simulation can perform sensitivity analysis to identify the input parameters that most influence the risk outcome.
Thus, the a need to fill these research gaps by (a) precipitating struvite that contains Mg, N, P, and K and (b) assessing the probabilistic health risk of heavy metals via the daily intake of lettuce.
MATERIALS AND METHODS
Faecal sludge effluent, bittern and dolomite source
Faecal sludge effluent (FSE) samples were taken from the faecal sludge treatment plant at Dompoase, Kumasi operated by Kumasi Metropolitan Assembly. Composite samples of the FSE were made from samples taken at 7 a.m., 10 a.m., 1 p.m., 4 p.m. and 7 p.m. each day. Aliquots from the composite were filtered and preserved in the field in a well-cleaned iced container. The samples collected each day were transported to the environmental quality laboratory at KNUST for analysis. The bittern sample was taken from the Pambros salt factory located in Dansoman, Accra. The dolomite rock sample (grab) was taken from the Diamond Cement factory in Buipe in the Northern Region of Ghana. It was transported to the environmental quality laboratory at KNUST and pulverized into fine powder. The dolomite powder was digested to obtain a solution, according to the standard methods of the American Public Health Association(APHA, 1999)
Struvite precipitation experiment
The experiment (Figure 1) was conducted in a 1.5 L air-agitated cone. FSE (containing PO4-P and NH4-N) and bittern (one with Ca removed and the other without Ca removal) were continuously pumped into the reactor with peristaltic pumps leading to an average Mg/P ratio of 1.3. The mixture was continuously stirred in the reactor by airflow using an aeration pump. The pH of the reaction was monitored and kept at 8.5 using 2M NaOH. The precipitates collected were dried at room temperature for 48 hours to obtain a dried product.
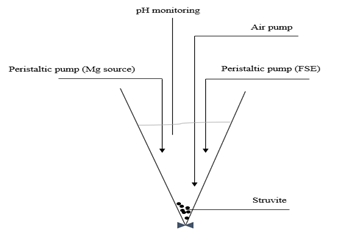
Figure 1: schematic diagram for struvite precipitation reaction
Sample analysis
Mg and Ca concentrations in the supernatant solution were determined by Agilent 4210 microwave plasma atomic emission spectroscopy (MP – AES) G8007A. The NH4+ concentration was determined by HACH high range persulfate digestion method 10072 while PO43- concentration was measured by HACH molybdovanadate Test ‘N Tube method 10127. Heavy metals (Cu, Cd, Ni and Pb, Mg, Ca and K in the struvite were analyzed by completely dissolving 0.1g of the dried precipitate in 50 mL 5% HCl solution.
Heavy metals were analyzed in the cocopeat and edible parts of the plant (the leaves). The dried sample was ground to a fine powder using a blender. 0.5 g of dried leaves were put in a digestion tube and mixed with 70 % HNO3 and 65 % HClO4 in a ratio of 5:1. The mixture was heated to 200 oC until it turned colourless(Chen et al., 2014). After cooling, the samples were filtered and the filtrate was diluted to 50 ml with distilled water. The Agilent 4210 MP-AES G8007A was used to measure the metals.
Experimental layout and study design
The Lactuca sativa (lettuce) plant was used for the experiment due to its fast-growing ability. The study was conducted using a pot experiment in the Horticulture Department at Kwame Nkrumah University of Science and Technology (KNUST), Ghana. The media used for cultivating the lettuce was cocopeat (natural fibre particles made from coconut husks) obtained from the Wood Weevil Farming Research Center at KNUST, Ghana.
The cocopeat was washed several times to obtain a neutral pH followed by sun drying for 24 hours (Figure 2a). It was followed by solar sterilization (Figure 2b) for 10 days to ensure that all fungi, and pathogens that may be present in the cocopeat are killed.
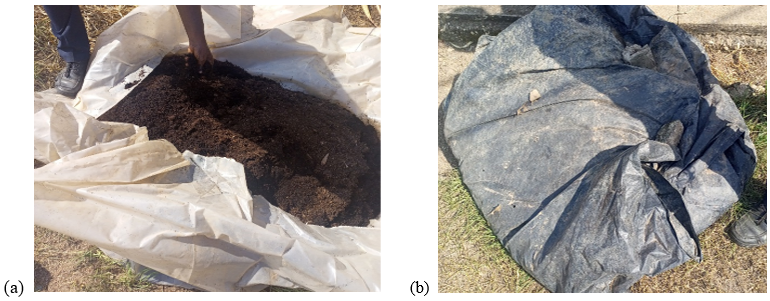
Figure 2: (a) Coopeat after drying (b) Solar sterilization of cocopeat
Each pot was filled with 1 kg of the cocopeat. Pots in four replicates for each fertilizer sample (B1, B2, D1, D2, NPK and Control). The lettuce seeds were sown on the 12th of January 2023 and were watered thrice daily. The seedlings were transplanted into the pots after 21 days. The recommended dosage of NPK for fertilizer use for vegetable cultivation is 150-1000 mg of N/L of fertilizer solution, 100-400 mg of K/L and 50-100 mg of P/L(Yetilmezsoy & Zengin-Zehra, 2009). Considering the lower limits of N and K in the recommended ranges, the amount of struvite and NPK required for 1kg cocopeat is about 2g each and was applied once weekly. A control pot was also set to receive only water.
The lettuce plants were harvested after maturating, 5 weeks after the application of fertilizer. The harvested plants were washed with tap water three times and once with distilled water to clean all dirt. The fresh plant weight was determined using a standard analytical weighing balance. The dry plant weight was estimated after drying them in the oven at 65 oC for 48 hours.
Health risk analysis
The health risk associated with consuming lettuce grown with struvite was assessed in adults using four international risk indicators. These are estimated daily intake (EDI), target hazard quotient (THQ) and hazard index (HI).
Concentration Calculations
Since humans consume fresh leaves, the concentration of heavy metals in the leaves based on fresh vegetables is calculated in Equation 1(Guo et al., 2019).
Cfp=Cdp x (1-w) (1)
Where Cfp and Cdp are the concentrations of heavy metals in fresh and dry plants respectively. W is the water content of vegetables based on Equation 2.
w=(fpw-dpw)/fpw (2)
Estimated Daily Intake
The estimated daily intake (EDI) of heavy metals (Cd, Cu, Ni and Pb) through the consumption of vegetables is calculated using Equation 3(USEPA, 2009a). The value of EDI will give the degree of toxicity of the heavy metals to humans.
EDI=(EF x ED x CR x Cfp)/(BW x AT ) x10-3 (3)
The EDI of the metals obtained in the present study is compared to the recommended daily allowance (RDA) and tolerable upper dietary intake level (UL) of the Food and Nutrition Board of the National Academy of Science, USA (Food and Nutrition Board, 1998). Where EF is the exposure frequency (days/year), ED is the exposure duration (days), CR is the consumption rate of the edible part of the plant (gram/person/day), Cfp is the concentration of heavy metal in the plant (mg/kg in fresh weight), BW is the average body weight of adult males and females (kg), AT is the averaging time for noncarcinogens (365 days per year x number of exposure years). The values of the input parameters used in Equation 4 can be found in Table 1.
Non-cancer risk characterization
The target hazard quotient (THQ) is used to estimate the human health risk caused by the consumption of food. The formula (Equation 4) for calculating health risk using THQ was proposed by (USEPA, 2009a).
THQ=EDI/(Rf D) (4)
RfD is the oral reference dose (mg/kg/day). RfD for Cu, Cd, Ni and Pb for leafy vegetables are 0.04, 0.001, 0.02 and 0.004 respectively (USEPA, 2009b). Also, the hazard index (HI) which is the sum of the individual THQ for the heavy metal is calculated using Equation 5 (Liu et al., 2013).
![]() (5)
(5)
Table 1: Input parameters for the risk assessment model
| Parameter | Symbol | Distribution | Values | Units | Reference |
| Concentration of HM in fresh plants | Cfp | Measured | mg/kg | – | |
| Concentration of HM in soil | Csoil | Normal | Measured | mg/kg | – |
| Consumption rate | CR | Laplace | 65.61 | g/person/day | WHO (food cluster diets) |
| Body weight | BW | Laplace | 70 | kg | (Vuvor & Harrison, 2017) |
| Exposure Frequency | EF | Laplace | 156 | Days/year | (Obeng et al., 2020) |
| Exposure duration | ED | Laplace | 70 | Years | (Vuvor & Harrison, 2017) |
| Averaging time | AT | Fixed value | ED x 365days | Days | (Obeng et al., 2020) |
If the HI or THQ is ≥ 1, then there is a probability of getting non-cancer (acute or chronic) based health effects. If the HI or THQ is < 1, then the exposed population is not likely to experience adverse health effects(Nag et al., 2022).
Statistical analysis
Probabilistic health risk assessment through the daily intake of lettuce was carried out using the Monte Carlo simulation method. To establish the reliability of the method, input parameters (BW, ED, EF and Cfp) were modelled with probabilistic distributions and subjected to the Monte Carlo simulations in 30,000 iterations. The 5th, 25th, 75th, 95th, and 99th percentile of the HI was extracted to determine the non-carcinogenic risk caused by multiple heavy metal contamination. In this study, sensitivity analysis was also conducted to detect the input parameters which have an impact on the model outcome. The Monte Carlo simulation and sensitivity analysis were performed in Microsoft Excel with in-built @ Risk software (Palisade Corporation, version 7.4).
RESULTS
The seedlings were transplanted to the main experimental pots and they all looked similar. However, they began to grow at different rates after the application of different fertilizers. The struvite precipitates used have been labelled as B1, D1, B2 and D2.
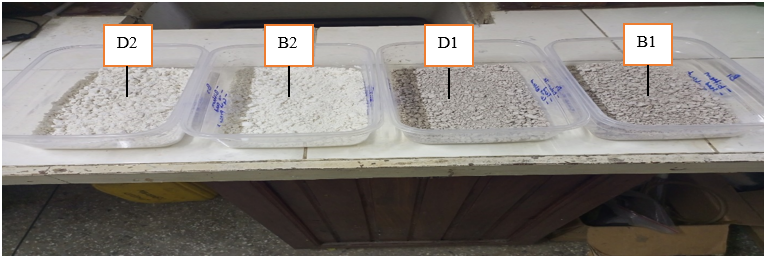
Figure 3: struvite precipitate
- B1 struvite. This was prepared from faecal sludge effluent (FSE) using bittern as an Mg source. The Ca content in the bittern was removed using ethylene glycol tetraacetic acid (EGTA) before the struvite precipitation was carried out. Cocoa bean husk (as a potassium source) was used as seed material.
- D1 struvite. This was prepared from faecal sludge effluent (FSE) using dolomite as an Mg source. The Ca content in the dolomite solution was removed using EGTA before the struvite precipitation was carried out. Cocoa bean husk (as a potassium source) was used as seed material.
- B2 struvite. This was prepared from faecal sludge effluent (FSE) using bittern as an Mg source. No Ca removal was carried out before the struvite precipitation and no seed material was also used.
- D2 struvite. This was prepared from faecal sludge effluent (FSE) using dolomite as an Mg source. No Ca removal was carried out before the struvite precipitation and no seed material was also used.
- NPK (15, 15, 15) commercial fertilizer purchased from the local market.
- Control pots which received no fertilizer but just water.
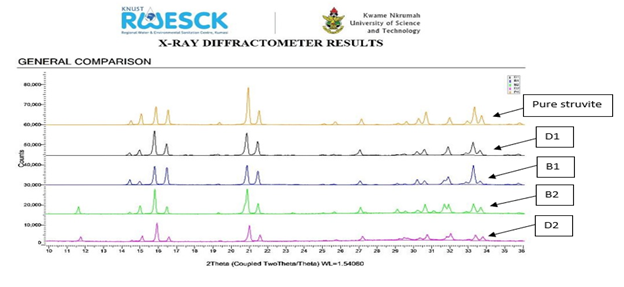
Figure 4: XRD pattern of struvite products compared with that of pure struvite
The presence of another phase is identified at 2Ɵ = 32. The significant amount of Ca2+ found in B1, B2 and D2 (Table 2) is probably responsible for the other phase identified at 2Ɵ = 32. Hence, it is most likely one of the calcium phosphate phases like hydroxyapatite.
The heavy metal concentrations present in the struvite are all below safe limits (Table 2). Thus, there is the possibility of using struvite produced from FSE and bittern and dolomite solution as fertilizer.
Table 2: Nutrient and heavy metal composition of the struvite
| [Mg2+]
/(mg/L) |
[Ca2+]
/(mg/L) |
[K+]
/(mg/L) |
PO43-
/(mg/L) |
[Cd]
/(mg/Kg) |
[Cu]
/(mg/Kg) |
[Ni]
/(mg/Kg) |
[Pb]
/(mg/Kg) |
|
| D1 | 44.7 | 0.78 | 3.26 | 84.8 | 0.02 | 26.5 | 0.1 | 33.6 |
| B1 | 47.7 | 5.97 | 4.67 | 71.4 | 0.01 | 22.7 | bdl | 20.2 |
| D2 | 44.6 | 57.15 | 0.91 | 64.8 | 0.09 | 19.3 | 2.1 | 30.8 |
| B2 | 43.6 | 124.75 | 0.78 | 84.3 | 0.03 | 31.1 | 1.8 | 37.4 |
| Allowable limit*/(mg/Kg) | 2* | 75* | 18* | 50* |
* Canadian Food Inspection Agency, bdl – below detection limit
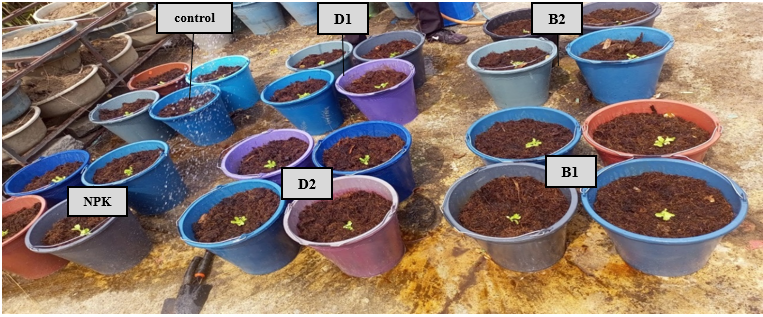
Figure 4: Letuce seedlings
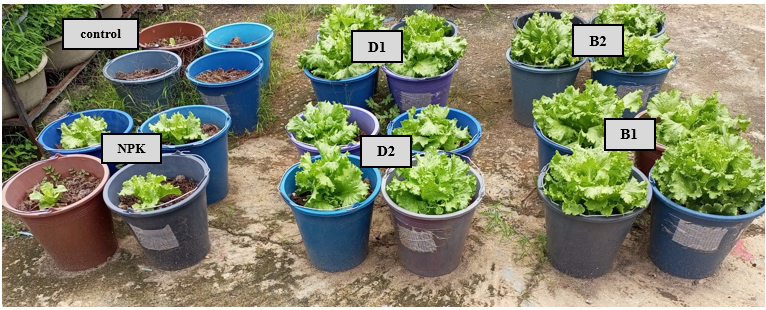
Figure 5: Mature lettuce
Nutrient and Essential Element Content in Leaves
The nutrients and essential element content in the leaves are displayed in Figure 6.
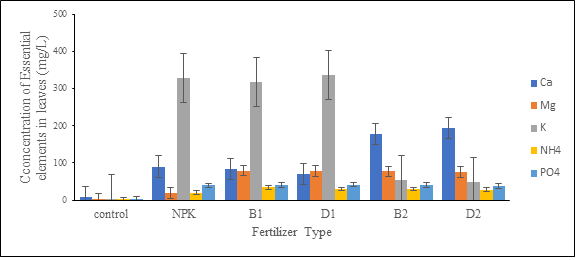
Figure 6: Uptake of nutrients and essential elements in plant leaves
The concentration of Ca in the leaves decreased in the order D2 > B2 > NPK > B1 > D1. There were significant differences in the concentration of Ca in the leaves.
The concentration of Mg in the leaves decreased in the order B1 > D1 > B2 > D2 > NPK. ANOVA revealed significant differences (p < 0.001) in the mean concentrations from the different fertilizers used. The analysis by Tukey (HSD) revealed that the concentration of Mg in the leaves grown with struvite (B1, D1, B2 and D2) was significantly higher than in the leaves grown with the commercial NPK.
The K concentration in the leaves decreased in the order D1 > NPK > B1 > B2 > D2. ANOVA revealed significant differences (p < 0.001) in the mean concentrations from the different fertilizers used. The analysis by Tukey (HSD) revealed that the concentration of K in the leaves grown with NPK, D1 and B1 was significantly higher than in the leaves grown with the B2 and D2 (ie the struvite that did not receive the cocoa pod husk as seed).
There were no significant differences (p > 0.05) in the ammonia nitrogen content in the leaves grown with the struvite (B1, D1, B2 and D2). However, there were significant differences in the ammonia content between the leaves grown with struvites and those grown with NPK. Analysis by Tukey (HSD) revealed that the concentration of ammonia in the leaves grown with struvites was significantly higher than in the leaves grown with NPK.
The concentration of P in the leaves decreased in the order D1 > B2 > B1 > NPK > D2. ANOVA revealed that there are no significant differences (p > 0.05) in the P concentrations from the different fertilizers used.
Effect of struvite on the number of leaves
The agronomic parameters of the lettuce considered in this study are the number of leaves and fresh plant weight. The graph that shows the effect of the fertilizer type on the number of leaves is shown in Figure 7. There were significant differences (p < 0.05) in the number of leaves obtained in the plants grown with fertilizer and the number of leaves grown under the control (lettuce grown with no fertilizer but only water). In all pots, the highest number of leaves were obtained in the 5th week after fertilizer application. Lettuce grown with B1 struvite produced the highest number of leaves whereas lettuce grown in the control pot produced the least number of leaves. The number of leaves of fresh plants decreased in the order B1(16) > B2(14) > D1(13) > D2(12) > NPK (11) > control (6).
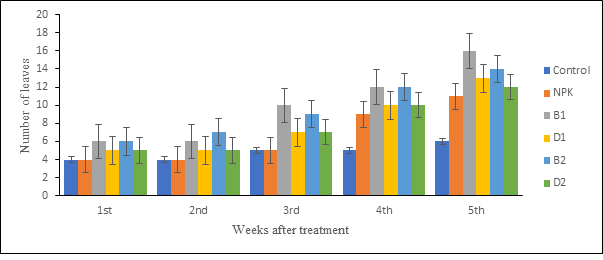
Figure 7: Effect of struvite on the number of lettuce leaves from 1st to 5th weeks after application of the fertilizers
Effect of struvite on the biomass yield
There were significant differences among the six (6) treatments. F (5, 6) = 111.704, p < 0.001. Post hoc testing revealed that the weight of the control plants (M = 8, SD = 0) and the weight of plants grown with NPK (M = 30.75, SD = 4.59) are statistically different from the weight of the plants grown with B2 (M = 160.65, SD = 5.86) and D2 (M = 134.9, SD = 7.63). In addition, the weight of plants grown with B1 (M = 234.91, SD = 6.24) and D1 (M = 218.55, SD = 28.35) are statistically different from the weight of plants grown with B2 and D2. The highest mass was obtained from plants grown with B1 struvite
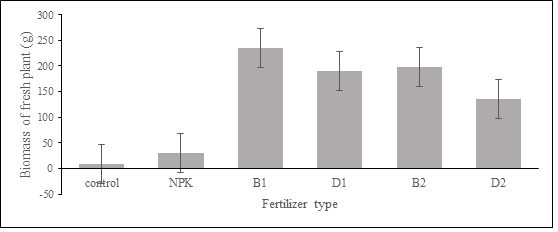
Figure 8: Effect of fertilizer on the weight of the fresh plant
Heavy metal levels in cocopeat
The mean concentration of heavy metals (Cu, Cd, Ni, and Pb) in the cocopeat used for growing the lettuce in the present study are presented in Table 3. The lowest heavy metal concentration was found in the control pots, indicating contamination caused by the application of struvite and NPK.
Table 3: Concentration of heavy metals in cocopeat (mean ± sd, mg/kg)
| Fertilizer type in the pots | Cu | Cd | Ni | Pb |
| Control | 120.50 ± 0.70 | 0.00 ± 0.00 | 0.00 ± 0.00 | 0.00 ± 0.00 |
| NPK | 461.00 ± 1.41 | 6.15 ± 0.07 | 8.00 ± 0.00 | 6.15 ± 0.21 |
| B1 | 181.15 ± 1.20 | 2.00 ± 0.00 | 6.15 ± 0.21 | 2.05 ± 0.07 |
| D1 | 141.15 ± 0.63 | 2.00 ± 0.00 | 7.45 ± 0.63 | 2.00 ± 0.00 |
| B2 | 212.40 ± 2.26 | 2.00 ± 0.00 | 8.20 ± 0.28 | 9.70 ± 0.42 |
| D2 | 174.40 ± 2.40 | 4.00 ± 0.00 | 8.00 ± 0.00 | 2.05 ± 0.07 |
| 100* | 3* | 50* | 100* |
* WHO maximum limits for heavy metals in the soil as reported by (Chiroma T. M et al., 2014)
The highest concentration of Cu was measured in the cocopeat grown with NPK while the lowest concentration of Cu was measured in the control. The concentration of Cu in the cocopeat decreased in the order NPK > B2 > D2 > B1 > D1 > control. The concentration of Cu in all the cocopeat was above the WHO maximum allowable limits for soil. Post hoc tests showed significant differences (p < 0.001) in the mean values of all the samples.
The mean Cd concentration varied from 0 ± 0.0 to 6.15 ± 0.07 mg of Cd/kg. The highest and lowest concentrations of Cd were measured in the NPK and control pots respectively. There were no significant differences (p > 0.05) in the mean values obtained in B1, D1 and B2. However, there were significant differences (p < 0.001) in the mean values obtained in the control and all the other treatments. Cd concentrations decreased in the order NPK > D2 > B1 = B2 = D1 > control. The concentrations measured in NPK and D2 were above the maximum allowable limits in soil.
The concentration of Ni in the cocopeat varied from 0 ± 0.0 to 8.0 ± 0.0 mg of Ni/ kg. All the concentrations of Ni were below the maximum allowable limits for soil. The mean concentrations in the control were significantly different (p < 0.001) from all the other treatments. Ni concentrations decreased in the order B2 > NPK = D2 > D1 > B1 > control.
The highest and lowest Pb concentrations were recorded in the B2 and control respectively. All the Pb concentrations were lower than the maximum allowable limits in soil.
Heavy Metal Contamination of Leaves
The mean concentration (mg/kg) of the heavy metals in the fresh leaves of the lettuce has been presented in Table 4. The concentration of heavy metals was highest for Cu, followed by Pb and Ni. Cd had the lowest concentration values in the leaves. ANOVA revealed that there are significant differences in the means of the heavy metal concentrations for Cu, Cd, Ni and Pb.
Table 4: Heavy metal contamination of leaves grown with struvite and NPK
| Heavy metal concentration (mg/kg) | ||||
| Cu | Cd | Ni | Pb | |
| Control | 4.09 ± 0.05 | 0.00 | 0.25 ± 0.00 | 0.00 |
| NPK | 12.13 ± 0.12 | 0.43 ± 0.01 | 0.44 ± 0.01 | 0.95 ± 0.01 |
| B1 | 11.42 ± 0.39 | 0.17 ± 0.00 | 0.52 ± 0.02 | 1.38 ± 0.33 |
| D1 | 6.14 ± 0.03 | 0.12 ± 0.01 | 0.54 ± 0.00 | 0.95 ± 0.02 |
| B2 | 7.05 ± 0.07 | 0.12 ± 0.00 | 0.65 ± 0.01 | 0.96 ± 0.07 |
| D2 | 5.77 ± 0.04 | 0.11 ± 0.02 | 0.85 ± 0.01 | 0.85 ± 0.06 |
| 73.3* | 0.2* | 67.9* | 0.3* | |
*Acceptable limits of heavy metals for leafy vegetables (FAO/WHO, 2019)
The Cu concentrations in the fresh leaves were below the maximum limits (73.3 mg/kg) for leafy vegetables among all the fertilizer types. The mean concentration of Cu in the leaves was significantly different (p < 0.001) with the highest level recorded in the leaves grown with NPK fertilizer.
The mean concentration of Cd was significantly different (p < 0.001) among all the leaves grown with the different fertilizer types. The highest level of Cd was recorded in the leaves grown with NPK. All Cd levels were below the maximum acceptable limits (0.2 mg/kg) for leafy vegetables except leaves grown with NPK which were above the safe limits(FAO/WHO, 2019; Mensah et al., 2009).
The highest concentration of Ni was recorded in the leaves grown with D2 struvite fertilizer. The mean concentration of Ni was significantly different (p < 0.001) among all the leaves grown with the different fertilizer types. All Ni levels measured were below the maximum acceptable limits (67.9 mg/kg) for leafy vegetables(Mensah et al., 2009).
All Pb levels measured were above the maximum acceptable limits (0.3 mg/kg) for leafy vegetables except for leaves in the control pots(FAO/WHO, 2019; Mensah et al., 2009). The highest concentration of Pb was recorded in the leaves grown with B1 struvite fertilizer. The mean concentration of Pb among all the leaves grown with the different fertilizer types was significantly different (p < 0.001) from the control.
Estimated Daily Intake
The estimated daily intake (EDI) of heavy metals through the consumption of Lactuca sativa (lettuce) grown with struvite and commercial NPK fertilizer is presented in Table 5. The EDI of heavy metals in the fresh leaves decreased in the order Cu > Pb > Ni > Cd.
Table 5: Estimated daily intake of heavy metals from the consumption of Lactuca sativa (lettuce) grown with struvite and NPK fertilizer
| Estimated daily intake (µg/day/person) | ||||
| Cu | Cd | Ni | Pb | |
| Control | 0.001631 | 0.000000 | 0.000099 | 0.000000 |
| NPK | 0.004832 | 0.000173 | 0.000173 | 0.000388 |
| B1 | 0.004629 | 0.000071 | 0.000214 | 0.000641 |
| D1 | 0.002442 | 0.000043 | 0.000214 | 0.000386 |
| B2 | 0.002812 | 0.000051 | 0.000256 | 0.000358 |
| D2 | 0.002271 | 0.000038 | 0.000341 | 0.000341 |
| RDA | 900 | 10 – 20 | 70 – 260 | 88* |
| UL | 10,000 | 65 | 1,000 | – |
Recommended daily allowance (RDA), Tolerable upper dietary intake level (UL)(Dietary Reference Intakes, 2002); *(Yetilmezsoy & Zengin-Zehra, 2009); data not available(-)
The EDI by an adult male or female was compared to the recommended daily allowance (RDA) and tolerable upper dietary intake level (UL) of the Food and Nutrition Board of the National Academy of Science, USA. The EDI (µg/day) of Cu (2.2E-3 to 4.8E-2), Cd (3.8E-5 to 1.7E-4), Ni (1.7E-4 to 3.4E-4) and Pb (3.4E-4 to 6.4E-4) in the leaves grown with different fertilizer types was lower than the UL values of 10,000, 65, 1,000, and 88 µg/day respectively.
Probabilistic Human Health Risk Assessment
The non-carcinogenic health risk for adult males and females who consume the lettuce was calculated using THQ and HI is presented in Table 6. The THQ values of the heavy metals (Cu, Cd, Ni and Pb) in the leaves grown with struvite and NPK were significantly lower than 1. The low THQ value is indicative of a low adverse health risk to adult males and females who consume the lettuce. The THQ of the heavy metals decreased in the order Pb > Cu > Cd > Ni.
Table 6: Probabilistic health risk analysis
| THQ | HI | |||||||||
| Probability | ||||||||||
| Cu | Cd | Ni | Pb | 5th | 25th | 75th | 95th | 99th | ||
| Control | 0.040787 | 0 | 0.004944 | 0 | 0.044 | 0.045 | 0.046 | 0.047 | 0.047 | |
| NPK | 0.12081 | 0.172585 | 0.008629 | 0.097079 | 0.265 | 0.327 | 0.448 | 0.605 | 0.755 | |
| B1 | 0.115714 | 0.071209 | 0.010681 | 0.160219 | 0.101 | 0.204 | 0.464 | 0.759 | 1.028 | |
| D1 | 0.061048 | 0.04284 | 0.01071 | 0.096391 | 0.061 | 0.122 | 0.272 | 0.443 | 0.609 | |
| B2 | 0.07031 | 0.051134 | 0.012784 | 0.089485 | 0.155 | 0.174 | 0.251 | 0.365 | 0.476 | |
| D2 | 0.056786 | 0.037857 | 0.017036 | 0.085179 | 0.179 | 0.19 | 0.203 | 0.214 | 0.221 | |
THQ – Target Hazard Quotient, HI – Hazard Index
The cumulative exposure (HI) of all the heavy metals in this present study decreased in the order NPK (0.399) > B1 (0.357) > B2 (0.223) > D1 (0.210) > D2 (0.196). The THQ and HI from the control were significantly lower than those obtained from NPK and struvite.
DISCUSSION
Characteristics of struvite
Results from Table 2 show that some amount of K has been introduced into B1 and D1 MAP struvite after adding cocoa bean husk as seed. ANOVA revealed that the mean concentrations of K in B1 and D1 are significantly different (p < 0.05) from the mean concentration of K in B2 and D2. The addition of K to the MAP will significantly improve the fertilizing ability of the product. Further work must be conducted to investigate how the amount of K in the MAP can be increased. The phases identified by the XRD analysis are struvite (MAP), whitlockite (Ca3(PO4)2), hydroxyapatite (Ca10(PO4)6(OH)2 and bernalite (Fe(OH)3). The presence of Bernalite is likely to be the FSE used, as it is known to contain a high concentration of Fe (Niwagaba, et al., 2014; Strande, 2014). The presence of whitlockite and hydroxyapatite is to be expected due to the presence of Ca in the bittern and dolomite (Table 2). Muster et al., (2013) and Moragaspitiya et al., (2019) have also identified the hydroxyapatite phase at an increased Ca concentration when they precipitated struvite. The intensities of the peaks for B2 and D2 were lower than those in B1 and D1. This agrees with a study by (Xiaoning Liu & Wang, 2019b) where their XRD plots showed lower peak intensities at a high Ca:Mg ratio. They attributed the presence of calcium as the cause of reduced peak intensities.
Nutrient Content in the Leaves
The lettuce plants in the pots that received struvite and those that received NPK grew at a much faster rate than those in the control pots. This might be due to the poor nutrients and essential metals that were not available in the control pots for plant growth and development.
N is available to plants as NO3– and NH4+(Uchida & Silva, 2000). It is necessary for the formation of amino acids that are used in cell division in the early stages of plant development. Thus, a deficiency of N may result in stunted growth due to a reduction in cell division. P is available to plant as HPO42- and H2PO4–. P plays a role in photosynthesis and respiration. It helps in the development of roots, seeds fruits and flower initiation(Uchida & Silva, 2000). Hence, a lack of P is likely to cause a delay in plant maturity, and poor seed and fruit development.
The order of biomass of lettuce in Figure 6.4 would be related to the difference in the amount of N in the leaves rather than the amount of P. This finding is supported by data in this study where Pearson correlation showed a strong positive correlation (r = 0.903, p < 0.05) between fresh weight and the amount of N in leaves. The correlation between fresh weight and P was positive but statistically not significant (r = 0.67, p > 0.05). Ryu et al., (2012) also confirmed that P was not a major growth contributor to Chinese cabbage.
Biomass of fresh lettuce
Results from Figure 6.4 indicate that the addition of struvite as a slow-releasing fertilizer increased the weight of lettuce plants significantly compared to those plants grown with commercial NPK. The average biomass improved by 3.7 %, 29.4 %, 23.8 %, 24.9 %, and 16.9 % in NPK, B1, D1, B2, and D2, respectively, compared to the control. González-Ponce et al., (2009) in their study to test lettuce response to fertilization with struvite reported a higher biomass yield for lettuce grown with struvite. Also, a study by Antonini et al., (2012) revealed that struvite produced a higher biomass than commercial fertilizer when they were used to grow maize
Contamination of heavy metals in cocopeat
The presence of heavy metals in fertilizers presents an ecological hazard to the soil where they are applied for plant cultivation. The heavy metal content of the cocopeat presented in Table 3 reveals low to serious contamination. Generally, contamination of cocopeat in the control pots was lower than cocopeat which received struvite and NPK. Cd, Ni and Pb were not detected in the control pots. However, Cu was detected in the control and was above the safe limits required for agricultural soil. The reason why Cu was detected in the control is not clear. It is possible the contamination was a result of the pipes through which the water comes from. In comparison to the Cu content in the control cocopeat, the percentage elevation of Cu in the other pots that received fertilizer is 59.9 % NPK, 10.6 % B1, 3.6 % D1, 16.2 % B2 and 9.5 % D2.
The high concentration of Cd in all the pots except the control might be due to the high adsorption capacity of cocopeat for Cd as reported by(Samaniego & Tanchuling, 2019). Their study, which was conducted on the sorption of heavy metals unto cocopeat reported 66.7 % of Cd removal from gold mine wastewater. The low concentration of Ni and Pb measured in all the pots indicates low adsorption of Pb by the cocopeat. This can be supported by (Samaniego & Tanchuling, 2019) who reported a low (27 %) removal of Pb by cocopeat. An earlier study by (Amarasinghe, 2011) also indicated higher adsorption of Pb by cocopeat than for Cd. This can be explained by the hydration enthalpies of Pb (-1,481 kJ/kg) and Cd (-1,1807 kJ/kg). The hydration enthalpy refers to the energy required for the dissociation of water molecules from cations, which indicates the degree of ease with which the cation can interact with the functional groups present on cocopeat particles. The more a cation is hydrated, the stronger its hydration enthalpy, and the less it could interact with the adsorbent. Thus, Cd will not be easily dissociated from water molecules to interact with cocopeat particles.
Heavy metal contamination in leaves
From the results obtained in this present study and from the literature(F. Li et al., 2017) plant growth and quality is greatly enhanced when it is supplied with external nutrients. However, there are reports of the uptake of harmful heavy metals in the crops from the soil. In the present study, metal concentration in the lettuce (fresh weight basis) grown with struvite that has been produced from FSE was observed.
The concentration of Cd and Pb in the leaves from the control pots was below detection while the concentration of Cu and Ni were lower than acceptable limits. Figure 4 reveals that the heavy metals (Cu and Cd) in the leaves grown with NPK were higher than those grown with the struvite. This can be attributed to the high concentration of Cu and Cd in the cocopeat that received the NPK fertilizer. The slow release of nutrients, as well as heavy metals from struvite, can account for the low concentrations of Cu and Cd found in the cocopeat that received it. Even though some of the Pb concentrations in the leaves grown with struvite were higher than those grown with NPK, ANOVA revealed that the differences in their mean were statistically not significant (p > 0.05).
Concentrations of Cd in the leaves grown with NPK (0.44 mg/kg) were above the WHO acceptable limit (0.3 mg/kg) for leafy vegetables. The concentration of Cd in the leaves grown with struvite was below the acceptable limits (ranging from 0.10 to 0.18 mg/kg), but they were appreciably high. The high concentration of Cd in the leaves can be due to its high bioavailability in soil solutions as reported by (Hamilton et al., 2007). In their study, Hamilton et al., (2007) explained that Cd2+ is highly soluble in soil solution and competes with other divalent metals like Ca2+, Mg2+ and Fe2+ for the binding sites of cation transporters. (Zhuang et al., 2009)also reported high Cd and Pb levels in rice grains grown in contaminated mine soil. Furthermore, in Pb/Zn-contaminated soil it was reported that Cd and Pb in the grains of maize exceeded the acceptable limit by 1.5 and 2.0 times respectively (Gu et al., 2005) as cited by (Obeng et al., 2020).
Estimation Daily Intake
The EDI for Cd in this present study is lower than the EDI of Cd obtained in lettuce irrigated with a municipal waste-dominated stream. However, the EDI for Ni in this study was similar to that obtained in lettuce grown with a municipal waste-dominated stream(Obeng et al., 2020). Also, the EDI for Cd and Pb via the consumption of the lettuce obtained in this present study was significantly lower than those obtained in Europe (Pb = 0.68µg/day, Cd = 0.25 µg/day)(EFSA, 2012a, 2012b) and China(Guo et al., 2019; Liang et al., 2019). The lower values of the EDI obtained for Cu, Cd, Ni and Pb in the leaves suggest a reduced adverse health effect to adult males and females through daily intake of the lettuce.
Probabilistic Human Health Risk
The values of THQ and HI are useful parameters to evaluate the human health risk associated with the intake of heavy metals via food consumption(Hough et al., 2004; Sridhara Chary et al., 2008). The THQ of the heavy metals (Cu, Cd, Ni and Pb) in the lettuce being less than 1, from both the struvite and NPK, is a clear indication of a low human health risk. The THQ for Pb obtained in this present study is (0.096 – 0.160) significantly lower than the THQ values obtained in China (0.20 – 1.52) in vegetables grown around Pb/Zn smelter(Guo et al., 2019). However, the THQ for Cd (0.037 – 0.17) and Ni (0.0086 – 0.017) in this study was higher than those obtained in lettuce grown with waste waste-dominant streams in Ghana(Obeng et al., 2020). It can be noticed from the result in Table 3, that the human health risk of Cd and Pb via the daily intake of lettuce is negligible despite high concentrations of Cd (0.11 – 0.43 mg/kg, allowable limit = 0.2 mg/kg) and Pb (0.85 – 1.35 mg/kg, allowable limit = 0.3 mg/kg) found in the lettuce leaves.
The 95th percentile of the HI through the daily intake of lettuce grown with B2 and D2 struvite are 0.365 and 0.214 respectively. These values being less than 1 suggest that there is a negligible adverse health risk posed to the adult population who consume lettuce grown with B2 and D2 struvite. The 99th percentile of the HI from leaves grown with NPK (0.755) and D1 (0.609) approached 1. This suggests that even 1 % of the adult population may not suffer adverse health risks from heavy metals through the daily intake of lettuce grown with NPK and D1 struvite. The HI from leaves grown with B1 struvite was 1.028 at the 99th percentile. This is an indication that 1 % of the adult population may have adverse health risks from heavy metals through the daily intake of lettuce grown with B1 struvite.
Sensitivity Analysis
Tornado plots were used to show sensitivity analysis using the Spearman correlation coefficient of the variables (Figure 8). Sensitivity analysis is conducted to determine the influential variables that contribute to the health risk in the model. The important variables contributing to the health risk through the intake of leaves grown with B1 are the concentration of Pb, Cu and Cd. The concentration of Ni and the consumption rate of the leaves are the second most influential variables. The body weight (BW), exposure duration (ED), exposure frequency (EF) and averaging time (AT) were less influential to the risk output. To reduce the health risk posed to the adult male and female population, it is imperative to reduce the heavy metal content in the struvite to decrease their accumulation in plants.
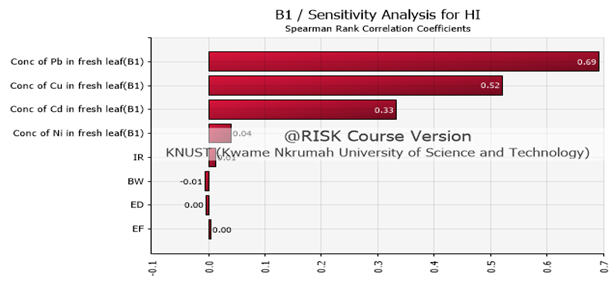
Figure 8: Sensitivity analysis for non-carcinogenic risk for leaves grown with B1struvite
CONCLUSION
The fertility of struvite precipitated from FSE using Mg from bittern and dolomite was tested on the growth of Lactuca sativa (lettuce). The study revealed that cocopeat, which was the medium for plant cultivation, was polluted with Cu and Cd but Ni and Pb were within acceptable limits for agriculture soil. The heavy metal concentration in the leaves revealed that Pb and Cd are easily transferred from the soil to the plant leaves due to their high bioavailability in soil solution. Despite the high concentration of Cd and Pb measured in the leaves, the health risk via daily intake of the lettuce was negligible. The results for HI values revealed no adverse health effects in leaves grown with both struvite and NPK (HI < 1) except from those grown with B1 struvite where the 99th percentile of HI is 1.028.
REFERENCES
- Amarasinghe, B. M. W. P. K. (2011). Lead and Cadmium Removal from Aqueous Medium Using Coir Pith as Adsorbent: Batch and Fixed bed Column Studies. Journal of Tropical Forestry and Environment, 1(1). https://doi.org/10.31357/jtfe.v1i1.82
- Antonini, S., Arias, M. A., Eichert, T., & Clemens, J. (2012). Greenhouse evaluation and environmental impact assessment of different urine-derived struvite fertilizers as phosphorus sources for plants. Chemosphere, 89(10), 1202–1210. https://doi.org/10.1016/j.chemosphere.2012.07.026
- Augustsson, A., Uddh-Söderberg, T., Filipsson, M., Helmfrid, I., Berglund, M., Karlsson, H., Hogmalm, J., Karlsson, A., & Alriksson, S. (2018). Challenges in assessing the health risks of consuming vegetables in metal-contaminated environments. Environment International, 113(July), 269–280. https://doi.org/10.1016/j.envint.2017.10.002
- Chen, Y., Wu, P., Shao, Y., & Ying, Y. (2014). Health risk assessment of heavy metals in vegetables grown around battery production area. Scientia Agricola, 71(2), 126–132. https://doi.org/10.1590/S0103-90162014000200006
- Chiroma T. M, Ebewele R. O, & Hymore F.K. (2014). Comparative Assessement Of Heavy Metal Levels In Soil, Vegetables And Urban Grey Waste Water Used For Irrigation In Yola And Kano. International Refereed Journal of Engineering and Science, 3(2), 1–09. www.irjes.com
- Dietary Reference Intakes. (2002). National Academy Press.
- EFSA. (2012a). Cadmium dietary exposure in the European population. In EFSA Journal (Vol. 10, Issue 1). https://doi.org/10.2903/j.efsa.2012.2551
- EFSA. (2012b). Lead dietary exposure in the European population. In EFSA Journal (Vol. 10, Issue 7). https://doi.org/10.2903/j.efsa.2012.2831
- Ercal, N., Gurer-Orhan, H., & Aykin-Burns, N. (2001). Toxic Metals and Oxidative stress Part I: Mechanisms Involved in Metal induced Oxidative Damage. Current Topics in Medicinal Chemistry, 1(6), 529–539.
- FAO/WHO. (2019). INTERNATIONAL FOOD STANDARDS. CODEX ALIMENTARIUS (Vol. 561, Issue 3).
- Ferré-Huguet, N., Martí-Cid, R., Schuhmacher, M., & Domingo, J. L. (2008). Risk assessment of metals from consuming vegetables, fruits and rice grown on soils irrigated with waters of the Ebro River in Catalonia, Spain. Biological Trace Element Research, 123(1–3), 66–79. https://doi.org/10.1007/s12011-008-8113-z
- Food and Nutrition Board. (1998). Dietary Reference Intakes: A Risk Assessment Model for Establishing Upper Intake Levels for Nutrients. In Nutrition Reviews (Vol. 55, Issue 9). National Academies Press. https://doi.org/10.17226/6432
- Gall, J. E., Boyd, R. S., & Rajakaruna, N. (2015). Transfer of heavy metals through terrestrial food webs: a review. Environmental Monitoring and Assessment, 187(4). https://doi.org/10.1007/s10661-015-4436-3
- Giri, S., & Singh, A. K. (2015). Human health risk assessment via drinking water pathway due to metal contamination in the groundwater of Subarnarekha River Basin, India. Environmental Monitoring and Assessment, 187(3). https://doi.org/10.1007/s10661-015-4265-4
- Guo, G., Zhang, D., & Wang, Y. (2019). Probabilistic Human Health Risk Assessment of Heavy Metal Intake via Vegetable Consumption around Pb / Zn Smelters in Southwest China. International Journal of Environmental Research and Public Health, 16(3267).
- Hamilton, A. J., Stagnitti, F., Xiong, X., Kreidle, S. L., Benke, & Maher, P. (2007). Wasterwater Irrigation: The state of play. Vadose Zone Journal, 30(12), 878–891.
- Hough, R. L., Breward, N., Young, S. D., Crout, N. M. J., Tye, A. M., Moir, A. M., & Thornton, I. (2004). Assessing potential risk of heavy metal exposure from consumption of home-produced vegetables by urban populations. Environmental Health Perspectives, 112(2), 215–221. https://doi.org/10.1289/ehp.5589
- Huang, Y., He, C., Shen, C., Guo, J., Mubeen, S., Yuan, J., & Yang, Z. (2017). Toxicity of cadmium and its health risks from leafy vegetable consumption. Food and Function, 8(4), 1373–1401. https://doi.org/10.1039/c6fo01580h
- Kataki, S., West, H., Clarke, M., & Baruah, D. C. (2016). Phosphorus recovery as struvite: Recent concerns for use of seed, alternative Mg source, nitrogen conservation and fertilizer potential. Resources, Conservation and Recycling, 107, 142–156. https://doi.org/10.1016/j.resconrec.2015.12.009
- Khan, S., Hesham, A. E. L., Qiao, M., Rehman, S., & He, J. Z. (2010). Effects of Cd and Pb on soil microbial community structure and activities. Environmental Science and Pollution Research, 17(2), 288–296. https://doi.org/10.1007/s11356-009-0134-4
- Khan, S., Reid, B. J., Li, G., & Zhu, Y. G. (2014). Application of biochar to soil reduces cancer risk via rice consumption: A case study in Miaoqian village, Longyan, China. Environment International, 68(2014), 154–161. https://doi.org/10.1016/j.envint.2014.03.017
- Kim, H., Song, B., Kim, H., & Park, J. (2009). Distribution of trace metals at two abandoned mine sites in Korea and arsenic-associated health risk for the residents. Toxicology and Environmental Health Sciences, 1(2), 83–90. https://doi.org/10.1007/BF03216468
- Kumar, V., Singh, J., & Kumar, P. (2019). Heavy metals accumulation in crop plants: Sources, response mechanisms, stress tolerance and their effects. Contaminants in Agriculture and Environment: Health Risks and Remediation, 249404, 38–57. https://doi.org/10.26832/aesa-2019-cae-0161-04
- Latifian, M., Liu, J., & Mattiassona, B. (2012). Struvite-based fertilizer and its physical and chemical properties. Environmental Technology (United Kingdom), 33(24), 2691–2697. https://doi.org/10.1080/09593330.2012.676073
- Le Corre, K. S., Valsami-Jones, E., Hobbs, P., & Parsons, S. A. (2009). Phosphorus recovery from wastewater by struvite crystallization: A review. In Critical Reviews in Environmental Science and Technology (Vol. 39, Issue 6). https://doi.org/10.1080/10643380701640573
- Li, B., Wang, Y., Jiang, Y., Li, G., Cui, J., Wang, Y., Zhang, H., Wang, S., Xu, S., & Wang, R. (2016). The accumulation and health risk of heavy metals in vegetables around a zinc smelter in northeastern China. Environmental Science and Pollution Research, 23(24), 25114–25126. https://doi.org/10.1007/s11356-016-7342-5
- Li, F., Shi, W., Jin, Z., Wu, H., & Sheng, G. D. (2017). Excessive uptake of heavy metals by greenhouse vegetables. Journal of Geochemical Exploration, 173, 76–84. https://doi.org/10.1016/j.gexplo.2016.12.002
- Li, Q. S., Cai, S. S., Mo, C. H., Chu, B., Peng, L. H., & Yang, F. B. (2010). Toxic effects of heavy metals and their accumulation in vegetables grown in a saline soil. Ecotoxicology and Environmental Safety, 73(1), 84–88. https://doi.org/10.1016/j.ecoenv.2009.09.002
- Liang, G., Gong, W., Li, B., Zuo, J., Pan, L., & Liu, X. (2019). Analysis of heavy metals in foodstuffs and an assessment of the health risks to the general public via consumption in beijing, China. International Journal of Environmental Research and Public Health, 16(6). https://doi.org/10.3390/ijerph16060909
- Liu, X., Song, Q., Tang, Y., Li, W., Xu, J., Wu, J., Wang, F., & Brookes, P. C. (2013). Human health risk assessment of heavy metals in soil-vegetable system: A multi-medium analysis. Science of the Total Environment, 463–464, 530–540. https://doi.org/10.1016/j.scitotenv.2013.06.064
- Luo, C., Liu, C., Wang, Y., Liu, X., Li, F., Zhang, G., & Li, X. (2011). Heavy metal contamination in soils and vegetables near an e-waste processing site, south China. Journal of Hazardous Materials, 186(1), 481–490. https://doi.org/10.1016/j.jhazmat.2010.11.024
- Macoveanu, M., Gavrilescu, M., & Popa, V. I. (2010). Biomass – a source of chemicals and energy for sustainable development. In Environmental Engineering and Management Journal (Vol. 9, Issue 11).
- Mahalakshmi, M., Balakrishnan, S., Indira, K., & Srinivasan, M. (2012). Characteristic levels of heavy metals in canned tuna fish. Journal of Toxicology and Environmental Health Sciences, 4(2), 43–45. https://doi.org/10.5897/jtehs11.079
- Martorell, I., Perelló, G., Martí-Cid, R., Llobet, J. M., Castell, V., & Domingo, J. L. (2011). Human exposure to arsenic, cadmium, mercury, and lead from foods in catalonia, Spain: Temporal trend. Biological Trace Element Research, 142(3), 309–322. https://doi.org/10.1007/s12011-010-8787-x
- Mehta, N., Dino, G. A., Ajmone-Marsan, F., Lasagna, M., Romè, C., & De Luca, D. A. (2018). Extractive waste management: A risk analysis approach. Science of the Total Environment, 622–623, 900–912. https://doi.org/10.1016/j.scitotenv.2017.11.260
- Mensah, E., Kyei-Baffour, N., Ofori, E., & Obeng, G. (2009). Influence of Human Activities and Land Use on Heavy Metal Concentrations in Irrigated Vegetables in Ghana and Their Health Implications. Appropriate Technologies for Environmental Protection in the Developing World, December, 1–7. https://doi.org/10.1007/978-1-4020-9139-1
- Nag, R., O’Rourke, S. M., & Cummins, E. (2022). Risk factors and assessment strategies for the evaluation of human or environmental risk from metal(loid)s – A focus on Ireland. Science of the Total Environment, 802, 149839. https://doi.org/10.1016/j.scitotenv.2021.149839
- Niwagaba, C. B., Mbeguere, M., & Strande, L. (2014). Faecal Sludge Quantification, Characterisation and Treatment Objectives. In Faecal Sludge Management.
- Obeng, A., Dede, S., Kwaansa-ansah, E. E., & Miyittah, M. K. (2020). Quality assessment and potential health risk of heavy metals in leafy and non-leafy vegetables irrigated with groundwater and municipal-waste-dominated stream in the Western Region, Ghana. Heliyon, 6(February), e05829. https://doi.org/10.1016/j.heliyon.2020.e05829
- Samaniego, J. O., & Tanchuling, M. A. N. (2019). Removal of Heavy Metals from an Actual Small Scale Gold Mining Wastewater by Sorption onto Cocopeat. ASEAN Journal on Science and Technology for Development, 36(1), 1–7. https://doi.org/10.29037/ajstd.558
- Sridhara Chary, N., Kamala, C. T., & Samuel Suman Raj, D. (2008). Assessing risk of heavy metals from consuming food grown on sewage irrigated soils and food chain transfer. Ecotoxicology and Environmental Safety, 69(3), 513–524. https://doi.org/10.1016/j.ecoenv.2007.04.013
- USEPA. (2009a). Risk Assessment Guidance for Superfund, Human Health Evaluation Manual (Part F, Supplemental Guidance for Inhalation Risk Assessment).: Vol. I (Issue January).
- USEPA. (2009b). US EPA Integrated Risk Information System (IRIS). In United States Environmental Protection Agency. https://www.epa.gov/iris
- Vuvor, F., & Harrison, O. (2017). Correlation Between Body Weight and Total Body Fat Composition in Adults in ISSN : 2474-7475 Correlation Between Body Weight and Total Body Fat Composition in Adults in A Community in Ghana Research Article Mathews Journal of Nutrition & Dietetics. Mathews, 2(September), 1–5.
- Westerman, P. W. (2009). Phosphorus Recovery from Concentrated Wastewater with a Continuous-Flow Struvite Crystallizer (Issue September 2007).
- WHO. (1989). Health guidlines for the use of wastewater in agriculture and acquaculture.
- Xiao, W., Ye, X., Zhang, Q., Chen, D., Hu, J., & Gao, N. (2018). Evaluation of cadmium transfer from soil to leafy vegetables: Influencing factors, transfer models, and indication of soil threshold contents. Ecotoxicology and Environmental Safety, 164(March), 355–362. https://doi.org/10.1016/j.ecoenv.2018.08.041
- Yang, S., Zhao, J., Chang, S. X., Collins, C., Xu, J., & Liu, X. (2019). Status assessment and probabilistic health risk modeling of metals accumulation in agriculture soils across China: A synthesis. Environment International, 128(January), 165–174. https://doi.org/10.1016/j.envint.2019.04.044
- Yetilmezsoy, K., & Zengin-Zehra, Z. (2009). Recovery of ammonium nitrogen from the effluent of UASB treating poultry manure wastewater by MAP precipitation as a slow release fertilizer. Journal of Hazardous Materials, 166(1), 260–269. https://doi.org/10.1016/j.jhazmat.2008.11.025
- Zhuang, P., McBride, M. B., Xia, H., Li, N., & Li, Z. (2009). Health risk from heavy metals via consumption of food crops in the vicinity of Dabaoshan mine, South China. Science of the Total Environment, 407(5), 1551–1561. https://doi.org/10.1016/j.scitotenv.2008.10.061