Background Noise Level in Niger Delta University Water Factory
- Godwin E. Ogobiri
- Biere, P. E
- Precious Ubah
- Ibuama E. Abule
- 484-492
- Apr 22, 2024
- Water Pollution
Background Noise Level in Niger Delta University Water Factory
Godwin E. Ogobiri, Biere, P. E, Precious Ubah, Ibuama E. Abule
Department of Physics, Niger Delta University,
Bayelsa State, Nigeria.
DOI: https://doi.org/10.51584/IJRIAS.2024.90344
Received: 13 February 2024; Revised: 28 February 2024; Accepted: 05 March 2024; Published: 22 April 2024
ABSTRACT
This research work is aims at determining the noise level in the Niger Delta University water factory for both operational and non-operational as shown in the various tables. Figure 1 and figure 2 shows the bar charts of the various noise levels of the water factory when the factory was in operational and non-operational. Figure 3 is a bar chart of the combine operational and non-operational noise levels in the water factory. In figure 1, the noise level is highest at the finished product store-room with a noise level value of 113.7 dB(A) as against 80.5 dB(A) in the bottle water store-room. Figure 2 indicate when the factory was non-operational the highest noise level is found in the payment room with a noise value of 67.4 dB(A) and the lowest noise level in the bottle water packaging room of noise value of 35.4 dB(A) this can be due to human activities that are taking place in the payment room. Figure 3: Shows the shows the bar chart for both operational and non-operational noise levels of the water factory, For the operational the finished product store-room has the highest with 113.7 dB(A) as against the non-operational in the bottle water packaging room which has a lower noise level value of 35.4 dB(A) this is compare to the permissible limit as recommended by WHO of 75dB(A) for eight (8) working hours.
Index Terms: water, noise, noise level, material, measurement.
INTRODUCTION
Generally, noise can create negative emotions of feeling surprise, frustration, anger and fear. Andrzej et al, (2021) noted that noise can influence complex phenomenon which have a wide range of implications on human perception, cognition, physical and mental health, Occupational noise in factories is a major problem for workers and employers alike, excessive noise can lead to hearing loss, fatigue, and other health related issues. Ahmed, (2012) states that occupational noise is a common environmental factor that can have a major impact on individuals in both positive and negative ways. Occupational noise is the collective sound of any ambient noise present in a given environment which include sound from people talking, to the sound of traffic or airplanes flying overhead, to the hum of air conditioners and responses from machines used in factory for production. Occupational noise can interfere with communication, impairing the ability to understand and comprehend speech. Kroemer et al. (2020) stated that occupational noise has a psychological and subjective feeling. Hafiz (2012) in his study noted that industrialization in many developing countries, including Nigeria, has seen a significant rise over the past few decades, resulting in the establishment of many industries. Unfortunately, those employed in these industries are often exposed to occupational hazards, thereby putting them at risk of work-related diseases and injuries. There are several factors that influence the occupational noise level in a factory. these include the type of machinery used, the distance from the source of the noise, the size of the area, and the materials used for constructing the factory. The impact of occupational noise level in the Niger Delta University Water Factory cannot be overemphasized. occupational noise can interfere with the operations of the factory, leading to a decrease in productivity and efficiency. It can also create a hostile working environment for workers, leading to increased stress levels and decreased morale. Furthermore, occupational noise can affect the quality of the water produced by the factory, resulting in a decrease in product quality and customer satisfaction. occupational noise can be a source of noise pollution in the surrounding area, leading to complaints from students whose classes are held close to the Water Factory at the New Site campus of the Niger Delta University, Bayelsa State, hence this study is apt and necessary.
The Niger Delta University Water Factory is located at the newsites university campus. As a result of the mechanical activities of the factory equipments on daily basis, workers and office users are constantly expose to this occupational noise hazard, hence this research work is been conducted to evaluate the noise level the environment.
The objectives of this research work include the following
- To measure the noise levels at different points in the Niger Delta University Water Factory.
- To assess the impact of occupational noise on the health and well-being of workers in the facility.
- To identify potential sources of occupational noise and their contribution to the overall sound level and which will aid the university management in implementing better and more effective noise pollution control measures, that will help improve the overall quality of life of the workers in the factory to better understand the effects of occupational noise pollution and its impact on their lives.
The Niger Delta University Water Factory is a factory located in the Niger Delta University is an affiliate of the Directorate of Consultancy, Entrepreneurship, Research and Development (DOCERAD) that is responsible for producing and distributing table water within the university and environs.
This research work was carried out in the Niger Delta University Water Factory Amassoma, Bayelsa state. The factory is located in the Niger Delta University is an affiliate of the Directorate of Consultancy, Entrepreneurship, Research and Development (DOCERAD) that is responsible for producing and distributing table water. The factory is located on Longitude N 04 58 05.8 and Latitude E 006 05 51.3. The university was established in 2000 by the Bayelsa State Government, and currently made up of four (4) campuses namely Gloryland campus, Newsite campus, College of Health sciences (CHS) campus and the Faculty Law campus. As part of its efforts to address the educational needs of the people in the Niger Delta region and promote human capital development. Academic activities began in the year 2001 with three faculties and has since grown to offer a wide range of courses across various disciplines.
The Niger Delta University is surrounded by the scenic beauty of the Niger Delta region, with its vast mangrove forests, creeks, and rivers. This setting provides a unique environment for both academic and recreational activities. In recent years, the Niger Delta University has embarked on a massive expansion project, which includes a Newsite for the university. The NDU Water Factory is a facility that is aims at promoting entrepreneurship, skill acquisition among students and members of the surrounding communities. It is designed to provide hands-on training in various trades and help students develop practical skills that are essential in the job market. At the NDU water Factory, students have the opportunity to participate in practical workshops, internships, and mentorship programs. They learn how to apply theoretical knowledge to real-world situations and gain valuable work experience.
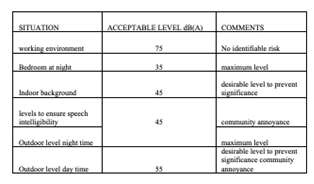
Table 1: Acceptable Standard Noise Level by WHO
MATERIALS AND METHOD
The research work employs the use of noise monitoring techniques through the use of Global positioning system (GPS), Digital sound level meter and a measuring tape to measure. A hand-held Global positioning system (GPS) was use to locate the precise coordinates of the various areas of factory, the Digital sound levels meter was used to measure the sound levels of the different locations within the factory
Digital. Sound Meter
The Digital sound meter is an electronic device used to measure sound levels in various location within the factory environments. It determines sound levels in decibels (dB) allowing users to accurately measure the noise levels in any given area.
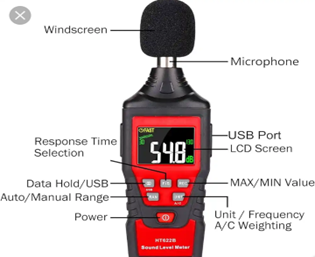
Fig 1: A typical Sound meter with it’s features
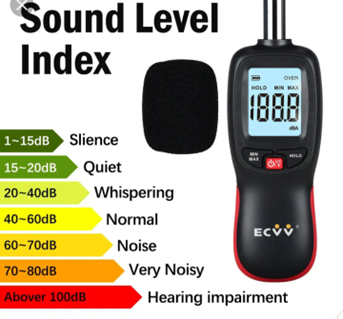
Figure 2: Sound levels in Decibel
Features Of Digital Sound Level Meters
The digital sound level meter is designed to measure the sound level requirement of safety engineer, health and quality control at various environments such as for home, use, industrial use, schools, offices it is also used for checking acoustic of studios, auditoria and home HI-FI Installations.
Their features are stated below
The digital frequency ranges include 30Hz- 12Hz. other frequency ranges include the following
Low Noise. 30-80dB
Medium Noise. 50-100dB
High Noise. 80-130dB
Frequency weighting. A and C
Time weighting. Slow and fast
Maximum hold. Hold Noise reading with delay for 3 minutes
Measurement
Noise measurement was obtained, the at different locations within the water factory, the Digital sound level meter was used in obtaining the noise levels of the various areas within the water factory and was set to A-weighting and slow response to ensure proper accuracy throughout the exercise. The A-weighting network was used because it is commonly used
for industrial and environmental noise. In effect it selects the low frequency sound energy that correlates well with the human response. All readings were written as dB(A), where A stands for the A-weighting. The digital sound level meter was held with its microphone at a distance of about 1.2 m above the ground which is the approximate average ear of ground distance for a human being.
RESULTS AND DISCUSSION
Table 2: Noise Levels in different locations in The Water Factory when the Factory is operational
| LOCATION | Noise Level 1 db(A) | Noise Level dB(A) | Mean |
| Sachet water production room 1 | 102.3 | 102.4 | 102.3 |
| Sachet water production room 2 | 90.5 | 90.4 | 90.5 |
| Sachet water Production Room 3 | 101.5 | 101.4 | 101.5 |
| Entrance of sachet water factory | 98.6 | 98.5 | 98.6 |
| Corridor of sachet water production Rooms | 80.8 | 80.7 | 80.8 |
| Bottle water packaging room | 80.5 | 80.4 | 80.5 |
| Entrance of bottle water packaging room | 80.5 | 80.4 | 80.5 |
| Pet blowing room | 100.31 | 100.2 | 100.3 |
| Payment room | 96.5 | 96.4 | 96.5 |
| Common room | 101.5 | 101.4 | 101.5 |
| Room location (Garment) | 100.1 | 100 | 100.1 |
| Sachet water store room | 100.3 | 100.2 | 100.3 |
| Labeling stappling room | 100.2 | 100.1 | 100.2 |
| City control room | 100.6 | 100.5 | 100.6 |
| Ozone generator room | 99.1 | 99 | 99.1 |
| Bottle water packaging location | 83.2 | 83.1 | 83.2 |
| Finished product store | 113.7 | 113.6 | 113.7 |
| Quality control room | 98 | 97 | 98 |
| Bottle water store room | 80.5 | 80.4 | 80.5 |
| Vehicle pack | 100.8 | 108.7 | 108.8 |
Table 3: Noise level of different locations in the factory during non-operational
| NAME/LOCATION | Noise Level 1 dB(A) | Noise Level 2 db(A) | Mean |
| Sachet water production room 1 | 56.2 | 56.1 | 56.2 |
| Sachet water production room 2 | 54 | 53 | 54 |
| Sachet water Production Room 3 | 53.7 | 53.6 | 53.7 |
| Entrance of sachet water factory | 54.7 | 54.6 | 54.7 |
| Corridor of sachet water production Rooms | 53.6 | 53.5 | 53.6 |
| Bottle water packaging room | 35.4 | 35.3 | 35.5 |
| Entrance of bottle water packaging room | 55 | 54 | 55 |
| Pet blowing room | 58.7 | 58.6 | 58.7 |
| Payment room | 67.4 | 67.3 | 67.4 |
| Common room | 62.4 | 62.3 | 62.4 |
| Room location (Gratment) | 55.1 | 55 | 55.1 |
| Sachet water store room | 55.1 | 55 | 55.1 |
| Labeling stamping room | 57.4 | 57.3 | 57.4 |
| City control room | 57.1 | 57 | 57.1 |
| Ozone generator room | 57.5 | 57.4 | 57.5 |
| Bottle water packaging location | 50.2 | 50.1 | 50.2 |
| Finished product store | 53.5 | 53.4 | 53.5 |
| Quality control room | 60.6 | 60.5 | 60.6 |
| Bottle water store room | 54.7 | 54.6 | 54.7 |
| Vehicle pack | 60.4 | 60.3 | 60.4 |
Table 4: Noise level of different locations in the factory during Operational and non-operational
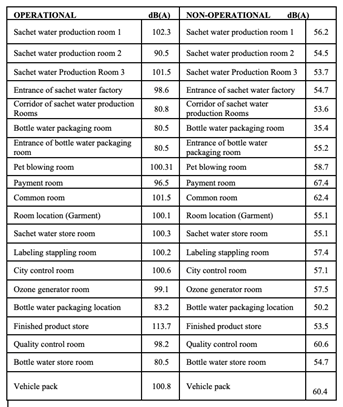
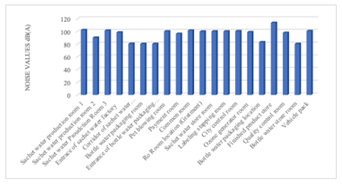
Fig 1 Noise level of water factory during in operation
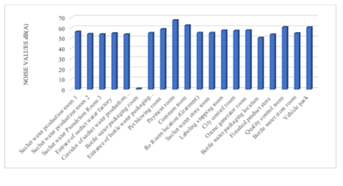
Fig 2: Noise level of water factory during non-operation
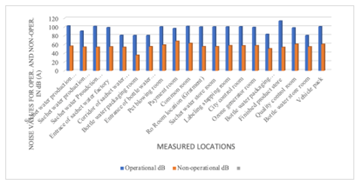
Fig .3: Noise level of water factory during operation and non-operation
DISCUSSION OF RESULTS
Table 1, Shows the acceptable World Health Organization (WHO) standard for noise for different environments, Table 2 Indicate the noise levels in different locations in the water factory when the factory was operational, Table 3 Indicate the noise levels in different locations in the water factory when the factory was non-operational while Table 4 shows the values for both the noise values when the water factory was both operational and non-operational.
Figure 1 and figure 2 shows the bar charts of the various noise levels of the water factory when the factory was in operation and non-operation, indicating the various locations in the water factory, Figure 3 is a bar chart of the combine operational and non-operational noise levels and the various locations in the water factory. In figure 1, the noise level is highest at the finished product store-room with a noise level value of 113.7 dB(A) as against 80.5 dB(A) in the bottle water store-room.
Figure 2 indicate when the factory was non-operational, the highest noise level is found in the payment room with a noise value of 67.4 dB(A) and the lowest noise level in the bottle water packaging room of noise value of 35.4 dB(A). this can be due to human activities that are taking place in the payment room.
Figure 3: Shows the shows the bar chart for both operational and non-operational noise levels of the water factory. For the operational the finished product store-room has the highest with 113.7 dB(A) as against the non-operational in the bottle water packaging room which has a lower noise level value of 35.4 dB(A).
CONCLUSION AND RECOMMENDATION
This research work presents the noise levels of different locations in the water producing factory when it is operational and non-operational in the Niger Delta University Water Factory. It provides a list of various locations within the water factory and the corresponding noise levels measured in decibels dB(A). The measured locations are sachet water production room 1, sachet water production room 2, sachet water production room 3, entrance of sachet water factory , corridor of sachet water production rooms, bottle water packaging room, entrance of bottle water packaging room , pet blowing room, payment room, common room, (garment), sachet water store room , labeling, stapling room, city control room, ozone generator room, bottle water packaging location, finished product store, quality control room, bottle water store room, vehicle pack for during operational and non-operational periods. From the results obtain, it was observed that during operational background noise levels ranging from 80.5 dB(A) to 113.7 dB(A). While for the non-operational background noise levels ranging from 35.5 dB to 67.4 dB(A), with the Bottle water packaging location recording the highest the non-operational areas. The values of operational period are higher and those for non-operational is lower than the permissible limits as provided by World Health Organization (2000) 75 dB(A).
Recommendation
My recommendations are as follows
- Headgear with noise reduction technology should be used in the water factory during working hours.
- Workers should be on shift in order to minimize the impacts of noise on them.
- The use of install soundproofing materials such as acoustic foam, rigid fiberglass insulation, and sound curtains, can help to reduce noise levels in the water factory.
- The installation of quieter machinery in a water factory can have a number of positive impacts. It can improve working conditions for employees, reduce noise pollution in the surrounding area, and even help to improve the efficiency of the factory.
- The use of the utilize vibration-absorbing mounts can help to reduce background noise in a water factory by reducing the vibrations that create sound.
REFERENCES
- Ahmed, S. (2012). Environmental Noise Effect on Environmental Ecosystems. Journal of Environment, 2(1), 45-67.
- Andrzej, K. A., & Jolanta, J. (2021). Effects of Noise on Human Perception and Cognition. Archives of Acoustics, 46(1), 1-17.
- Donald, N. (2020). Noise Pollution and Its Effects on the Community. Journal of Environmental Management and Tourism, 11(9), 2155-2162.
- Fulham, D. J. (2020). Assessing Background Noise in a Water Treatment Plant. Water, 12(1), 182.
- Hafiz, B. (2012). Noise Pollution in Nigeria: A Threat to Health. American Journal of Environmental Protection, 1(3), 70-76.
- Leventhal, T. (2003). Effects of Environmental Noise on Mental Health of Adults in a Rural Area: Survey. Noise and Health, 5(18), 45-56.
- Newman, R. L. (2020). Industrial Noise Pollution: Causes, Effects, and Control Strategies. Noise Control Engineering Journal, 68(5), 359-381.
- Olayinka, S. T., Olayinka, O. O., & Akinyemi, M. L. (2008). Source Characteristic of Noise Pollution in Eastern Nigeria. Environmentalist, 28(4), 355-363.
- Smith, D. C. (2014). Noise: A Human History of Sound and Listening (Vol. 34). Random House.
- World Health Organization (WHO 2000). Environmental Noise Guidelines for the European Region. Retrieved from https://www.euro.who.int/en/health-topics/environment-and-health/noise/publications/2018/environmental-noise-guidelines-for-the-european-region-2018.
- Mohammed Al Bahri, Al Maha Al Habsi and, Khalid Al Hashmi (2023). Noise Measurements in Residential Areas in North A’ Sharqiyah Region -Oman.
- Ahmad Said Abubakar, Nura Isyaku Bello, Muhammad Salisu Khalil, Abdulkadir Bello (2021). Assessment of The Effects of Noise Pollution on Students’ Performance in Kano Metropolitan Local Government Areas.