Effect of Rainfall on Seasonality of Malaria Transmission Dynamics and percentage occurrence of mRDT positives around the five rural Health facilities in Vihiga County, Kenya
- Ongonda, John Khamala
- Ayieko, Cyrus
- Munde, Elly
- Miheso, Stephen
- 528-539
- Apr 24, 2024
- Water Pollution
Effect of Rainfall on Seasonality of Malaria Transmission Dynamics and Percentage Occurrence of mRDT Positives Around the Five Rural Health Facilities in Vihiga County, Kenya
Ongonda, John Khamala1, Ayieko, Cyrus1, Munde, Elly2, Miheso, Stephen1
1Department of Zoology, Maseno University, Kenya
2Department of Clinical Medicine, Kirinyaga University, Kenya
DOI: https://doi.org/10.51584/IJRIAS.2024.90347
Received: 28 February 2024; Revised: 18 March 2024; Accepted: 23 March 2024; Published: 24 April 2024
ABSTRACT
Background: The negative impact and concern of malaria is felt world over with 247 million cases reported in 2021. The cases were reported in 84 malaria endemic countries with high number of casualties experienced in Africa. Normally, malaria infection is influenced by climatic factors while its treatment and resilience to drugs is controlled by health interventions measures both at the hospital level and in the community. Malaria Rapid Diagnostic Tests (mRDTs) are recommended by WHO for malaria testing and are expansively used in rural set-ups. However, their success in performance is controlled by many factors. This study aimed at correlating the effect of rainfall patterns to malaria positive case as tested by mRDT in Vihiga County, Kenya.
Methodology: This study focused on the participation of 500 patients from a population of 18201 patients within a two (2) Kilometre radius of the five rural health facilities in Vihiga County. Facilities had poor infrastructure in terms of malaria testing and mostly relied on mRDT for malaria testing and surveillance. Data was collected from the five health facilities at the end of every month for a period of twelve months. The rain gauge reading was also collected daily by Vihiga metrological department from which the average monthly rainfall was computed. This was run from April 2022 and March 2023. Care start TM Rapid Diagnostic Tests were used to detect HRP2/3 proteins/antigens which are specifically responsive to Plasmodium falciparum antibodies.
Results and Data Analysis: Average rainfall for the period between April 2022 and March 2023 was 185mm; the average percentage prevalence of malaria during the same period in this region was 21.3%. This region experienced one peak of rainfall recorded at 360mm in the month of September; 2022.The month of April recorded the highest malaria prevalence of 38.4% with an average rainfall amount of 311.7mm while February recorded the lowest malaria prevalence of 7.16% with an average rainfall amount of 0.2mm. The data showed that there were more patients in the middle age category of between five (5) and eighteen (18) years. More women came to the facilities than men; hence more women were malaria positive than men. Linear regression analysis was performed which emerged that the average rainfall accounts for 28.37% variations in prevalence (R2=0.2837). The model coefficient showed that average rainfall has a positive significant effect on prevalence (β=0.0591, p<0.05). This implies that malaria prevalence is determined by rainfall amount. Although the infection rate is on the downward trend, there was a constant of 10 from the model equation which is apparent that malaria infection is not dependent on rainfall alone; there could be other factors as well.
Conclusion: This study reported fluctuating average rainfall throughout the year. There was fluctuating average malaria prevalence as well. When the average rainfall was high, average malaria prevalence was also high and the converse was true. Therefore, rainfall significantly caused the malaria infection in this region. High rainfall is a significant determinant of malaria prevalence.
Keywords: Malaria diagnosis, Pfhrp2/3 gene deletions and malaria RDT
INTRODUCTION
Malaria remains a devastating public health challenge not only in Africa but also the world as a whole1. 2. This disease is caused by any of the five species-of the Plasmodium genus, namely: Plasmodium vivax, Plasmodium malariae, Plasmodium ovale, Plasmodium knowlesi and Plasmodium falciparum3, 4. In the year 2020, the world recorded a total of 229 million malaria cases, a situation that has not changed for the last four years 4, 5, 6. Seventy percent (70%) of the total count of the malaria cases in the world was reported in Africa while Kenya registered about 3.5 million new clinical malaria cases of which 10,700 patients died annually 7, 8. Vihiga County is endemic to malaria and registers 20% cases of all outpatients’ visiting health facilities in this region9, 10.
Microscopy, once considered the gold standard, has been used for malaria diagnosis for a very long time though other methods have been discovered as well. Malaria Rapid Diagnostic Tests (mRDTs) is one such method that is expansively used in rural areas in Vihiga County. They are mostly preferred because they are cheap and easy to interpret since they do not require highly specialized training. The use of mRDT does not also require electricity which lacks in most rural health facilities in Kenya4, 11, 12, 13. Rapid Diagnostic Tests, technically use an immunochromatographic device that is coated with monoclonal antibodies (Mab) which are specific to Plasmodium falciparum Histidine Rich Proteins (Pfhrp2/3) antigens in the blood sample2, 4, 7, 14, 15.These antigens are soluble proteins found circulating in the blood stream of a malaria infected individual but some are also found on the Plasmodium falciparum parasite5, 16, 17, 18. The use of RDTs has improved malaria case management and surveillance in Kenya4, 19, 20, 21, 25. They have a weakness of being influenced by seasonality of malaria transmission, asymptomatic cases in populations and parasite genetic factors and as a result of errors made by the end-users4, 23, 13.
Seasonality is a key broad component that controls and affects rainfall patterns, temperature variations, formation of ponds and swamps and either sustains continuous flow or diminishes the flow of water in some rivers. All these parameters affect the malaria transmission cycles and consequently, the use of mRDTs4, 16, 22. Heavy rainfall (1800mm to 2000mm) during both short and long rain seasons coupled with high humidity and temperature (140C to 320C) provides a good environment for faster breeding of the mosquito hence increased malaria transmission and infection4, 17, 24, 25, 26. Low parasite detection rate has been linked to increased expression of Pfhrp2/3 gene deletions and this has been attributed to super infection by the malaria parasites5, 27, 28. This therefore implies that there should be more studies on how seasonality affects malaria intensity and distribution of Pfhrp2/3 gene deletions which in turn affects RDTs.
To control the devastating effects of malaria, it is worth noting that it is a treatable disease if is diagnosed early followed by proper treatment of the patients16, 29, 30. Since malaria occurrence and testing in endemic areas strongly follows the patterns defined by malaria seasonality, it is prudent to not the significance of mRDT towards detection of infection and its ultimate role to malaria control1, 4, 14, 15. Therefore the objective of this study was to analyse effect of rainfall on seasonality of malaria transmission dynamics and percentage occurrence of mRDT positives around the five rural health facilities in Vihiga County, Kenya
METHODOLOGY
Study design:
This study was a cross-sectional survey that utilized data on malaria positive cases from the five satellite health facilities in Vihiga County, Kenya.
Study Area
The study area was Vihiga County, Kenya. It is located 0017’N, 34074’E, and receives rainfall ranging between 1800mm-2000mm with distinct long and short rainy seasons. The mean temperature is 230C, ranging between 140-320C. The altitude varies between 1300m and 1500m above sea level25. Vihiga County has a population of 637,844 persons of which 52.5% are female and 47.8 % are male. The County has 144,000 households with a mean household size of 4.3 persons. It has the highest population densities in Kenya of 1,094 persons per square kilometre compared to the national average of 66 persons per square
kilometre31. In Vihiga County, malaria is endemic and with mosquito bites of over 300 per month, it (Malaria) is experienced throughout the year with peaks of transmission during long rains (April, May and July) and short rains (October, November and part of December). In Vihiga, the entomological inoculation rate (EIR) varies with specific location from 6.000-0.145 infective bites/person/night17, 24, 25.
Fig: 1: Sampled rural health facilities within Vihiga County
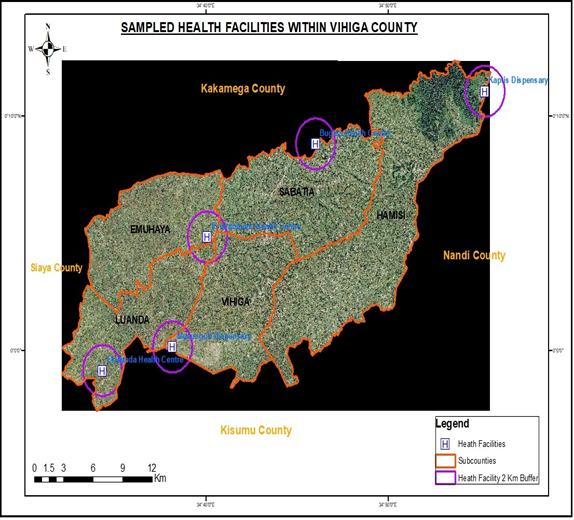
Source: County government of Vihiga Geographical Information System (GIS) laboratory
Sampling procedure and data collection:
This study purposefully sampled five (5) health facilities from the five sub county administrative units of Vihiga County as shown if Fig 1. The health facilities of focus were Ekwanda, Bugina and Esiarambatsi from Luanda, Sabatia and Emuhaya Sub Counties respectively. The sample size calculation employed Taro Yamane (1967) formula revised in Anokye (2020)32 given as:
The adjusted Yamane’s formula is;
n = N/1+Nd2
- N= The Population (Value of 18, 201)
- d= The precision
- n=The required sample size
Using a precision of d=0,05 at 95% confidence interval, the formula yielded an n value of 391.Similarly, with a d value of 0.04 at 96% confidence interval, the formula gave a sample size of 604. This therefore meant that from our population of 18,201 malaria patients, a sample of 500 respondents was appropriate. Beyond 96% confidence interval, the formula will give a sample population that will be uneconomically sustainable. This sample size of 500 was proportionately distributed as shown in Table 1.
Table 1: The proportionate distribution of the Sample size as per Health facility
| NO | Health facilities | Population | Proportion |
| 1 | Bugina | 3622 | 100 |
| 2 | Ekwanda | 4700 | 129 |
| 3 | Esiarambatsi | 5776 | 159 |
| 4 | Musunguti | 2525 | 69 |
| 5 | Kaptis | 1578 | 43 |
| N = 18201 | n = 500 |
Data was collected from the five health facilities and it included the number of malaria positives from the suspected patients, the frequency of facility visits by the patients and the type of treatment administered. Sleeping under of treated mosquito nets and malaria vaccination for the under-five years was also assessed. The participants were randomly selected and consented to the study. They had come to the facilities with any of the following symptoms; high fever, nausea, headache, diarrhoea, vomiting, joint pains and prostration. Malaria positivity status was diagnosed with mRDT and confirmed by microscopy.
Inclusion criteria
This study included consenting subjects of all ages who availed themselves for health services from the sampled rural health facilities in Vihiga County.
Exclusion Criteria
Patients who were non-permanent residents of Vihiga County, did not consent or their parents/Guardian did not consent to the study were excluded from the study.
DATA COLLECTION AND ANALYSIS
Both quantitative and qualitative data were analyzed to assess significance of rainfall patterns malaria transmission in the communities. Data was entered using access data base Microsoft software.
Data was analyzed using least square line regression model of y = α + βx where:
y = Average prevalence
α = Constant term
x = Average rainfall
β = Regression coefficient/The gradient
RESULTS AND ANALYSIS
Data on average monthly rainfall and average malaria prevalence was collected, harnessed analysed in this section in Table 2. Comparison between the average rainfall amount and average monthly malaria prevalence was made and presented in Fig 3.
Table 2: Average monthly Rainfall against malaria prevalence for the five health facilities
| Month | Average monthly Rainfall (mm) | Bugina H.C | Ekwanda H.C. | Esiarambatsi
H.C. |
Kaptis Disp. | Musunguti Disp | Average malaria prevalence |
| Apr | 311.7 | 33.6 | 48.2 | 51.9 | 29.1 | 29.1 | 38.38 |
| May | 320.9 | 18.1 | 40.9 | 41.6 | 15.1 | 21.1 | 27.36 |
| Jun | 176.8 | 13 | 43.3 | 39.1 | 24.8 | 36.1 | 31.26 |
| Jul | 132 | 10.2 | 35 | 34.5 | 19.7 | 28.9 | 25.66 |
| Aug | 258.9 | 33 | 44.1 | 26.9 | 11.5 | 11.3 | 25.36 |
| Sep | 359.8 | 28.7 | 29.1 | 26.2 | 28.6 | 26.9 | 27.9 |
| Oct | 180 | 6.4 | 9.7 | 23 | 19.3 | 7.6 | 13.2 |
| Nov | 198 | 10.1 | 15 | 10.1 | 7.4 | 5 | 9.52 |
| Dec | 247 | 24.5 | 42.7 | 24.1 | 15.6 | 8.3 | 23.04 |
| Jan | 0.8 | 9.3 | 7.6 | 9.7 | 17.1 | 20.3 | 12.8 |
| Feb | 0.2 | 4.8 | 5.8 | 6.9 | 8.6 | 9.7 | 7.16 |
| Mar | 35 | 9.1 | 16.1 | 12 | 14.7 | 16.5 | 13.68 |
In Vihiga County, the average rainfall for the period between April 2022 and March 2023 was 185.025 mm (Table 2). The records indicate high average rainfall though there is a general trend towards reduction of rainfall in this region24, 25. This trend could be attributed to global warming brought about by climate change34. Naturally, 185.025 mm rainfall and warm temperatures is a recipe for proliferation of the arthropod vector which exacerbates the rate of malaria transmission and infection. The average percentage prevalence of malaria in this region is 21.3%; this percentage score is slightly higher than 20% initially reported
in Vihiga5, 8. Malaria infection in this area has remained fairly high with a range of 31.223% (Table 2).
Fig 2: Comparison between average monthly rainfall and average malaria monthly prevalence
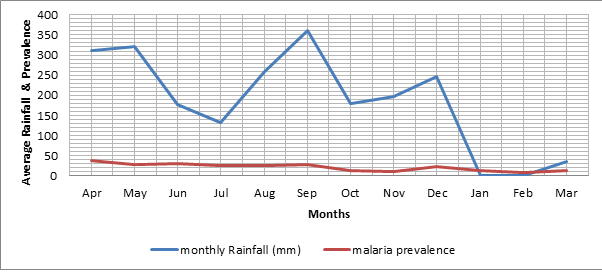
During this period under study (twelve months), this region experienced one peak (360mm) of rainfall experienced in the month of September, 2022. The second and third highest months with high amount of rainfall were May and April with 321mm and 312mm respectively. This was a deviation from the historical bimodal peak of rainfall pattern in Kenya which is usually recorded in April and June then October and December5. April recorded the highest malaria prevalence (38.4%) as diagnosed by mRDT. The month of June had the second highest malaria infections (31.3%) while May had the third highest (27.4%). Incidentally, the month with the lowest amount of rainfall had a prevalence of 7.16%; which is less than the average prevalence of malaria positivity for the Vihiga County which stood at 21.3%. This malaria percentage prevalence was greater than the projected prevalence of 18.6% by Vihiga County annual malaria report by the County Government of Vihiga, Department of health34.
Fig 3: Scatter plot Regression Analysis of Rainfall and Malaria prevalence in Vihiga County, Kenya
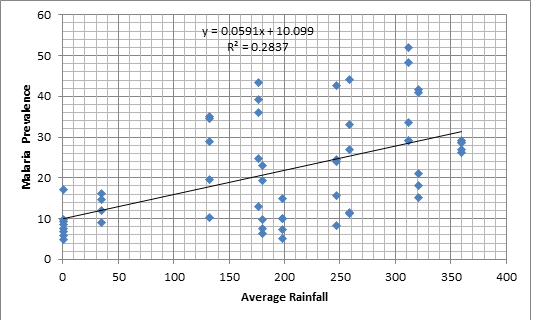
To analyze the linear relationship between the average amount of rainfall and average amount of malaria prevalence, a scatter plot was designed from the data obtained and the line of best fit drawn.
This data was analyzed using least square line regression model and can be represented in the model equation (Line of best fit) as: y=0.0591x + 10.099 as shown in Fig 2 above. This meant that, a unit increase on average rainfall leads to an increase on prevalence by a magnitude of 0.0591 units hence average rainfall significantly impacts on malaria prevalence
When analyzed using the least square line regression model, it gave a value of R2 = 28.37% which indicated that average rainfall has a positive (β = 0.0591, p < 0.05) which was represented in the model equation. The range for the percentage prevalence was 31.22%. which was high an indication that there were varied prevalence in malaria episodes which was reported by Centre for Disease Control-CDC which stood at 20% 7, 9.
From the findings, linear regression analysis was performed and it emerged that the average rainfall accounts for 28.37% variations in prevalence (R2=0.2837). Using the model coefficient results, it was also found that the average rainfall has a positive significant effect on prevalence (β=0.0591, p<0.05). This implies that malaria prevalence is determined by rainfall amount. Although the infection rate is on the downward trend, there was a constant of 10 from the model equation which is apparent that malaria infection is not dependent on rainfall alone; there could be other factors as well.
DISCUSSION
Malaria is one of the diseases that is affecting the people of Vihiga County. Due to favorable geographical and climatic conditions that favors proliferation of the mosquito vector has made malaria endemic in Vihiga. The infection and prevalence of malaria is defined by seasonal peaks. The intervention measures towards control and management should also peak with equal measure. Malaria surveillance and reporting is therefore an imperative aspect of disease control since it helps to monitor seasonal variations and advise stakeholders on specific response mechanisms towards the same. The policies directed towards malaria control should be backed with well researched empirical data output/statistics stemming from seasonal malaria outbreaks. This study was designed to make rainfall pattern and malaria prevalence status as two strong pillars that either controls infection to the benefit host, vector or the Plasmodium falciparum parasite.
The knowledge on malaria seasonality and targeted intervention measures enhance cost effectiveness in managing malaria outbreak. Stakeholders in the health sector should use this information to advice, with precision, on whether to mitigate or combat the Plasmodium parasite. This team can also advice on Indoor Residual Spraying (IRS), giving intermittent preventive treatment to pregnant mothers/Infants (IPTp/IPTi) in anticipation of an outbreak and finally, health facilities can stock, in anticipation malaria outbreak, more anti-malarial drugs during the peak period to prevent wastage from drugs stocked beyond the ‘sale-by- date’ shelf-life2, 4. 24.
In defining the status of malaria in this County, there is an indication that malaria transmission is on the downward trajectory, albeit gradual. This can be attributed to many parameters which do influence a decline in malaria infection. They include mosquito vector control measures, treatment of malaria patients and civic education on malaria control strategies among others5,35. A drop in malaria transmission in this region, therefore, could be attributed to an increase in malaria intervention strategies which. by extension, influences malaria epidemiology in Vihiga County settings24, 35.
This report relates seasonality of malaria to environmental parameters of rainfall and temperature since the two parameters have a strong influence to the lifecycle of malaria mosquito vectors and consequently the malaria infection rate in the population. This report correlated precipitation/rainfall patterns to malaria transmission processes and it did not establish high malaria prevalence during heavy rainfall as earlier reported25. In Vihiga, there are no distinct bimodal peaks of rainfall since the rainy season is fairly longer than dry spell. This region is also fairly watered by rain in most part of the year and has many rivers and ponds. In the period between April, 2022 and March 2023, these factors kept malaria transmission high at 23.68% of all suspected, tested and confirmed malaria positive patients visiting the health facilities.
This region, does not, only show variations in amount of rainfall between consecutive months but there are variations in malaria monthly prevalence as well. The rainfall was experienced throughout the year and had only one peak (September, 2022) and malaria prevalence was also observed in one peak (April, 2022). Historically, rainfall in this region peaks in March or April but during 2022, it peaked in February33. A deviation in rainfall amount from the historical trend may have been caused by adverse changes in the climate hence resulting to global warming and a consequent change in rainfall patterns. This may have affected malaria infection patterns by converting the once dry months to wet ones. This exacerbates malaria infection challenges. Global warming has interfered with the traditional climatic status hence rainfall, temperature, and malaria outbreak can longer be predictable in this region27, 36. The stakeholders should therefore re-strategize and think over new p0licies directed towards malaria control, diagnosis and treatment in lieu of the above. In fact, the stakeholders should have a complete paradigm shift from the traditional trends of malaria infections and have modern mechanisms of fighting malaria infections.
Information on start, progression and decline for malaria infection is very significant to the health stakeholders if they are to participate effectively and efficiently in malaria control processes. It also advises on planning and mitigation strategies for combating malaria disease. This will include management of the malaria parasite vector (female anopheles mosquito), malaria diagnosis and treatment of the patients. When spatio-temporally mapped, the information can guide or put in place tracking procedures to manage the infections at the point of detection in the human host37. This can be achieved by mapping, by way of geo- referencing, malaria patients and buffering out malaria hot-spots for close monitoring and reporting24. Climate change has also distorted routine malaria infection peaks in this endemic region. It has disrupted the usual malaria predictable patterns of infection. Consequently, predictability in mitigation measures has also been disrupted14, 33. To understand this better and have a fairly reliable set of data to guide on the above, this study delved into looking at the correlation between the amount of rainfall and its influence to malaria infection processes.
In following up with the effect of seasonality to malaria prevalence, this study partly concurred with other report findings that there is a strong correlation between rainfall and the malaria infection rate 25, 33, 38. Three health facilities failed to concur with a study done onrainfall and malaria infection rate by registering negative correlation status (Table 2)25. This study sustained mRDT activities for a period of 12 months which aimed at understanding the rainfall patterns and pointing out malaria positive subjects. This is because prevention of malaria and subsequent treatment is an expensive venture39.
Meanwhile, there is an average prevalence for mRDT positive cases from the five selected health facilities was 23.68%. This value was higher than the 10% reported from a survey done in children and adults along the coastal region in Kenya and 20% reported by world health organisation5, 9. Management of malaria is so involving and time consuming (to both patients and caregivers) that some people seek for extra man-hours off their work stations to attend to malaria patients12. While at home or even in the health facilities, the victims require funds for diagnosis, management and general care. Malaria infection is preventable and if infected, it is treatable, both factors that are under our control. Therefore, all stakeholders including the community, caregivers, health workers and even the County government have a role to play in managing the malaria challenge. If not controlled, the negative effect of malaria causes a negative multiplier effect to the poor households but if contained, the government can re-direct the Malaria funds to other activities that are beneficial to the residents of Vihiga, Kenya..
CONCLUSION
This study reported fluctuating average rainfall throughout the year. There was fluctuating average malaria prevalence as well. When the average rainfall was high, average malaria prevalence was also high and the converse was true. Therefore, rainfall significantly caused the malaria infection in this region. High rainfall is a significant determinant of malaria prevalence. Understanding proper timing of the rainfall and accurate prediction of the malaria infection patterns is very important in contemplating and planning for control of malaria transmission. This information will can be used by stakeholders to re-design malaria control policies and give direction to proper protocol for the deployment of malaria drugs for both treatment and prevention. The stakeholders are made to understand malaria transmission dynamics and subsequent malaria control measures that can be applied to protect populations from the malaria scourge.
RECOMMENDATIONS
- There should enhanced surveillance and accurate mapping of patients to make it easy for follow ups to improve monitoring, evaluation and reporting on impact of malaria in the
- More studies are needed to look at applicability of malaria seasonality as a strategy for managing disease
ACKNOWLEDGEMENT
We are grateful to all that participated directly or indirectly to the success of this study. We thank the staff of the Maseno University Zoology Department, Department of Health, Vihiga County, Kenya and Department of Public Service and Administration, Vihiga County for cooperation during data collection for this study. I particularly acknowledge all my mentors in the department for the tireless efforts in guiding this study. Heads of the facilities, health workers and community health volunteers were very instrumental to this study.
AUTHOR CONTRIBUTIONS
John Khamala Ongonda collected coalesced data and drafted the manuscript under the guidance of Cyrus Ayieko from Maseno University and Elly Munde from Kirinyaga University. Stephen Miheso from Maseno University helped organize the data. He also guided on the statistical analysis for this work.
Competing interests
The authors declare no competing interests
Financial Support:
This study was supported by the authors
ORCID number:
0000-0001-7897-8517
National Commission for Science, Technology & Innovation (NACOSTI), Kenya
Identification Number: 389435 License No: NACOSTI/P/22/18417
Maseno University Scientific and Ethical Review committee
Identification number; MUSERC/01047/22
REFERENCES
- Parsel, M., Gustafson, S. A., Friedlander, E., Shnyra, A. A., Adegbulu, A. J., Liu, Y., Parrish, N. M., Jamal, S. A., Lofthus, E., Ayuk, L., Awasom, C., Henry, C. J., & McArthur, C. P. (2017). Malaria over-diagnosis in Cameroon: Diagnostic accuracy of Fluorescence and Staining Technologies (FAST) Malaria Stain and LED microscopy versus Giemsa and bright field microscopy validated by polymerase chain reaction. Infectious Diseases of Poverty, 6(1), 1. https://doi.org/10.1186/s40249-017-0251-0
- Kristin E. Poti, David J. Sullivan, Arjen M. Dondorp and Charles J. Woodrow, 2020; HRP2: Transforming Malaria Diagnosis, but with Volume 36, Issue 2, February 2020, Pages 112-126; https://doi.org/10.1016/j.pt.2019.12.004.
- Baliga, B. S., Baliga, S., Jain, A., Kulal, N., Kumar, M., Koduvattat, N., Kumar, B. G. , Kumar, A., & Ghosh, S. K. (2021). Digitized smart surveillance and micromanagement using information technology for malaria elimination in Mangaluru, India: an analysis of five-year post-digitization data. In Malaria journal (Vol. 20, Issue 1, p. 139). https://doi.org/10.1186/s12936-021-03656-8
- Josephine Wambani and Patrick Okoth (2022). Impact of Malaria Diagnostic Technologies on the Disease Burden in the Sub-Saharan Africa. Trop Med. PMCID: PMC8964171. PMID: 35360189 Published online 2022 Mar 22. doi: 10.1155/2022/7324281
- Kamau Alice, Mtanje, Grace Mataza Christine, Gabriel Mwambingu, Mturi Neema, Mohammed Shebe, Ong’ayo Gerald, Nyutu Gideon, Nyaguara Amek, Bejon Philip & Robert W. Snow (2020). Malaria infection, disease and mortality among children and adults on the coast of Malaria Journal volume 19, Article number: 210
- Thomson, , Parr, J. B., Cheng, Q., Chenet, S., Perkins, M., & Cunningham, J. (2020). Prevalence of plasmodium falciparum lacking histidine-rich proteins 2 and 3: A systematic review. In Bulletin of the World Health Organization (Vol. 98, Issue 8, pp. 558-568F). https://doi.org/10.2471/BLT.20.250621
- WHO. Malaria Policy Advisory Committee Meeting, 14–16 September2016, Background document for Session 7; P. falciparum hrp2/3 gene deletions, conclusions and recommendations of a technical consultation. Geneva: World Health Organization, 2016. http://www.who.int/malaria/mpac/mpac-sept2016-hrp2- consultation-short-report-session7.pdf
- PMI. (2019). Presiden’ s Malaria Initiative: Malaria Operational Plan for Kenya 2019. 1–75. https://www.pmi.gov/docs/default-source/default-document- library/malaria-operational-plans/fy19/fy-2019-kenya-malaria-operational- plan.pdf?sfvrsn=3
- USAID, & (2020). U.S. President’s Malaria Initiative Cambodia: Malaria Operational Plan FY 2020. 1–136
- WHO Global malaria (2019). False-negative RDT results and P falciparum histidine-rich protein 2/3 gene deletions. Information Note, 2(1), 1–8.
- Akinyi, , Hayden, T., Gamboa, D., Torres, K., Bendezu, J., Abdallah, J. F., Griffing, S. M., Quezada, W. M., Arrospide, N., De Oliveira, A. M. E., Lucas, C., Magill, A. J., Bacon, D. J., Barnwell, J. W., & Udhayakumar, V. (2013). Multiple genetic origins of histidine-rich protein 2 gene deletion in Plasmodium falciparum parasites from Peru. In Scientific Reports (Vol. 3). https://doi.org/10.1038/srep02797
- Kokwaro, Ongoing challenges in the management of malaria. Malar J 8 (Suppl 1), S2 (2009). https://doi.org/10.1186/1475-2875-8-S1-S2
- Bell, D., Wongsrichanalai, C., & Barnwell, J. W. (2006). Ensuring quality and access for malaria diagnosis: How can it be achieved? In Nature Reviews Microbiology (Vol. 4, Issue 9 ). https://doi.org/10.1038/nrmicro1525
- Mateusz M Plucinski, Camelia Herman, Sophie Jones, Rafael Dimbu, Filomeno Fortes, DraganLjolje , Naomi Lucchi, Sean C Murphy, Nahum T Smith , Kurtis R Cruz, Annette M Seilie, Eric S Halsey, VenkatachalamUdhayakumar, Michael Aidoo, Eric Rogier (2019). Screening for Pfhrp2/3-Deleted Plasmodium falciparum, Non-falciparum, and Low-Density Malaria Infections by a Multiplex Antigen Assay. Journal of Infectious Vol:219(3):437-447. doi: 10.1093/infdis/jiy525.
- Korzeniewski, K., & Bylicka-szczepanowska, E. (2021). Prevalence of Asymptomatic Malaria Infections in Seemingly Healthy Children , the Rural DzangaSangha Region , Central African
- Rutta, A. S. M., Francis, F., Mmbando, B. P., Ishengoma, D. S., Sembuche, S. H., Malecela, E. K., Sadi, J. Y., Kamugisha, M. L., & Lemnge, M. M. (2012). Using community-owned resource persons to provide early diagnosis and treatment and estimate malaria burden at community level in north-eastern In Malaria Journal (Vol. 11). https://doi.org/10.1186/1475-2875-11-152
- David Nderu, Francis Kimani, Evaline Karanja, Kelvin Thiong’o, Maureen Akinyi, Edwin Too, William Chege, Eva Nambati, Laura Wangai, Christian G. Meyer, Thirumalaisamy P. Velavan (2019). Genetic diversity and population structure of Plasmodium falciparum in Kenyan–Ugandan border areas. First published: 28 February 2019. https://doi.org/10.1111/tmi.13223
- Dong, Y., Liu, S., Deng, Y., Xu, Y., Chen, M., Liu, Y., & Xue, J. (2019). Genetic polymorphism of histidine rich protein 2 in Plasmodium falciparum isolates from different infection sources in Yunnan Province, Malaria Journal, 18(1). https://doi.org/10.1186/s12936-019-3084-4
- Bakari, , Jones, S., Subramaniam, G., Mandara, C. I., Chiduo, M. G., Rumisha, S., Chacky, F., Molteni, F., Mandike, R., Mkude, S., Njau, R., Herman, C., Nace, D. P., Mohamed, A., Udhayakumar, V., Kibet, C. K., Nyanjom, S. G., Rogier, E., & Ishengoma, D. S. (2020). Community-based surveys for Plasmodium falciparum pfhrp2 and pfhrp3 gene deletions in selected regions of mainland Tanzania. In medRxiv. https://doi.org/10.1101/2020.05.12.20097766
- Masanja, I., McMorrow, M., Kahigwa, E., Kachur, S. P., & McElroy, P. D. (2010). Health workers’ use of malaria rapid diagnostic tests (RDTS) to guide clinical decision making in rural dispensaries, Tanzania. In American Journal of Tropical Medicine and Hygiene (Vol. 83, Issue 6, pp. 1238–1241). https://doi.org/10.4269/ajtmh.2010.10-0194
- Thiam S. et al. Major reduction in anti-malarial drug consumption in Senegal after nation-wide introduction of malaria rapid diagnostic tests. PLoS One 6: e18419. [PMC free article] [PubMed] [Google Scholar]
- Sifuna, P., Oyugi, M., Ogutu, B., Andagalu, B., Otieno, A., Owira, V., Otsyula, N., Oyieko, J., Cowden, J., Otieno, L., & Otieno, W. (2014). Health and demographic surveillance system profile: The Kombewa health and demographic surveillance system (Kombewa HDSS). International Journal of Epidemiology, 43(4), 1097–1104. https://doi.org/10.1093/ije/dyu139
- Bosco AB, Nankabirwa JI, Yeka A, Nsobya S, Gresty K, Anderson K, et al. (2020) Limitations of rapid diagnostic tests in malaria surveys in areas with varied transmission intensity in Uganda 2017-2019: Implications for selection and use of HRP2 PLoS ONE 15(12): e0244457. https://doi.org/10.1371/journal.pone.0244457.
- Roca-Feltrer, A., Schellenberg, J. R. A., Smith, L., & Carneiro, I. (2009). A simple method for defining malaria Malaria Journal, 8(1). https://doi.org/10.1186/1475-2875-8-276
- Wafula H, and Mulinya: “Impact of Climate Change on spread of Malaria in Vihiga County, Kenya.” IOSR. Journal of Environmental Science, Toxicology and Food Technology (IOSR-JESTFT) 1 (2018): 16-26. www.iosrjournals.org DOI: 10.9790/2402-1201011626> www.iosrjournals.org
- Watson, Oliver John, Verity, , Ghani, A. C., Garske, T., Cunningham, J., Tshefu, A., Mwandagalirwa, M. K., Meshnick, S. R., Parr, J. B., & Slater, H. C. (2019). Impact of seasonal variations in plasmodium falciparum malaria transmission on the surveillance of pfhrp2 gene deletions. In eLife (Vol. 8). https://doi.org/10.7554/eLife.40339
- WHO (2020). Template protocols to support surveillance and research for pfrp2/pfrp3 gene https://www.who.int/malaria/ publications/atoz/hrp2-deletion-protocol/en/
- Klein, Y., Smith, D. L., Laxminarayan, R., & Levin, S. (2012). Superinfection and the evolution of resistance to antimalarial drugs. In Proceedings of the Royal Society B: Biological Sciences (Vol. 279, Issue 1743, pp. 3834–3842). https://doi.org/10.1098/rspb.2012.1064
- Beshir, K. B., Sepúlveda, N., Bharmal, J., Robinson, A., Mwanguzi, J., Busula, A. O., De Boer, J. G., Sutherland, C., Cunningham, J., & Hopkins, H. (2017). Plasmodium falciparum parasites with histidine-rich protein 2 (pfhrp2) and pfhrp3 gene deletions in two endemic regions of In Scientific Reports (Vol. 7, Issue 1). https://doi.org/10.1038/s41598-017-15031-2
- Murray, C. K., Gasser, R. A., Magill, A. J., & Miller, R. S. (2008). Update on rapid diagnostic testing for Clinical Microbiology Reviews, 21(1), 97–110. https://doi.org/10.1128/CMR.00035-07
- KNBS. (2019). 2019 Kenya Population and Housing Census Volume 1: Population by County and Sub-County. In 2019 Kenya Population and Housing Census: Vol. I (Issue November). https://www.knbs.or.ke/?wpdmpro=2019-kenya-population-and- housing-census-volume-i-population-by-county-and-sub-county
- Adam, A. M. (2020). Sample Size Determination in Survey Research. 26 (5), 90–97.
- Leal Filho, , May, J., May, M. et al. Climate change and malaria: some recent trends of malaria incidence rates and average annual temperature in selected sub- Saharan African countries from 2000 to 2018. Malar J 22, 248 (2023). https://doi.org/10.1186/s12936-023-04682-4
- Marita, , Langat, B., Kinyari, T. et al. Implementation of community case management of malaria in malaria endemic counties of western Kenya: are community health volunteers up to the task in diagnosing malaria?. Malar J 21, 73 (2022). https://doi.org/10.1186/s12936-022-04094-w
- Gabriel Gachelin , Paul Garner , Eliana Ferroni Jan Peter Verhave ,Annick Opinel (2018). Evidence and strategies for malaria prevention and control: a historical Malar Journal ; 2018 Feb 27;17(1):96. doi: 10.1186/s12936-018-2244-2
- Cunningham, J., Jones, S., Gatton, M. L., Barnwell, J. W., Cheng, Q., Chiodini, P. L., Glenn, J., Incardona, S., Kosack, C., Luchavez, J., Menard, D., Nhem, S., Oyibo, W., Rees-Channer, R. R., Gonzalez, I., & Bell, D. (2019). A review of the WHO malaria rapid diagnostic test product testing programme (2008-2018): Performance, procurement and In Malaria Journal (Vol. 18, Issue 1). https://doi.org/10.1186/s12936-019-3028-z
- Dalrymple, , Mappin, B. & Gething, P.W. Malaria mapping: understanding the global endemicity of falciparum and vivax malaria. BMC Med 13, 140 (2015). https://doi.org/10.1186/s12916-015-0372-x
- Elnour, Z., Grethe, , Siddig, K. et al. Malaria control and elimination in Kenya: economy-wide benefits and regional disparities. Malar J 22, 117 (2023). https://doi.org/10.1186/s12936-023-04505-6.
- Arantxa Roca-Feltrer, Joanna RM Armstrong Schellenberg, Lucy Smith & Ilona Carneiro (2009). A simple method for defining malaria Malaria Journal volume 8, Article number: 276 (2009)