Comparative Fatty Acid Profiling and Physiochemical Analysis of Persea Americana Mill. Oil Extracted from Two Different Methods.
- Onukwube N. D.
- Amadi, E. G.
- Anarado I. L.
- Ehiemere, A. C.
- 48-61
- Apr 27, 2024
- Chemistry
Comparative Fatty Acid Profiling and Physiochemical Analysis of Persea Americana Mill. Oil Extracted from Two Different Methods.
Onukwube N. D.1*, Amadi, E. G.1, Anarado I. L.1 & Ehiemere, A. C.2
1Department of Pure and Industrial Chemistry, Nnamdi Azikiwe University, PMB 5025, Awka, Anambra State, Nigeria.
2Department of Chemistry, Abia State Polytechnic, Aba. Abia State, Nigeria.
*Corresponding Author
DOI: https://doi.org/10.51584/IJRIAS.2024.90404
Received: 28 February 2024; Revised: 19 March 2024; Accepted: 23 March 2024; Published: 27 April 2024
ABSTRACT
Persea americana (Avocado Pear) is an edible fruit with high content of oil and chlorophyll. Oil extracted from the pulp of Persea americana using two different methods (Soxhlet extraction and Steam Distillation) was assayed for physicochemical properties and also characterized using standard methods. Soxhlet Extraction (SE) proved to be a better method of extraction with a higher percentage of oil yield (33.30%) compared to 17.4% obtained from Steam Distillation (SD) method. All the other physical properties assayed were in good correlation. Chemical analysis revealed that the Steam Distillation (SD) sample has higher values of Iodine, Acid (FFA), Peroxide and Saponification. The obtained lipid was trans esterified by a base catalyst. The methyl esters were analyzed using GC-MS. The lipid profile showed that Capric acid was the most predominant fatty acid in the SE oil sample having the highest value (16.69%), followed by Lauric acid (3.15%), while the least was Linolelaidic acid (0.05%. Whereas, Heptadecanoic acid was the most predominant fatty acid (17.98%) in the SD oil sample, followed by Stearic acid (14.51%), with Linolenic acid (0.06%) as the least. Low percentage of Linoleic acid was equally recorded from both oil samples as 71.40% of the constituents from the SE oil sample could not be detected, while only 36.96% of the constituents from SD were not detected.
Keywords: Fatty Acid; Persea Americana; GC-MS; Physicochemical Properties; Trans esterification
INTRODUCTION
Avocado (Persea americana Mill.) with origin in South America, is a tropical or subtropical fruit, which belongs to the Lauraceae family. A growing interest has been sparked by Avocado oil globally in human nutrition, food industry, and cosmetics. The lipid content of Persea americana which is predominantly monounsaturated fatty acids, is associated with cardiovascular system benefits and anti-inflammatory effects (Temelli, 2009 and Benalia et al., 2015). The content of these oils and their fatty acids compositions are mainly affected by most of these parameters (extraction condition, growing region, variety, climate, etc.). Also, the proportion of saturated, monounsaturated and polyunsaturated fatty acids, as well as the quantity of essential fatty acids like, linoleic and oleic acids (omega-3, omega-6, and omega-9), vary significantly amongst oils (Saini & Keum, 2018; Rodríguez et al., 2016; Amin et al., 2019; and Huerta-Yépez et al., 2016) Several methods of oil extraction have been previously discussed in various literatures. These methods include: – Steam distillation, organic solvent extraction, cold pressing (Rezig et al., 2012), mechanical pressing (Bogaert et al., 2018), aqueous enzymatic extraction assisted by microwave Jiao et al., 2014), supercritical fluid extraction (Durante et al., 2014), and microwave-assisted extraction (Rezig et al., 2012 and Kouba et al., 2016).
Even with the recent development in chemical technology, most of the traditional and advanced extraction methods available for recovery of oils from plant materials are associated with one form of limitation or the other. For example, Cold pressing, a traditional oil extraction method that does not involve the use of solvents is said to suffer from low smoke point and low oil yield. Mechanical pressing that involves screw pressing to extract the oil from the material seed, has low yield due to residual oil in the meal as its major disadvantage. Aqueous enzymatic extraction that relies on the upstream mechanical treatment and enzymes to improve the release of intracellular components and compounds is equally associated with high cost, low yield and unavailability of enzymes as challenges. Supercritical fluid extraction (SFE), a technique that uses fluid such as Carbondioxide (CO2) at or above its critical point to extract compounds from a solid or liquid material also has many parameters needing optimization, high analytical cost and limitation to polar compounds to contend with. Microwave-assisted extraction, a technique that involves heating the solvent together with the sample in a specialized container using microwave energy, has time consuming and thermal degradation of heat labile compounds as major disadvantages. However, Solvent extraction which is based on the principle that the solvent diffuses in the matrix and dissolves the soluble compounds is the most widely used method (Tizia, C. & Liadakis, G., 2003). The efficiency, automation, Purity of result as some of the features of Soxhlet Extraction (SE), as well organic solvent-free products, no need for subsequent separation steps, large capacity for processing at the industrial scale, inexpensive equipment, less fuel for the steam boiler for extraction of oils, easy extraction of essential oils also as features of Steam Distillation (SD) are part of the reasons that informed our decision to subject these two methods to comparative studies.
Moreover, physico chemical parameters, such as the iodine value (degree of unsaturation), peroxide value (formation of primary oxidation products), density (purity), and acid value (formation of free fatty acids as a result of rancidity), affect the shelf-life quality and consequently the economic value of oils and so the determination of these factors is crucial (Endo, 2013). In this study, the pulp oil extracted from Persea americana Mill. using two different methods of extraction was investigated. Furthermore, an effort was made to clearly and understandably present the extraction, analysis, and characterization of pulp oil as well as other physicochemical characteristics and to compare and contrast the results obtained from the two different extraction methods with a view to establishing the better method of extraction in terms of oil yield and some other physiochemical properties. Thus, the objectives of this study include to determine the fatty acid composition and physicochemical properties of Persea americana using two different extraction methods and comparison of the results obtained from the two methods with other results from literature.
Therefore, the present study was accomplished by extracting oil from Persia americana using two different methods (Soxhlet extraction and Steam distillation), investigating the total lipid content and fatty acid methyl ester (FAME) composition of these oils. The determination of fatty acids is always preceded by the preparation of the fatty acid methyl esters (FAME) in order to improve volatility and to reduce peak tailing prior to analysis by Gas Chromatography with good precision and reproducibility.
Trans esterification of lipids can be carried out using both acid and base catalysts, or a combination of both. Base catalysis is known to be a much faster reaction compared with acid catalysis, but is also more selective with regards to the types of lipids that are trans esterified. For example, free fatty acids are notoriously difficult to convert to fatty acid methyl esters with a base catalyst. If an algal biomass sample contains high concentrations of free fatty acids, the overall FAME yield obtained by base-catalyzed in situ trans esterification may underestimate the actual FAME yield of the biomass due to partial saponification and soap formation (Nakazibwe et al., 2020).
MATERIALS AND METHODS
Materials
Sample collection and preparation
Fresh Persea americana fruits (Avocado pea) were obtained from Umungasi Market in Aba North LGA of Abia State, Nigeria. The collected samples were washed and the pulp (mesocarp) was cut into small pieces, dried in an oven at a temperature of 650C for 24 hours. It was thereafter ground into powder using a grinder. The powder was subsequently stored in dried glass bottle until analysis. And for the steam distillation process, the collected sample was washed and the outer layer was cut into two and the soft succulent part (mesocarp) was collected for the oil extraction.
Extraction of Oil
This was done according to Uba and Muhammad (2019). The Soxhlet extraction was utilized to extract the oil from Perea americana. The processed Persea americana pulp (50 g) were appropriately packed into the thimble of the Soxhlet extractor, and petroleum ether (300 mL) was put into the Soxhlet extractor’s 500 mL round bottom flask. The oil from Persea americana pulp was extracted using the Soxhlet extraction system with petroleum ether (boiling point 60-80 °C). The extraction process took 6 hours. The extract was filtered using filter paper before being dried in a rotary evaporator at 40 °C. The recovered oils were stored in a vial at 4 °C until further analyses were carried out. The oil yield from Persea americana pulp was calculated using equation (1)
Oil Content(%) = (W3-W2)/W1 X 100 ….(1)
Where, W3 = weight of extraction cup + oil, W2 = weight of extraction cup, W1 = is weight of original sample.
Physical and Chemical parameters of oil
The state, odour and colour of the oils were noted using visual inspection at room temperature (Oderinde et al., 2009).
Determination of saponification value. A mixture 5 g of oil and 25 mL of 0.5 M ethanolic potassium hydroxide solution were heated under reflux for 60 minute in a conical flask. Thereafter, the saponified mixture was titrated with 0.5 M HCl after the addition of 2.0 mL of 0.05% phenolphthalein. The end point was achieved as the pink colour became colourless (Yusuf et al., 2021). The titration was also performed on the blank solution as the saponification value was calculated using equation (2)
![]()
where, V is the volume of HCl used for titr ation and calculated by subtracting the total volume needed for titration of the blank solution and the sample (V HCl for blank – sample).
M is concentration in molarity of HCl.
Determination of iodine value. This was done using the Shimamoto et al (2016). Method, with slight modifications (reduction in sample weight and volume of distilled water). (0.5 g) aliquot of the oil sample was weighed and transferred to a 250 mL Erlenmeyer flask, and was dissolved in 15 mL 99% ethanol for 5 min with magnetic swirling vigorously. 20 mL of the 0.1 M ethanolic iodine solution after the stirring. After additional 5 minutes of stirring, 100 mL of cold distilled water was thereafter added as the stirring was slowed down.
The flask was kept under cover for 5 min and gently swirled with a magnetic bar, consciously without losing any Iodine. The solution was titrated with a standard 0.1 M sodium thiosulfate solution until a pale yellow colour was observed. After that, 3 mL of a 1% starch solution was added. The titration was continued until the blue color disappeared, leaving a milky solution. A blank was examined in the same way as the sample. The Iodine content was measured in milligrams per 100 grams of oil using equation (3)
Iodine value = (V Na2S2O3 (mL) × M Na2S2O3 × 12.691)/ (Mass of the sample (g) … (3)
where, V Na2S2O3 is a volume needed for titration, M is concentration of Na2S2O3 in molarity and calculated by subtracting the total volume needed for titration the blank solution and the sample (V Na2S2O3 for blank – sample).
Determination of peroxide value. This was achieved by transferring 5 g of the oil sample into a 250 mL conical flask. This was dissolved in 30 mL of chloroform and a (2:3) ratio of glacial acetic acid. The mixture was shaken vigorously for exactly one minute. After that, 30 mL of distilled water was added. The solution was then titrated with sodium thiosulfate 0.1 M until it turned into a pale yellow solution. 1 mL 1% starch solution was added to this solution and titration continued until the blue color disappeared (Magu et al., 2017). The peroxide number was calculated using equation (4).
Peroxide number (meq/kg) = (V Na2S2O3 (mL) × M Na2S2O3 × 1000)/(Mass of the sample, g)…(4)
Determination of acid value. 5 g of oil sample was transferred into a 250 mL conical flask, then 100mL of neutralized ethanol (warmed to 60–65 oC) was added, along with 2 mL of 1% phenolphthalein, and titrated with 0.1 M ethanolic KOH till light pink color was observed (Stevenson et al., 2007).
Equation (5) was used to calculate the sample’s acid value:
Acid value (mg/g)= (VKOH(mL) X MKOH X 56.1)/(Mass of the sample (g)) … (5)
Where, V = volume of KOH, and M (molarity) = concentration of KOH solution.
P/S Indices.
Saturated fatty acids (SFAs) have negative impacts on blood lipoprotein profiles and coronary heart disease (CHD), according to WHO/FAO report. The ratio of polyunsaturated to saturated fatty acids (P/S index values) can be used to calculate the nutritional value of oils and any associated health hazards. Values higher than one P/S index for oils and fats are said to have a positive nutritional impact. Less lipid is deposited in the body when the P/S index is higher. According to (Gedefaw et al.,2021). The P/S index was measured by taking the ratio of total polyunsaturated fatty acid to the total saturated fatty acid.
Determination of density. Density of a substance speaks volume about its purity, concentration of components, and composition. The density (and concentration) of liquid products also greatly impact their quality, behavior, and use. This was measured using the density meter.
Viscosity.
The viscosity of the oil sample was determined using the Ostwald-U-tube visco meter (Bwade & Aliyu 2020). The viscometer was suspended at room-temperature, as the instrument was filled with oil to the mark at the top of the lower reservoir using a pipette as the tube was left above the dry mark. The oil was then moved into the other arm by means of the pressure on the respective arm of the tube, so that the meniscus was 1 cm above the mark at the top of the upper reservoir. The liquid was then allowed to flow freely through the tube, and the time it took for the meniscus to pass from the mark above the upper reservoir to the mark at the bottom of the upper reservoir was recorded. The viscosity of oil was calculated using equation (6)
Viscosity of the oil = (T – T0)/T0 … (6)
Where: T = flow time of the oil, T0: flow time of distilled water.
DETERMINATION OF FATTY ACID USING GAS CHROMATOGRAPHY-MASS SPECTROMETRY (GC-MS)
Preparation of fatty acid methyl esters (FAME).
For fatty acids to be effectively measured by gas chromatography-mass spectrometer (GC-MS) analysis, it has to be converted into its derivative such as fatty acid methyl ester. According to Uba and Muhammad (2019), 1 g of the extracted oil and 2% methanolic KOH (6 mL) were added to a 50 mL round bottom flask. The condenser was connected to the round bottom flask, and the mixture was heated in a water bath for 1 hour at 60-70 °C with constant stirring. The reaction mixture was allowed to cool to room temperature. The solution was transferred to separatory funnel after adding 40 mL of n-hexane to it. The organic layer (upper layer) was separated and filtered through Whatman filter paper (110 mm) after drying over anhydrous sodium sulfate.
The esterified sample was concentrated as the solvent was removed through rotary evaporation to reduce the volume. However the solvent (n-hexane) can be selectively removed from the esterified samples because it is more volatile than the ester (esterified sample). The methyl ester was kept at 4 oC until the GC-MS analysis. For methylation of the standards of free fatty acids, a similar procedure was used, and for GC-MS analysis, a trans esterified sample was produced at a concentration of 10mg/L.
Fatty Acid Profile.
The fatty acid compositions were determined using an Agilent Technology 5977E MSD with an auto-sampler and an Agilent 7820A GC system (USA). The chromatographic separation was performed on a DB-1701 micro-column (30 m length, 0.25 mm internal diameter, 0.25 μm film thickness) at an 8psi pressure and a 1 mL/min flow rate. At constant flow mode. Helium was used as the carrier gas and the total run time was 34.77 minutes. The injection of 1.0 μL of the sample into the inlet was done with an Agilent G4567A auto sampler and heated to 275 °C using a split less injection mode. The oven temperature was set to 100 °C for 2 min, with the beginning column temperature set to 100 °C. The temperature of the column was raised at a rate of 15 °C/min to 220 °C, then increased at a rate of 3 °C/min until it reached 240 °C. The temperatures of the transfer line and the ion source were 280 °C and 230 °C, respectively. The electron energy was set to 70 eV as ions with mass to charge ratio of 40 to 650 were collected. The identification of the fatty acids were done by comparing the retention times of a standard mixture to the retention times of the fatty acids, and by comparing with NIST spectral library.
RESULTS AND DISCUSSION
Oil yield
The oil content of Persia americana from Soxhlet extraction (33.30 %) was almost more than twice that of Persia americana from steam distillation, which was (17.40 %). Though these values are lower than that reported by Mageshni et al.,(2012), the variations in oil yields is an indication that Soxhlet extraction is a better and more efficient means of extraction than Steam distillation in terms of oil yield. Two-factor ANOVA showed a significant difference in yields for the two different extraction methods (P ≤ 0.001) with a significant difference in yields between the two methods (P ≤ 0.05).
However, feasibility studies conducted on SD method have verified it as more ecofriendly and safer than the SE extraction process, as no direct contact with organic solvents are involved (Scalia et al., 1999).
According to studies, compared to the oil content of other seeds, Persea americana oil from SE was higher than Cotton seed oil (22–24%) and soybean oil (18–22%) but lower than sunflower oil (30–35%), rapeseed oil (40–48%), and olive oil (12–50%) even as the Perea americana oil from SD is lower than all the above mentioned sources (Gohari et al., 2011). Kukeera et al. (2015) opined that the oil content of numerous Curcubitacae crops, including the egusi (30%), sesowane (24.8%), wrewre (27.5%), tsama (24.8%), and melon (28%) varies. The Food and Agricultural Organization (FAO) asserted that any seed containing more than 17% oil is considered an oil seed and can be used as a feedstock for biodiesel synthesis (Akinoso & Raji 2010). Therefore, Persea americana can be used in industrial vegetable oil processing.
Fatty acid compositions of Persea americana oil.
The FAMEs chromatogram on a gas chromatograph( Figs 1 & 2) revealed that Persea americana oil is made up of three groups of acids namely Saturated Fatty Acid (SAFA),which is the most predominant, followed by Monounsaturated Fatty Acid (MUFA) and lastly Polyunsaturated Fatty Acid (PUFA) with some unidentified as shown in Table 4 as well Figs 3, 4 and 5. The lipid profile in Table 3 showed that Capric acid was the most predominant fatty acid in the SE oil sample having the highest value (16.69%), followed by Lauric acid (3.15%), while the least was Linolelaidic acid (0.05%. Whereas, Heptadecanoic acid was the most predominant fatty acid (17.98%) in the SD oil sample, followed by Stearic acid (14.51%), with Linolenic acid (0.06%) as the least. However, most of the polyunsaturated fatty acids which are generally referred to as essential fatty acids may be embedded in the unidentified percentage. These acids perform essential functions in the human body, including the development and maintenance of cell membranes and control of gene activity within the cell. Thus eating a diet rich in polyunsaturated fatty acids and low in saturated fatty acids is encouraged as it is helpful to one’s health.
Physicochemical properties of Persea americana oil.
The physicochemical characteristics of the analyzed Persea americana oil were determined and presented in Tables 1 and 2. The acid value is employed as a quality control parameter in the analysis of fat and oil The higher the acid number and free fatty acid content, the lower the quality of the oil, even as the acid number increases further with the age of an oil, because of transformation of triglycerides into glycerol and fatty acids with time.
The acid value is usually a measure of how much potassium hydroxide (mg) is needed to neutralize the free acids in one gram of fat (Shimamoto et al., 2016). The result obtained for acid value was 0.70 and 8.42 mg KOH/g for SE and SDF oil samples respectively (Table 2). Thus thed SE oil sample is said to be of better quality than that from the SD sample.
This number is comparable to the results obtained from other sources of oil as shown in Table 5 (Dubois et al., 2007) An oil sample with a low acid value exudes fewer free acids and minimizes the risk of rancidity (Stevenson, 2007). In comparison to other seed crops, the acid value of Persea americana oil from SE sample in this study is higher than that of soybean (0.420 mg KOH/g), Peanut oil (0.630mg KOH/g), and cotton seed (0.561 mg KOH/g) (Dubois et al., 2007).
The saponification value as a quality control parameter for the characterization of fats and oil carries information on the average molecular weight of all fatty acids that are present in a sample. The higher the saponification number, the lower the molecular weight of all fatty acids, and vice versa (Yusuf et al., 2021). The saponification value is actually a measure in milligrams of potassium hydroxide (KOH) necessary to saponify one gram of fat. The saponification value was found to be 230.010 and 367.500 mg KOH/g for SE and SD samples respectively (Table 5). This study’s saponification value was higher than those reported for various oil samples, (Dubois et al., 2007), which were 210.345, 210.779, and 208.411 mg KOH/g for Soyabean, Peanut and cotton seed oils respectively (Table 5). The saponification values of Persea amaricana oil is also higher than those of Pumpkin seed oils (175, 184-187, 189, and 199 mg KOH/g) reported by Jiao et al., 2014; Kouba et al., 2016 and Bwade & Aliyu (2020) respectively. The saponification value in this study was higher than that for Moringa seed oil (171.9 mg KOH/g) and cashew seed oil (161 mg KOH/g) (Saeed & Shola, 2015).
Iodine Value
The iodine number as a quality control parameter is used for the quantification of the amount of unsaturated fatty acids present in fats and oils. The higher the degree of unsaturation, the more the number of iodine needed to react with the double bonds, resulting in a higher iodine value. Thus, Iodine value is a measure of the degree of unsaturation of oils and fats (Yusuf et al., 2021). It is simply defined as the amount of iodine that can be added to 100 g of oil (Kukeera et al., 2015).
The iodine content of the Persea americana oil was found to be 25.81 and 33.84 g I2/100 g for SE and SD oil samples respectively (Table 5). The iodine value of the Persea americana oil in the present study was lower than those of other oil samples (136.740, 97.536, 101.112 g I2/100 g) for Soyabean, Peanut and Cotton seed oils respectively (Dubois et al., 2007). It was also found to be lower than that of pumpkin seed oil (Jiao et al., 2014 and Yusuf et al., 2021), which was 183 and 153 g I2/100 g, respectively.
The higher the amount of iodine in the oil, the higher the degree of unsaturation therein. The stability of the oil is compromised at an elevated iodine level as it is more likely to oxidize (Uba & Muhammad, 2019).
Peroxide Value
The peroxide number talks about the amount of peroxide compounds present in the oil and so gives information about the quality and age of the edible oil. The lower the peroxidenumber, the better and/or fresher the oil.
The extent of rancidity of oils during storage is a function of the peroxide value and therefore the peroxide value can serve as an indicator for the determination of the stability of fats and oils. ( Magu et al., 2017) . The degree to which a fat has been oxidized is represented by milliequivalent (meq) of oxygen per 1000 g of fat, which is the peroxide value (Samuel et al., 2017 and Xu et al., 2015).
Persea americana oil had peroxide value of 2.100 and 12.860 meq O2/kg (Table 5) for both the SE and SD oil samples respectively. The peroxide value of the SE oil sample is comparable to those of other different oil samples (1.299, 2.398 and 3.396 meq O2/kg) for soyabean, Peanut and Cottonseed oils respectively. While the peroxide value of the SD oil sample is much higher than the values of the other oil samples listed above.
The SE oil sample peroxide value is equally comparable to those of pumpkin seed oil peroxide values of 2.3, 2.5, and 2.5 meq O2/kg published by Kukeera et al. (2015), Rezig et al. (2012), and Bwade & Aliyu (2020), respectively.
Viscosity
The viscosity was found to be 0.14 cps for both oil samples. In this work, the viscosity of Persea americana oil was found to be lower than those previously reported by ( Ikhuoria & Maliki, 2007) and ( Ogbuagu & Okoye, 2020) .
P/S Index
A P/S index for edible oils of greater than one had been recommended by the World Health Organization (Tesfamicael, &, Ele, 2016). Higher P/S index value are associated with edible oils that have more poly unsaturated compounds compared to unsaturated ones (Gedefaw et al., 2021). The higher value of the P/S index has direct relation to the extent of oil solubility in the blood stream. Saturated fatty acids (SFAs) have the ability to tightly stick to cell membranes in sharp contrast to poly unsaturated fatty acids (PUFAs). Those SFAs with carbon number between 12 and 16 have the propensity to increase low-density lipoprotein (LDL) cholesterol (Gedefaw et al., 2021). The P/S index in this work was found to be 0.0047 and 0.0262 for both the SE and SD oil samples respectively. This is however below the acceptable range that was recommended by the WHO. The low P/S index could be attributed to the high percentage of unidentified acids in both oil samples as various factors such as climate conditions, variety, stage of maturity and sun exposure can affect the FA composition in avocados. (Uba & Muhammad, 2019).
Table 1: Physical Characterization of Persia americana oils from Soxhlet Extraction (SE) and Steam Distillation (SD) methods.
| Parameters | Soxhlet Extraction (SE) | Steam Distillation (SD) |
| Yield (%) | 33.30 | 17.40 |
| Density g/cm3 | 1.21 | 0.90 |
| Melting Point (0C) | 1.20 | 1.10 |
| Viscosity (Pa.s) | 0.14 | 0.14 |
| Moisture (%) | 0.90 | 2.00 |
| pH | 6.70 | 6.00 |
| Colour | Emerald Green | Emerald Green |
| P/S Index | 0.0047 | 0.0262 |
Table 2: Chemical Characterization of Persia americana oils from Soxhlet Extraction (SE) and Steam Distillation (SD) methods.
| Properties | Soxhlet Extraction (SE) | Steam Distillation (SD) |
| Acid Value(mg/g) | 0.70 | 8.42 |
| Iodine Value (g I2/100 g) | 25.81 | 33.84 |
| Peroxide Value(meq/kg) | 2.10 | 12.86 |
| Saponification Value (mg KOH/g) | 230.01 | 367.50 |
Table 3. FAs analysis, with their chromatographic and mass spectrometry parameters.
| SE OIL SAMPLE | SD OIL SAMPLE | ||||||
| Ret. Time
(Mins) |
Normal % | Group | Name (FAME) | Ret. Time (Mins) | Normal % | Group | Name (FAME) |
| 4.17 | 71.403 | Nil | Nil | 4.17 | 36.96 | Nil | Nil |
| 12.02 | 0.279 | 1 | Caprylic Acid | 11.98 | 0.452 | 1 | Caprylic Acid |
| 13.72 | 16.692 | 1 | Capric Acid | 13.79 | 2.596 | 1 | Capric Acid |
| 15.59 | 0.132 | 1 | Undecanoic Acid | 15.55 | 0.406 | 1 | Undecanoic Acid |
| 17.54 | 3.152 | 1 | Lauric Acid | 17.30 | 0.268 | 1 | Lauric Acid |
| 18.61 | 0.418 | 1 | Tridecanoic Acid | 18.58 | 0.811 | 1 | Tridecanoic Acid |
| 18.92 | 0.326 | 1 | Myristic Acid | 18.88 | 0.974 | 1 | Myristic Acid |
| 19.89 | 0.080 | 2 | Myristoleic Acid | 20.02 | 1.205 | 2 | Myristoleic Acid |
| 20.21 | 0.651 | 1 | Pentadecanoic Acid | 20.19 | 2.130 | 1 | Pentadecanoic Acid |
| 21.48 | 0.117 | 1 | Palmitic Acid | 21.35 | 0.619 | 1 | Palmitic Acid |
| 21.65 | 0.060 | 2 | Palmitoleic Acid | 21.67 | 1.787 | 2 | Palmitoleic Acid |
| 22.63 | 1.991 | 1 | Heptadecanoic acid | 22.75 | 17.984 | 1 | Heptadecanoic acid |
| 23.14 | 1.732 | 1 | Stearic Acid | 22.94 | 14.514 | 1 | Stearic Acid |
| 24.09 | 0.054 | 2 | Elaidic Acid | 24.09 | 2.925 | 2 | Elaidic Acid |
| 24.28 | 0.051 | 2 | Linolelaidic Acid | 24.27 | 3.894 | 2 | Linolelaidic Acid |
| 24.41 | 0.836 | 2 | Oleic Acid | 24.36 | 0.711 | 2 | Oleic Acid |
| 27.29 | 0.127 | 3 | Linoleic Acid | 27.79 | 1.281 | 3 | Linoleic Acid |
| 28.66 | 1.899 | 1 | Arachidic Acid | 28.57 | 3.322 | 1 | Arachidic Acid |
| 31.58 | 0.064 | 3 | Linolenic Acid | ||||
| 34.05 | 5.311 | 1 | Heneicosanoic Acid | ||||
| 34.77 | 1.783 | 1 | Behenic Acid | ||||
Groups (1= SAFA, 2= MUFA, 3= PUFA)
Table 4: Percentage composition of various groups of Fatty acids
| SAFA | MUFA | PUFA | ND | |
| SE (%) | 27.39 | 1.08 | 0.13 | 71.40 |
| SD (%) | 51.17 | 10.52 | 1.34 | 36.96 |
Table 5: Comparison of Physicochemical properties of various oil fractions
| SE | SD | Soybean | Peanut | Cottonseed | |
| Moisture Content (%) | 0.9 | 2.0 | 0.210 | 0.219 | 0.220 |
| Peroxide Value(meq/kg) | 2.100 | 12.860 | 1.299 | 2.398 | 3.396 |
| Iodine Value (g I2/100 g) | 25.810 | 33.840 | 136.740 | 97.536 | 101.112 |
| Saponification value (mg KOH/g) | 230.010 | 367.500 | 210.345 | 210.779 | 208.411 |
| Acid value(mg/g) | 0.7000 | 8.420 | 0.420 | 0.630 | 0.561 |
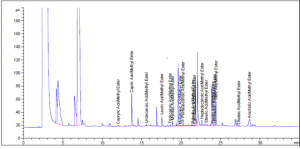
Fig.1: GC–MS total ion chromatogram of Fatty acid composition of Persia americana oil from Soxklet extraction (SE).
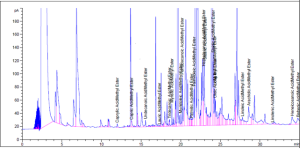
Fig.2: GC–MS total ion chromatogram of Fatty acid composition of Persia americana oil from Steam distillation (SD)
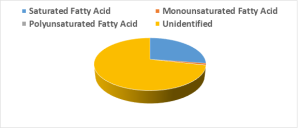
Fig. 3: Fatty Acid Group in SE Oil Sample
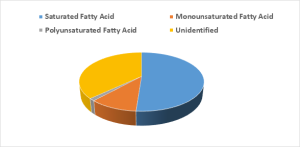
Fig. 4: Fatty Acid Groups for SD oil Sample
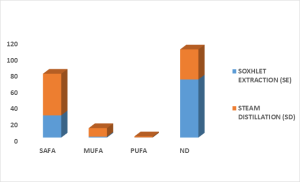
Fig 5: Percentage content of SAFA, MUFA, PUFA and Non Detected
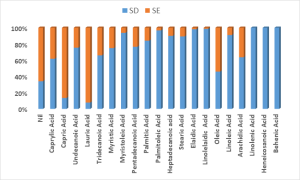
Fig. 6: FA profile of Oil samples extracted from both Soxhlet and Steam Methods
CONCLUSION
The composition and quality of oils including Persea americana depends on the origin, weather conditions,variety, and extraction methods, The present study characterized Persea americana oil as a mainly saturated oil, with a minute proportion of polyunsaturated fatty acids, with large proportion of the oil samples unidentified, which may include other bioactive compounds, present in the unsaponifiable fraction, such as tocopherols and polyphenols.
The larger proportion of saturated fatty acids compared to unsaturated fatty acids may render the oil insignificant in human diet.
The SD oil sample is more adapted to produce oils for pharmaceutical industries, since the method is free from solvent and yields an undiluted product.
Fatty acids composition of Persea americana oil equally revealed that the oil samples could be good for industrial ingredients in soap production and cosmetics.
REFERENCES
- Akinoso, R. & Raji, A.O. (2010). Optimization of oil extraction from locust beans using response surface methodology.J. Lipid Sci. Technol. 113, 245–252.
- Amin, Z.M., Islam, T., Mostofa, F., Uddin, J.M., Rahman, M.M. & Satter, A.M. (2019). Comparative assessment of the physicochemical and biochemical properties of native and hybrid varieties of pumpkin seed and seed oil (Cucurbita maxima ). Heliyon .5, 1–6.
- Benalia, M., Djeridane, A., Gourine, N., Nia, S., Ajandouz, E. & Yousfia, M. (2015). Fatty acid profile, tocopherols content and antioxidant activity of Algerian pumpkin seeds oil (Cucurbita pepo ).Mediter. J. Nutr. Metab. 8, 9–25.
- Bogaert, L., Mathieu, H., Mhemdi, H. & Vorobiev, E. (2018). Characterization of oilseeds mechanical expression in an instrumented pilot screw press. Crops Prod. 121, 106–113.
- Bwade, K.E. & Aliyu, B. (2020). Physicochemical properties of pumpkin seed oil relevant to bio-diesel production and other industrial applications. J. Eng. Bus. Enterp. Appl. 4, 72–78.
- Dubois, V., Breton, S., Linder, M., Fanni, J. & Parmentier, M. (2007). Fatty acid profiles of 80 vegetable oils with regard to their nutritional potential. J. Lipid Sci. Technol. 109, 710–732.
- Durante, M., Lenucci, M.S., D’Amico, L., Piro, G. & Mita, G. (2014). Effect of drying and co-matrix addition on the yield and quality of supercritical CO2 extracted pumpkin (Cucurbita moschata )oil.Food Chem. 148, 314–320.
- Endo, Y. (2013). Analytical methods to evaluate the quality of edible fats and oils: The JOCS standard methods for analysis of fats, oils and related materials and advanced methods. J. Oleo Sci. 67, 1–10.
- Gedefaw, Z., Menon, M., Ele, E. & Genet, S. (2021). Assessment of fatty acid content in various brands of imported oils in Ethiopia by gas chromatography. J. Biochem. Mol. Biol. 6, 18–25.
- Gohari, A.A., Farhoosh, R. & Haddad, K.M.H. (2011). Chemical composition and physicochemical properties of pumpkin seeds (Cucurbita pepo ) grown in Iran. J. Agric. Sci. Technol. 13, 1053–1063.
- Huerta-Yépez, S., Tirado-Rodriguez, A.B. & Hankinson, O. (2016). Papel de las dietas ricas en omega-3 y omega-6 en el desarrollo del cáncer. Med. Hosp. Infant. Mex. 73, 446–456.
- Ikhuoria, E. U. & Maliki,. M. (2007). Characterization of avocado pear (Persea americana) and African pear (Dacryodes edulis) extracts. African Journal of Biotechnology. 6(7),950 – 952.
- Jiao, J., Li, Z.G., Gai, Q.Y., Li, X.J., Wei, F.Y., Fu, Y.J. & Ma, W. (2014). Microwave assisted aqueous enzymatic extraction of oil from pumpkin seeds and evaluation of its physicochemical properties, fatty acid compositions and antioxidant activities. Food Chem. 147, 17–24.
- Kouba, M., Mhemdi, H., Barba, F.J., Roohinejad, S., Greiner, R. & Vorobiev, E. (2016). Oil seed treatment by ultrasounds and microwaves to improve oil yield and quality. Food Res. Int. 85, 59–66.
- Kukeera, T., Banadda, N., Tumutegyereize, P., Kiggundu, N., & Asuman, R. (2015). Extraction, quantification and characterization of oil from pumpkin seeds. J. Agric. Biol. Eng. 8, 98–102.
- Mageshni, R., Roshila, M. & Sreekanth, B. (2012). Fatty acid profile and elemental content of avocado (Persea americana) oil –effect of extraction Methods. Journal of Environmental Science and Health, Part B (2012) 47, 529–537.
- Magu, O.T., Sunday, A.E., Louis, H., Upla, U.P., Ukpanah, A.M. & Nyong, E.B. (2017). Physico-chemical properties and fatty acid composition of Lagneraria siceraria seed oil. Wnofns .10, 70–79.
- Nakazibwe, I., Olet, A.E. & Rugunda, K.G. (2020). Nutritional physico-chemical compositionof pumpkin pulp for value addition: Case of selected cultivars grown in Uganda. Afr. J. Food Sci.14,233–243.
- Oderinde, R.A., Ajayi, I.A. & Adewuyi, A. (2009). Characterization of seed and seeds oil of Hura Crepitans and the kinetics of degradation of the oil during heating. Electron. J. Environ Agric. Food Chem., 8(3): 201-208.
- Ogbuagu, A. S. & Okoye, C.I. (2020). Physico-Chemical Characterization of Avocado (Persea americana Mill) Oil. Progress in Chemical and Biochemical Research. 3 (1), 39 – 45.
- Rezig, L., Chouaibi, M., Msaada, K. & Hamdi, S. (2012). Chemical composition and profile characterization of pumpkin seed oil. Ind. Crops Prod. 37, 82–87.
- Rodríguez, J., Martín, M.J., Ruiz, M.A. & Clares, B. (2016). Current encapsulation strategies for bioactive oils: From alimentary to pharmaceutical perspectives. Food Res. Int. 83, 41–59.
- Saeed, M.D. & Shola, E.A. (2015). Extraction and physicochemical properties of some edible seed oils sampled in kano metropolis, kano state. J. Pure App. Sci. 8, 239–244.
- Saini, R.K. & Keum, Y.S. (2018). Omega-3 and omega-6 polyunsaturated fatty acids: Dietary sources, metabolism, and significance. Life. Sci. 203, 255–267.
- Samuel, B.C., Barine, D.K. & JoY, E.E. (2017). Physicochemical properties and fatty acid profile of shea butter and fluted pumpkin seed oil, a suitable blend in bakery fat production. Int. J. Nut. Food Sci., 6,122–128.
- Scalia, S., Giuffreda, L. & Pallado, P. (1999). Analytical and preparative supercritical fluid extraction of Chamomile flowers and its comparison with conventional methods. J. Pharmaceut. Biomed. 21,549–558.
- Shimamoto, G.G., Aricetti, A.J. & Tubino, M. (2016). A simple, fast, and green titrimetric method for the determination of the iodine value of vegetable oils without wijs solution (ICl). Food Anal. Methods. 9, 016-040.
- Stevenson, D.G., Eller, F.J., Wang, L., Jane, J.L., Wang, T. & Inglett, G.E. (2007). Oil and tocopherol content and composition of pumpkin seed oil in 12 cultivars. J. Agric. Food Chem. 55, 4005–4013.
- Temelli, F. (2009). Perspectives on supercritical fluid processing of fats and oils. J. Supercrit. Fluids 47, 583–590.
- Tesfamicael, F &, Ele, E. (2016). Assessment of fatty acids composition in commercially available and widely consumed edible oils in Ethiopia: their relevance and health implications. Sinet: Ethiop. J.Sci.,39,21–33.
- Tzia, C. & Liadakis, G. (2003). Extraction optimization in food engineering, CRC Press, 456
- Uba, B. & Muhammad, C. (2019). Determination of fatty acid composition and physicochemical properties of Cucurbita maxima (pumpkin) seed oil cultivated in Northeast Nigeria. East Afr. Sch. Mult. Bull. 2, 231–234.
- Yusuf, J., Kantoma, D. & Mosunmola, O.R. (2021). Studies on Cucurbita maxima seed oil for its potentials as feedstock for biodiesel production in Nigeria. Nigerian Res. J. Chem. Sci. 9, 215–233.
- Xu, T.T., Li, J., Fan, W.Y., Zheng, W.T. & (2015). Deng, W.Z. Comparison of oxidative stability among edible oils under continuous frying conditions. Int. J. Food Prop., 18, 1478–1490.