Comparison of Some Selected Models of Daily Water Supply in Abuja, Federa Capital Territory (FCT) Of Nigeria.
- Gerald Onwuka
- Babayemi A. Wasiu
- Felix Akor Eneojo
- 92-126
- May 4, 2024
- Water Pollution
Comparison of Some Selected Models of Daily Water Supply in Abuja, Federa Capital Territory (FCT) Of Nigeria.
Gerald Onwuka1, Babayemi A. Wasiu1, Felix Akor Eneojo2
1Department of Mathematics, Kebbi State University of Science and Technology, Aliero
2Department of Statistics, Kogi State Polytechnic, Lokoja
DOI: https://doi.org/10.51584/IJRIAS.2024.90408
Received: 08 March 2024; Revised: 25 March 2024; Accepted: 30 March 2024; Published: 04 May 2024
ABSTRACT
Water is considered as an essential commodity in human society. It has been observed that the basic standard of living of any Country can be measure through the effective portable water supply for consumption, sanitation and hygiene for the citizen. Its production and supply in the Federal Capital Territory (FCT), Abuja, Nigeria is a challenge, as dominant percentages of lower- class workforce live outside the FCTWB existing water network, and depend on borehole or tanker for water. The demand on the water supply system in FCT, Abuja has exceeded its initial design population, and the system is incomplete and operating with only 720 million liter of water per day (MLD) functioning plant. On this basis, this study seeks to identify the best model that fit daily water supply data in FCT, Abuja and to forecast the future daily water supply in this area. The comparing models were artificial neural, multiple linear and non-linear regression model were applied to the data set of daily water production, daily water treated, daily water supply, daily water leakage, Number of household connected to Federal Capital Territory Water board water network, Number of Commercial area connected to Federal Capital Territory Water board water network, and the Estimated population of Federal Capital Territory ,Abuja from (2013 to 2020), and it was emerged that the most adequate model for the data was Multiple linear regression model (MLR), with (R2 =1.000), (RMSE = 0.00282), and (MAE = 6.540). Artificial neural network records the high value of (RMSE = 432.4321), (MAE = 549.444) and (R2 =0.921), and multiple nonlinear regression record the highest value of (RMSE = 806.687), (MAE = 666.421) and (R2 = 0.999). From the statistical measure of goodness of fit, the three models compared results indicate that MLR model forecast are closely matching with actual observations values, artificial neural network model over-forecast some days volume of daily water supply by FCTWB, cooperation and multiple nonlinear regression model under-forecast some days volume of daily water supply by FCTWB, corporation. The three models compared depicts the influential variables of FCTWB Corporation daily water supply, (ANN = DWP, DWT), (MLR = DWT, DWL) and (MNLR = DWP, DWL), and their forecast graphs shows downward daily water supply in FCT, Abuja. It is recommended that the FCT, Abuja water Board Corporation should consider multiple linear regression (MLR) model and its forecasted values as a road map in its operations and planning toward water supply sustainability in FCT, Abuja.
Key words: FCT, Abuja, Daily Water Supply, Urban, Artificial Neural network, Multiple Linear Non-Linear Regression Model.
INTRODUCTION
Water is a natural resource that has the greatest positive impact on the human population in the world (Bridget R. et al., 2007). Water is very essential to humanity and animal for their existence. The survival of any living things would have been difficult without water. However, its availability reduced diseases, poverty and improved life at all ages (Prüss-Üstün A. et al., 2008). Potable water is a treat to developing Countries; therefore, the need to plan how to mitigate its effect in our societies is very necessary.
Adequate water supply for consumption, sanitation and hygiene is one of the most important factors to considered when evaluating the sustainable development of a given nation or city. Availability of portable water for consumption, sanitation and hygiene is one of the criteria that measure the standard of living, economic growth and development of a nation. For nation to have effective daily water supply in both urban and rural area depend greatly on the Government at all level to provide adequate safe and affordable water for both domestic and public consumption.
Ensuring adequate and reliable water supply has become a major challenge for most of the water corporations in developing countries. Depleting of source, ageing and inadequate supply infrastructure, distribution losses and inadequate financial resources to maintain or upgrade infrastructure has made it difficult to find a solution to the problem. It has become difficult to ensure the quality of service in terms of adequacy and efficiency, with the result that most cities in developing Countries do not have access to 24 hours per day water supplies.
The prevailing water stress in many developing countries is not only due to source limitation but other factors such as poor distribution through city networks and inequalities in service provision between the rich and the poor (UN-HABITAT, 1999). One of the main reasons is the high rate of water losses from the distribution systems. Many studies revealed that water losses in cities of developing countries are at levels between 40-60% of water supplied (Saul Arlosoroff, 1998).
Insufficient water supply leads to insanitation and unhealthy living, of people in a society. Thus, water is a vital resource for life sustainability. Access to adequate clean and safe water is greatly contributes to improve health and productivity (Rahmato, 1999). Access to clean water and sanitation was declared as a human right by United Nation UN (2010 and 2013). In most developing countries, these rights are denied, where people, especially those that live in a rural area do not have access to safe drinking water and sanitation and those in urban area were having intermittent daily water supply.
WHO and UNICEF (2017), joint monitoring programs on water supply, sanitation and hygiene estimates that 2.1 million people do not have safety managed water, 844 million do not have access to basic drinking water service. This include 263 million people who have to spend over 30 minutes per trip to collect water from sources outside their home, and 159 million are still drinking untreated water from surface water sources, such as stream, lake, river, pond, dug
well etc. The United Nation UN (2010), General Assembly of human right to water and sanitation, recognized the right of every human being to have access to sufficient water for personal and domestic use (between 50 to 100 liters of water per person per day), which must be safe, acceptable and affordable. Insufficient water supply and inadequate sanitation and consumption are leading causes of child mortality, estimated 1.5 million children died of diarrhea yearly, mostly among children under five years living in developing nations (WHO/UNICEF, 2017).
Supplying safe water for basic consumption is of crucial importance for the preservation of human health, especially among children. According to Prüss-Üstün A. et al (2008), the total burden of disease worldwide—around 10%—could be prevented by improvements related to drinking-water, sanitation, hygiene and water resource management. Making an effort to have access to adequate water for domestic consumption and sanitation is a moral and imperative established in the cultural, religions and traditions of communities around the world.
Providing adequate safe water for consumption to combat poor health is an integral part of the strategy to alleviate poverty in many countries (UNDAF, 2006). However, unless many countries in the world, especially the developing countries should take water infrastructure efficiency a priority, the united nation (UN) sustainable development Goal 6.1 of achieve universal equitable access to safe and affordable drinking water for all by 2030 cannot be achieved (WHO and UNICEF, 2017).
From the literature it is show that the treat of increasing water demand is greatly outweighs the water available for supply and consumption in urban areas in most developing nations. The developing nations are still struggling to have effective water supply management system in their most urban areas. To have sustainable water supply, sanitation and hygiene service delivering in urban areas, require building of strong institutions in term of physical and human resources (FMWR, in–house policy review committee, 2016). This is why water supply management come as an appropriate strategy aiming to have effective and sustainable urban water consumption in term of economy and environment (wegelin Schuringa 2000), and which depend on good knowledge of temporal changes of historical and future water consumption (karamouz., et al., 2003).
A large number of factors are known to be causes of water supply and consumptions, which include population, employment, technology, weather, climate, price, socio – economic, culture /religion, and infrastructure efficiency. Ineffective of water supply management system in human society are cause as a result of lack of founding and maintenance culture by the government, corruption, outdated technology etc. However, many of these variables are difficult to quantify and have high degree of uncertainty (Billing et al., 2008).
Water deficient in urban area is harmful, as most of the domestic activities are indoor, for examples, defecation, cooking, washing of utensils, bathing, cloth washing etc., which will not be done properly in water deficient, leading to insanitation, unhygienic, House pollution and diseases.
The economic values of water infrastructure investment as a nation is very essential, as it contribute greatly to our healthy and economic growth. Therefore, it is imperative for water Corporation management board to always take note of operational deficiencies in their system to achieve effective water supply to the highly demand consumers.
1.1 Aim and objectives.
The aim of this study is to compare, Artificial neural network, Multiple linear and nonlinear regression models on daily water supply in FCT, Abuja and to forecast the future daily supply water by FCTWB corporation. The objectives of the study include:
- to compare artificial neural network, multiple linear, and nonlinear regression models on daily water supply data in FCT, Abuja.
- to investigate the most significant variables on urban daily water supply.
- to identify the best fit model to daily water supply data in FCT, Abuja.
In Abuja, the FCT, the adequate water supply is a limiting factor in domestic, commercial and economic development. Supply of demanded quantity and quality of water to all consumers with effective and reliable water supply system operation in urbanized city is a global treat, especially in developing countries. The work of COHRE (2008) cited by Ita Enang et al (2016), described that in federal capital territory (FCT), Abuja Nigeria, dominant percentage of lower-class workforce live outside the FCTWB existing water network, and depend on borehole or tanker for water.
The FCT water supply system was designed for population of 3.2 million people (IPA 1997), and its water treatment plant when completed will produce 1440 million liters of water per day (MLD) (FCTWB, 2000). The demand on the water supply system has exceeded its initial design population, and the system is incomplete and operating with only 720 million liter of water per day (MLD) function plant (Ali, 2012). As the populations grow in an urbanized city, water supply diminishes. Therefore, how to manage the existing water equitably with the highly demand tends to be increasingly urgent. For these challenges to be surmounted, this study aims to: (i) compares Artificial neural network, Multiple linear and nonlinear regression models on daily water supply data in FCT, Abuja, (ii) to investigate the most significant variables on urban daily water supply and (iii) to determining the best fit model to FCTWB corporation daily water supply.
LITERATURE OF REVIEW
2.1 Evolution of FCT Water Supply System
Federal capital territory (FCT), Abuja public water supply service started when Jabi Dam and its water treatment plant was constructed in 1981. The dam has reservoir with capacity of 6 million cubic meters. The output of the treatment plant was 340 M3/hr. Jabi Dam supplied water to federal capital city up to a point in 1986 when Usman Dam and its treatment plant works came into operation. These facilities were all managed by the water sewage division of engineering department of federal capital development authority (FCDA). In October 1989; the federal capital territory water board was created especially for; Control, manage, install and maintain all water works and service vested or to be vested on the board by the ministry of FCT, Abuja.
Due to rapid population growth and industrial development, the exiting Dams in the FCT could not met water demand of the resident. In April 26, 2007, former president Olusegun Obasanjo commissioned Gurara inter basin water transfer project which carries water from Gurara Dam in Kaduna State through 75km pipeline to lower Usman Dam in Abuja the federal capital territory (FCT) to augment water supply to customers in FCT, Abuja ( Jancy Vijayan and Bart Schultz, 2007). FCT, Abuja uses three (3) Dam (Jabi, Usman, and Gurara Dams) for drinkable water supply. These facilities now provide a combined 720 million liters of clean water per day to capital city, Abuja and its neighboring areas.
2.2 Institutional Capacity of FCT, Abuja Water Supply
For a nation to have a sustainable water supply management system, it will involve cooperation and understanding between the concerned stakeholders. In FCT, Abuja, the federal capital territory water board (FCTWB) holds the responsibility of supply portable water to FCT resident, while Federal Capital Development Authority (FCDA) is responsible for the provision of infrastructure and handover to FCTWB for management (Chambers, C. and Ekkanem, N., 2007).
Figure 1. Lower Usuman water treatment plant in Bwari Area of FCT, Abuja.
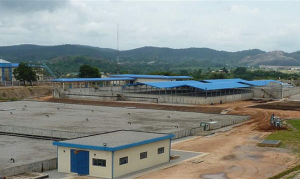
Source: (Biwater, 2013).
FCT water supply was designed for an eventual population of 3.2 million people (IPA, 1997). It is water treatment plant was initially to be completed by 2004 and when complete, produce 1440 million liters of water per day (MILD) (FCTWB, 2000). The demand on the water supply system has exceeded its initial design population, but the system is still incomplete and operating with only 720 MLD function plant (Ali, 2012).
2.3 Artificial Neural Network in Water Supply System
Adam et al (2018), proposed ANN and MLR methods for forecasting daily water consumption in Torun, Poland, using meteorological variables and dummy variables as independent variables. The result indicated that ANN was superior over the MLR, although the observed difference in performance was very minimal. Among the variables used, it was only humidity that has a theoretical impact on water consumption.
Gwaivangmin and Jiya (2017), in their study of water demand prediction, selected number of similarity factors influencing water consumption as input variables to artificial neural network model; such factors are the type of day (e.g. normal public holiday, strike, major sports on other special event, etc.), day of the week, month, maximum and minimum temperatures, and the number of days after rainfall, population growth, and income of consumers to mention but a few. They conclude that forecasting water demand is very important as it served as a measure to forestall future water scarcity presently affecting the urban water demand.
Bilmes (1985), submitted that considering the increasing demand for the optimization of distribution networks in terms of leakage reduction and pressure management, as well as the need to reduce urban water consumption, a lot of effort has been invested in the past decade in order to define accurate, long-term and short-term water demand forecasting methods. According to Gwaivangmin and Jiya (2017), other forecasting methods are useful, but neural network is preferred because of its several advantages especially in the water supply industries where certain factors are not quantifiable and subject to error. Maier et al., (2000), conducted a study reviewing 43 research papers that employed neural networks in the prediction and forecasting of water resources variables. They observed that neural network models always work well and their use in the study of water is on the increase due to their ability to handle large amounts of non-linear and non-parametric data.
D.P Vijaylaksmi and K.S Jinesshbabu (2015), developed adaptive neuron-fuzzy inference system to model Hogenakkal water supply and Fuorosis mitigation project, Oharmapuri and Krishnaggini District, Tamil Nadu, India, using record of current water demand and previous water demand as input variables. The results uncovered that the performance of ANFIS models shows significance improvement with increase in input parameter. The study also manifested that neuron-fuzzy approach is a viable tool for modeling water supply demand.
Abuja, the federal Capital Territory, Nigeria is one of the fastest growing cities in the continent of Africa and one of the fastest growing cities in the world (UNUP,2015). With this rapid population growth and industrial advancement in the FCT, Abuja, the Federal capital territory water Board (FCTWB) is facing water demand challenges, as claim by COHRE (2008) and cite by R. Ita Enang et al., (2016), that the dominant percentage of the lower class workforce in the federal Capital Territory Abuja (FCT) live outside the coverage of the existing water network and rely on borehole, dug well and tanker for water, in the cause of this research, we investigated the claim of COHRE (2007) and R. Ita Enang et al., (2016), it is still valid.
Insufficient urban water supply, especially in the developing countries are caused by population growth, industrial development, lack of funding and water infrastructure investment, corruption, lack of maintenance culture, non-revenue water supply and illegal water network connections. For these challenges above to be surmounted in any water supply management system, the concern stakeholder should be proactive in planning and implementing water infrastructure investment and develop sound financial management and promote maintenance culture. Water network should be expanding along with city expansion, population growth and industrial development. Another option for improve urban water supply reliability recommended by this study is that, FCT, water board management should constitute inspection team that always update the appropriate authority concern in any issues that affecting the system and such issues should be given urgent attention. Improving water supply system is part of poverty alleviation; improve living standard and economic growth of a nation.
2.4 Multiple Linear Regressions in Urban Water Supply Management
The most widely used methods in water demand and water consumption literature is multiple linear regression techniques which have been used for both short-term and long-term water demand forecasting. Jefferson Wong et al., (2010), proposed a series of statistical models, including multiple linear regression to identify the structure of the daily urban water consumption series of Hong Kong; and to differentiate the effects of five factors on water use, i.e., trend, seasonality, climatic regression, calendar effect and auto regression. The study indicated that the major factors influencing the urban water use of Hong Kong is the seasonality, followed by the calendar effects. Haque et al., (2013), developed multiple linear regression (MLR) and multiple non-linear regression (MNLR) models for the prediction of monthly water demand for single residential sector in the Blue Mountains Water Supply System, Australia. The results indicated that MLR performed better than MNLR in forecasting monthly water demand. Lahlou and Colyer (2000), forecasted water demand for residential, commercial and industrial sectors in Casablanca, Morocco by developing water demand forecast models using multiple regression techniques.
Babel et al (2007), developed a multivariate regression model to forecast long-term domestic water demanding Kathmandu, Nepal.The results indicate that the number of connections, water pricing, public education level, and average annual rainfall are significant variables of domestic water use/demand. The paper further analyzes the effect of length of data series on accuracy of model results.
According to Jan Franiklion Adamoniski (2009), peak daily water demand forecast is required for the cost-effective and sustainable management and expansion of urban water supply infrastructure. In his study, he developed ANN, MLR and Time series analysis, by using 10 years of peak daily water demand data and meteorological variables.The relative performance of the compared models indicate that ANN approach perform better prediction of peak daily water demand than MLR and Time series.
Balling R. C et al., (2007), investigated the influence of climatic variables on annual water use in the city of phoenix, Arizona by regression analysis. Polebitski and Palmen (2009), developed regression models to forecast single family residential water demand at a bi-monthly time step in Seattle, Washington. Shandras and Hossen Parandvash (2010), employed multiple regression analysis to measure the effects of land use on regional water demand. In literature, many approaches have been proposed to model urban water demand forecasting, urban water consumption, water quality etc. for the betterment of water resources management sector and the society at larger. However, no literatures are available addressing daily urban water supply using multiple linear regression analysis techniques.
2.5 Multiple Non-linear Regressions in Urban Water Supply Management
In respect to multiple linear regression analysis for urban water management system, there has been rather limited research on multiple non-linear regression modeling. Amed Abdulkadir et al., (2012), propose multiple non-linear regression model to determines the most suitable independent variable for forecasting the water demand in Adana City of Turkey, using water consumption as dependent variable while average monthly bill, total subscribership, atmospheric temperature, relative humidity, rainfall, global solar radiation, sunshine duration, wind speed and atmospheric pressure were selected as independent variables to model water demand forecasting. The result indicates the significant independent variables are total subscribers and atmospheric temperature for forecasting monthly water demand in Adana City of Turkey. Sumayah et al., (2018) developed ANN and Non-linear regression model to forecast the relationship between the water quality index of Euphrates River, using climate variables (temperature, relative humidity, and rainfall depth and sunshine duration). The result showed that non-linear regression models forecast the relationship between water quality index and the recorded climate variables than ANN models.
They main goal of water Supply management system is to supply adequate portable water to customers. In order to achieve this goal, studying the daily urban water supply management is essential as it can help to assessing the progress or the deficiency of water supply management operations system, short-term strategies and relevant implementation plan. Water resources management sector have been actively researched for many decades; however, there is a limited research in urban daily water supply management; the development of a reliable urban water supply management model is still a challenge as some of its variables are difficult to measure.
MATERIALS AND METHODS
3.1 The Study Area
Abuja, the Federal Capital City (FCC) of Nigeria located in the center of the country within the federal capital territory (FCT) was created 1976, replaced the city of Lagos as capital city of Nigeria on 12 October 1991. It has a land area of 8,000-kilometer squares. According to 2006 census, it has a population of 1,406,239 made of 733,172 and 673,067 males and females respectively. According to United Nation (UN) Babagana Abubakar (2020), the population of Abuja grew by 139.7% between 2000 and 2010, making it the fastest growing city in the world. As of 2015 united nation population urbanization prospect UNPUP (2015), most areas of the city are still experiencing an annual growth of at least 35% retaining its position as the fastest growing city on the continent of African and one of the fastest growing cities in the world.
Figure 2.MAP of FCT, Abuja Nigeria
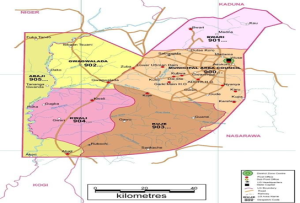
Source: Google Map.
The FCT water supply system was designed for population of 3.2 million people (IPA 1997), and its water treatment plant when completed will produce 1440 million liters of water per day (MLD) (FCTWB, 2000). The work of COHRE (2008) cited by Ita Enang et al., (2016), described that in federal capital territory (FCT), Abuja Nigeria, dominant percentage of lower-class workforce live outside the FCTWB existing water network, and depend on borehole or tanker for water. The demand on the water supply system has exceeded its initial design population, and the system is incomplete and operating with only 720 million liter of water per day (MLD) function plant (Ali, 2012).
3.2 Data Collection
The data used for this study were secondary data. The data include Daily water supply, Daily water production, Daily water treated, Daily water leakage, Number of households connected to FCTWB water network on monthly bases, Commercial area connected to FCTWB water network on monthly base covers 2013 – 2020 obtained from the Federal Capital Territory (FCT), Abuja Water Board Corporation while the yearly estimated population of FCT, Abuja for 2013 – 2020 were obtained from Nigeria National Population Commission (NNPC).
METHODS
3.3.1 Artificial neural network (ANN)
Artificial neural networks (ANN) are branches of the field of Artificial intelligence (AI) which may also consist of fuzzy logic (FL) and Genetic Algorithms (GA). It is an information processing system which is inspired by models of biological neuron (S.N Sivanandam et al., 2008). It is based on the basic model of the human brain with the capacity of Generalization and Learning. By definition, Artificial Neural Network are biologically machine programs designed to model the function of human brain system of interconnected processing of Artificial Neuron. A human brain consists of neurons that process and transmit information between them. There are dendrites that receive inputs, and these inputs produce an output through an axon to another neuron (Anirudh et al., 2018). ANN can be described as a network of simple processing nodes or neurons, inter-connected to each other in a specific order, performing simple numerical manipulations. ANN has gained a lot of interest over the few years as a powerful tool to solve many real-world problems. A Neural Network (NN) is a powerful tool that is able to capture and represent complex input/output relationships. The true power and advantage of neural networks lies in their ability to represent both linear and non-linear relationships and ability to learn these relationships directly from the data being modeled. The purpose of the neural network (NN) is to create a model that correctly maps the input to the output using historical data so that the model can then be used to produce the output when the desired output is unknown.
ANN can be used to predict future values of possibly noisy multivariate time series based on past historical data. It has become popular in the last decade for hydrological forecasting, ground water and precipitation forecasting and water quality users (Kisi, 2004, Shaoo, 2005, Adamowski, 2007). Neural network characteristics can be defined by its three components: architecture, learning algorithm and activation function (Ali et al, 2000).
3.3.2 ANN Architecture
ANN Architecture consist of layers of inter-connected neurons, “as show in figure 3.1
A ‘neuron’ in neural network (NN) is sometime called a node or unit; all these terms mean the same thing and can be used interchangeably. One class of ANN Architecture is the feed forward network. It consists of layer of input units, and one more layer of hidden units, and one or more output layer of units. A neural network that has no hidden unit is called perceptron. However, a perceptron can only represent linear functions, it is not power enough to solve a complex problem. On other hand, a multilayer feed forward neural network can represent a very broad set of non-linear function. This structure is called multilayer because it has a layer of processing units (i, e. the hidden units) in addition to the output units. According to Hornik et al, (1989), Multilayer neural networks are capable of modeling highly non-linear relationship and can be trained to accurately generalize, when presented with new unseen data. In feed forward neural network the output from one layer of neurons feed forward into the next layer of neurons. There are never any backward connections, and connections never skip a layer. This mean that unit at one layer are connected with all units at next layer. So, this mean that all the inputs unit are connected to all the units in the layer of hidden units, and the units in the hidden layer are connected to all the output units.
According to Mukesh Khare et al, (2006), determining the number of input neurons and output neurons depend on the problem specific. However, determining the number of hidden neurons is based on training algorithm. The interconnections between ‘neurons’ are controlled by the training algorithm and the nature of the problem. If number of neurons in the hidden layer is too small, the network may not be powerful enough to bring out the desired requirements. On other hand, large number of hidden units can cause very long training and recalling time (Lynne E. Parker, 2010). In this study we employed feed forward network (ANN) Algorithm.
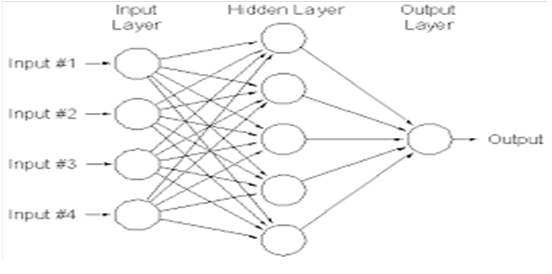
Figure 3. ANN feed forward architecture with one hidden layer
3.3.3 Neural Network Learning process
The primary significance of a neural network is its ability to Learn from its environment. Leaning is a process by which the free parameters of a neural network are adapted through a continuous process of stimulation by the environment. The type of learning is determined by the manner in which the parameter changes take place.
3.3.4 Feed forward Neural Network (FFN)
The most widely used ANN structure is the multi-layer and the feed forward networks (FFN). It has an input layer, hidden layer(s) and an output layer. Information passes one way from input to output. Each neuron is connected to all the neurons of the next layer. The neuron in one layer is only connected to the immediate next layer. The input layer received information and processed and passed on to the hidden layer where it is further processed and passed on to the output layer. The statistical form of the three-layer feed forward ANN is given as (Ozbek and Fidan,2009).
Ok = g2[∑Vj Wkj g1 (Wji Xi + Wj0) + wk0] (3.1)
Where:
Xi = the input value to node i of input layer,
Vj = is the hidden value to node j of the hidden layer and,
O = is the output at node k of the output layer.
Wji = controls the strength of the connection between input node i and hidden node j
Wkj = control the strength of the connection between the hidden node j and the output node k
g1 and g2 = represent the activation function for the hidden layer and the output layer respectively. The activation function is typically a continuous and bounded non-linear transfer function for which the sigmoid and hyperbolic tangent function is usually selected (Ozbek and Fidan, 2009). The sigmoid activation function is among the most used and output of network will be between 0 and 1. The neuron sigmoid activation function can be expressed as:
Sigmoid(y) = 1/1+exp(-x) (3.2)
At the hidden node, we apply the sigmoid function to the weighted sum of the input to the hidden node, so we get the output of the hidden node Zh is:
Zh = Sigmoid ![]() (3.3)
(3.3)
for h going from I to H, where H is the total number of hidden nodes.
Now, we can do the similar computation for the output nodes. The difference is in the method used to compute our output depends on whether we have one output unit or multiple output units.
3.3.5 Multiple Linear Regression Model (MLR)
Regression analysis is the process of estimating value of dependent variable on the basis of explanatory variable/s (Kinney et al, 2002). Regression analysis has evolved into many different forms, including linear and nonlinear regression and parametric and non-parametric regression.
Multiple linear regression (MLR) is an extension of simple linear regression for modeling and investigating the relationship between a response or dependent variable of interest Y and a set of predictors or explanatory variables are x1,x2 , —— xp, The assumption of the model is that, the relationship between dependent variable Y and the P vectors of regression xi is linear. Then the regression equation of Y can be represented as:
Y= β0 +β1x1 + β2x2+———– + βpxp + ẹ (3.4)
Where:
Y = dependent variable (output
Xi = independent variables (inputs)
P = number of observations
βi = regression coefficients or regression parameter.
and
e = an error team to account for the difference between the predicted data
The predicted value form of equation (3.4) is;
![]() (3.5)
(3.5)
Where Y ̂ = predicted value of the variable Y when the independent variables are represented by the values x1,x2 ——-,xp .
3.3.6 Estimation
Once the appropriate functional form is decided, the parameters of the daily water supply model must be estimated. A description of the estimation methods for the model parameters is provided in this section.
3.3.7 Ordinary least squares estimate of the multiple regression model
Let us consider the linear model in eq. (1)
yt = β0 + β1x 1+ β2x2+———-+βKxk + εi (3.6)
where the notations are defined in section (3.1). Equation (3.1) can be
re-written in the matrix form: y = xβ+ε
The OLS estimates of the parameters ![]() in (3.1) are values which minimize the Residual sum of (RSS):
in (3.1) are values which minimize the Residual sum of (RSS):
RSS = ![]() (3.7)
(3.7)
The total sum of square is defined as: SStot = ![]() With RSS and SStot defined above, the following relationship holds: SStot = SSreg + RSS, where SSreg is the regression sum of squares: SSreg =
With RSS and SStot defined above, the following relationship holds: SStot = SSreg + RSS, where SSreg is the regression sum of squares: SSreg = ![]() the coefficient estimate can be obtained by minimizing the quantity above as:
the coefficient estimate can be obtained by minimizing the quantity above as:
β ̂ = (x’x)-1xTy (3.8)
Assuming that cov(ε) = δ21, the covariance matrix of is Cov(β ̂)=δ2(xTx)-1, estimated as: ![]()
and Fα (1, T- K -1)-statistic for the hypothesis βk = 0 is calculated as:
F = ( β ̂k/(SE(β ̂k))2 (3.9)
Where the standard error SE( β ̂k) for any k=1, ———-, k is the square root of the corresponding diagonal element of ![]() .
.
3.3.8 Multiple Nonlinear Regressions
In statistics, the multiple nonlinear regression (MNLR) analysis is a form of regression analysis in which the relationship between the dependent variable Yi and the independent variables are assumed to be nonlinear. Nonlinear regression can model observational data by function which is a nonlinear combination of the model parameters and depends on one or more independents variables. In this study multiple nonlinear regression model was used to analyze daily water supply data using the functions, linear, power, cubic, quadratic, logarithmic, and exponential to identify the best relationship. The following represents the multiple nonlinear regression equation ( Ivakhnunko, 1970).
![]() (3.10)
(3.10)
Where α is the intercept and β0, β1 ———βk, are the coefficient of the independent variables and k is the number of observations.
3.3.9 Non-linear Least Squares
To model the dynamic structure with several explanatory variables, the Levenberg-Marquardt algorithm (LMA) was used. As described by (Henri P. Gavin, 2016), the LMA interpolates between the Gauss-Newton algorithm (GNA) and the method of gradient descent. In the current setting, following the notations defined in the previous sections, the problem is defined in the following way: given a number T of observations of independent and dependent variables,(xi,yi),where is a vector of length K, containing the K variable measurements corresponding to the observation of the dependent variable yi the objective is to optimize K parameters β = (β0, β1 ———βk)T of the model curve f(x,β) such that the sum of the squares of the deviations
![]() (3.11)
(3.11)
is minimized.
The three-model used in this study make use of the same variables of DWS as dependent variable and DWP, DWT, DWL, NHC, NCA, EP as independent variables.
Table 1. Variable description
| Variable Name | Type | Description |
| Daily water supply (DWS). | Dependent variable | Variable to be forecasted |
| Daily water production (DWP). | Explanatory variable | Untreated water from Reservoir |
| Daily water treated (DWT). | Explanatory variable | Water treated by water treated plant before supply to consumers. |
| Daily water leakage (DWL). | Explanatory variable | Water lost through the link pipes during the process of supply to consumers, |
| Number household connected to FCTWB (NHC). | Explanatory variable | Residential houses in FCT connected to FCT water cooperative on monthly basis |
| Commercial area connected to FCTWB (NCA). | Explanatory variable | Government or private establishments in FCT connected to FCT water cooperation. |
| Population of FCT, from 2013 to 2020 (EP). | Explanatory variable | The resident of FCT, Abuja estimated population from 2013 to 2020 |
3.4 model performance evaluation criteria
The performance of Statistical model can be assessed using several statistical measures that described the errors associated with the model. After each of the model structure are calibrated, using the calibration and test data set, the performance of the model can be evaluated using these statistical measures of goodness of fit. The formulas of statistical measure of goodness of fit are as follow:
3.4.1 Coefficient of determination ( )
The coefficient of determination (R2) measures the degree of correlation among the observed and predicted values.
![]() (3.12)
(3.12)
Where,
x = actual value
y = estimated value
Value of r lies between -1 and +1.
3.4.2 Root Mean Square Error
Root mean Square (RMSE) indicates the discrepancy between the observed and forecasted values. A perfect fit between observed and forecasted values would have a RMSE of 0.
RMSE = ![]() (3.13)
(3.13)
Where;
y ̂i= estimated value of
yi= actual value
n = number of observations
3.4.3 Mean Absolute Error
The mean absolute error (MAE) is the measure of the average magnitude of the error in a set of predictions. The lower the value of MAE the better the model predicts the observed data.
MAE = ![]() (3.14)
(3.14)
Where,
y ̂i= predicted value of
yi = the actual value,
n = number of observations.
RESULTS AND DISCUSSION
4.1 Artificial Neural Network model
The data were divided into training and testing data set. January 2013 to December 2018 was used as training data set while January 2019 to December 2020 was used as testing data set. ANN architecture of (6: 5:1) was design using R software version 4.1.3 to developed ANN model on daily water supply data (Figure 4.1). This model consists of six variables as input, one hidden layer with five nodes or neurons and one output layer. The performance evaluation statistic tests i.e., RMSE and MAE were applied to estimate and check the applicability of the trained ANN model on daily water supply data. This procedure is applied to trained ANN model on daily supply until it gives the best prediction performance on the ‘test data set’. After several experimentation, the best RMSE and MAE values are found for the model parameters 0.001 and µ = 0.4 with 700 epochs.
The main objective of ANN Model is to optimize the architecture of the ANN that relate the relationship between the input and output variables. Figure 4.1 shows the feed forward ANN model on daily water supply, with six neurons in the input layer, five neurons in the single hidden layer and one neuron in the output layer.
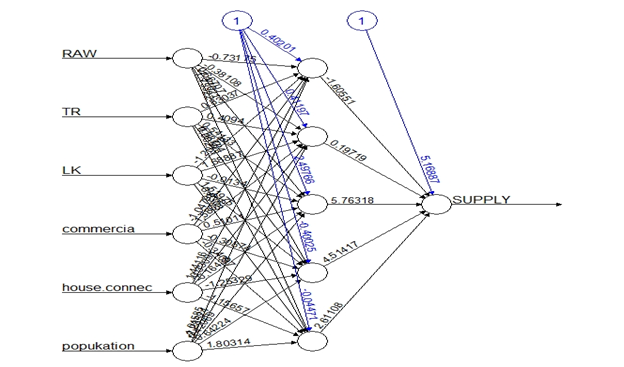
Figure 3. Feed forward ANN Architecture on daily water supply data set.
The table 2. shows the weight values of ANN model on daily water supply data with number of neurons in the hidden layers. The significant weights among the six input variables are DWP and DWT.As a result of several experiments, a fully connected feed forward neural network with six neurons in the input layer, five neurons in the single hidden layer and one neuron in the output layer, shows satisfactory prediction pattern in ‘test data set.
Table 2. Weights values and number of nodes to Hidden Layer of ANN model on daily water supply data.
| Number nodes in the hidden layer | W0 (Constant) | Weight (DWP) | Weight (DWT) | Weight
(DWL) |
Weight (NDH) | Weight
(NCP) |
Weight
(EP) |
| 1 | 0.4020 | -0.7317 | 0.8304 | -1.2081 | 1.4412 | -1.0479 | -1.0158 |
| 2 | 0.4119 | -0.3811 | 0.4094 | 1.6889 | 0.3309 | 1.5866 | -2.2852 |
| 3 | 2.4977 | 0.6671 | 0.5413 | -0.0134 | -0.1644 | 0.5101 | 0.4207 |
| 4 | -0.4002 | -1.3702 | 0.9878 | 1.5197 | -1.2532 | -0.3087 | 0.6422 |
| 5 | -0.0447 | -1.7332 | 0.0021 | -0.6303 | -1.1565 | -0.3409 | 1.8031 |
The performance evaluation statistic test on ANN model to daily water supply data with five neurons in the hidden layer had a test coefficient of determination ( = 0.921), (RMSE = 432.4321), and (MAE = 549.444). The high values of RMSE and MAE indicate that the ANN model over forecast the daily water supply by FCTWB, Abuja. Figure 4 shows the Comparison of forecasted versus observed daily water supply using ANN model on daily water supply data. And table 2 depicts the forecast volume of daily water supply in cubic with 99% CI lower and upper limit on yearly basis.
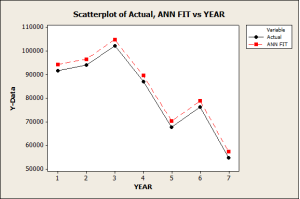
Figure 4. Comparison of forecasted versus observed daily water supply using ANN models.
Table 2. Eight years forecasted daily water supply volume by ANN model on yearly basis.
| Year | Forecast value | 99%CI | |
| Lower limit | Upper limit | ||
| 1 | 9425425.5 | 8130177.4 | 10996525.5 |
| 2 | 9653271.3 | 8342973.2 | 11614971.4 |
| 3 | 9048372.5 | 7989053.6 | 10697787.3 |
| 4 | 8956952.7 | 6351990.3 | 9531824.7 |
| 5 | 7025715.3 | 5356967.5 | 9301101.6 |
| 6 | 7887017.4 | 5939513.0 | 8397562.3 |
| 7 | 5726305.2 | 4736784.8 | 6927464.5 |
| 8 | 5641280.1 | 3966507.8 | 6844618.6 |
4.2 Multiple linear regression models on daily water supply data.
The MLR model on daily water supply data were analyzed, tested base on different series of independent variables (input) and dependent variable (output). The estimated values are given as;
DWS= -4.797 -6.052(DWP) + 1.000(DWT) -1.000(DWL) -3.672(NH) + 1.888(NC) + 3.638(Ep)
Table 4. Estimated MLR model on daily water supplies data.
| Estimate | Standard error | t-value | p-value | |
| Intercept | -4.797 | 2.708 | -1.772 | 0.327 |
| DWP | -6.052 | 5.991 | -1.010 | 0.497 |
| DWT | 1.000 | 8.456 | 1.183 | 0.000538 |
| DWL | -1.000 | 4.198 | -2.382 | 0.000267 |
| NH | -3.672 | 3.173 | -1.157 | 0.454 |
| NC | 1.888 | 1.132 | 1.668 | 0.344 |
| EP | 3.638 | 2.047 | 1.77 | 0.326 |
The data were first trained using the data in the training set (January 2013 to December 2018) (70%), and then tested using the testing data set (January 2019 to December 2020) (30%). The table 4 shows the estimated values of MLR model on daily water supply data.
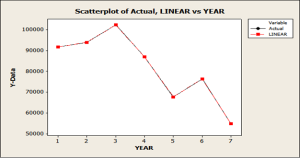
Figure 5. Comparison of fore casted versus observed daily water supply using MLR models.
The result indicate that all the predictor variables considered in this study were not significantly contributed to the volume of daily water supply in the study area during the period under considerations with exception of DWT and DWL that are significant at both 1% and 5% level of significance.
Table 5. Forecasted daily water supply volume by MLR model on yearly basis.
| Year | Forecast | 99%CI | |
| Lower limit | Upper limit | ||
| 1 | 9368666.8 | 8816806.6 | 10931686.6 |
| 2 | 9956451.5 | 8373964.5 | 10346964.5 |
| 3 | 10,226,958 | 9027269.5 | 12542269.5 |
| 4 | 8709019.3 | 6981001.9 | 9976501.9 |
| 5 | 6768956.7 | 5366943.5 | 7764589.5 |
| 6 | 7639702.5 | 6635802.5 | 8638402.5 |
| 7 | 5749695.4 | 4461095.4 | 6460395.4 |
| 8 | 4875612.5 | 3674302.5 | 5954312.5 |
The performance evaluation statistics test on MLR model had a test coefficient of determination ( = 1.000), (RMSE = 0.00282), and (MAE = 6.540). The lower RMSE and MAE values in MLR model indicate perfect forecast of daily water supply by FCTWB, Abuja. Figure 5 shows the Comparison of forecasted versus observed daily water supply data. And table 5 depicts the forecast volume of daily water supply in cubic with 99% CI lower and upper limit on yearly basis.
4.3 Multiple Nonlinear regression (MNLR) models on daily water supply data
The estimated value of MNLR model applied to six independent variables and one dependent variable data on daily water supply in FCT, Abuja, is as follow:
DWS = 1.933 + 6.843(DWP3) + 1.114 (DWT2) -4.234(DWL) + 1.433(NH3) -2.153(NC2) -2.029 (EP).
Table 6 Estimated values of MNLR model on daily water supply data.
| Estimate | Standard error | t-value | p-value | |
| Intercept | 1.933 | 9.407 | 2.055 | 0.288 |
| DWP | 6.843 | 1.343 | 0.510 | 0.020 |
| DWT | 1.114 | 3.179 | 0.350 | 0.315 |
| DWLs | -4.234 | 2.689 | -1.575 | 0.030 |
| NCP | 1.433 | 8.778 | 1.632 | 0.350 |
| NDH | -2.153 | 1.364 | -1.578 | 0.360 |
| EP | -2.029 | 1.187 | -1.708 | 0.337 |
The model was trained using training data set of data from January 2013 to December 2018 (70%) and testing data from January 2019 to December 2020 (30%). Table 6 shows the statistics result of MNLR model on daily water supply data. The result indicate that all the predictor variables considered in this study only DWP and DWL are significantly contributed to the volume of daily water supply in the study area during the period under considerations at both 1% and 5% level of significance.
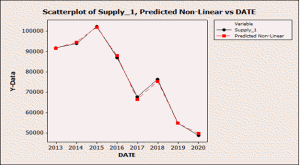
Figure 6. Comparison of forecasted versus observed daily water supply using MNLR model.
Table 7. Forecasted daily water supply volume in FCT, Abuja by MNLR model on yearly basis.
| Year | Forecast value | 99%CI | |
| Lower limit | Upper limit | ||
| 1 | 91265615.9 | 8092638.6 | 11095932.9 |
| 2 | 9574602.2 | 7956766.6 | 10542437.9 |
| 3 | 10891973.7 | 9543227.4 | 12760719.5 |
| 4 | 8765989.8 | 6965856.7 | 9765422.8 |
| 5 | 6706478.7 | 5761906.5 | 7571050.9 |
| 6 | 7585424.5 | 6849732.5 | 8065697.5 |
| 7 | 5754695.9 | 3965704.7 | 6833687.9 |
| 8 | 4967875.9 | 3783944.7 | 5943559.4 |
The performance evaluation statistic test on MNLR model had a test coefficient of determination ( = 0.999), (RMSE = 806.687), and (MAE = 666.421). The higher RMSE and MAE values in MNLR model indicate that the MNLR model has under-forecast some days of daily water supply by FCTWB, Abuja. Figure 6 shows the Comparison of forecasted versus observed daily water supply using MNLR model on daily water supply data. And table 7 depicts the forecast volume of yearly water supply in cubic with 99% CI lower and upper limit on yearly basis. Initially the forecast supposed to be daily volume of water supply, but we convert it to yearly volume of water supply due to voluminous number of days considered in the forecast model.
4.4 Comparative performance of ANN, MLR and MNLR models
The three models were compared to evaluate the relative performance of each model techniques considered in this study. The statistical measures of goodness of fit were calculated from each model employed and their results are presented in Table 7. Each of the models have two variables that are significant both at 0.01 and 0.05 level. The variables from each model are; ANN is DWP and DWT, MLR is DWT and DWL and MNLR is DWP and DWL. These variables are the influencing factors on the FCTWB Corporation, Abuja daily water supply.
Table 3, 5, and 7 shows the forecasted volume of water supply by FCTWB Corporation, Abuja on yearly basis for the forecasting period considered in this study using ANN, MLR and MNLR models. The forecasted of daily water supply values was converted to yearly water supply values due to the voluminous number of days considered in this study
Figure 4 to 6 compare the observed daily water supply in FCT, Abuja with the forecasted daily water supply during the test period using AAN, MLR, and MNLR models, respectively. It can be seen that AAN model over-forecast some days volume of water supplied by FCTWB, Abuja within the period considered in this study, MLR provide the closest estimates to the corresponding observed daily water supply during most of the day’s volume of water supplied periods while MNLR model under-forecast some days volume of water supplied periods.
Table 8. Performance Evaluation Statistics
| Model | R2 | RMSE | MAE |
| MLR | 1.000 | 0.00282 | 6.540 |
| MNLR | 0.999 | 806.6879 | 666.4221 |
| ANN | 0.921 | 432.4321 | 549.444 |
The results obtained from the best model for each model used for forecast daily water supply in FCT, Abuja are presented in Table 8, and the variables for the best model of each forecasting method are presented in Table 9. All the models were developed in the same way. It is quite clear that based on the performance statistical measures of goodness of fit, the MLR model outperformed the ANN and MNLR models, recording the lowest RMSE and MAE statistics, while recording the highest R2 values. From figure 4 it is also indicated that ANN model outperformed MNLR model.
Table 9. Influential factors variables
| Model | Variables |
| ANN | DWP, DWT |
| MLR | DWT, DWL |
| MNLR | DWP, DWL |
There is an existing visible trend in the daily water supply simulated forecasted values. All the models compared forecasted values showing downward trend. That is based on the forecasted results of this study the FCT, Abuja resident will experience shortage of daily water supply volume for the period of years considered in the study as the forecasted values fell in the neighborhood of 9368666.6 cubic in the first year 2021 and 4875612.5 in the year 2028. Figure 8 presented the simulated graph of actual daily water supplied and the estimated population of FCT, Abuja from 2013 to 2020.The water supply by FCTWB cooperation on daily basis showing downward trend while the yearly estimated population of FCT, Abuja from 2013 to 2020 is showing upward trend which support the actual and forecasted value pattern of each of the model compared on daily water supply by FCTWB Corporation, Abuja.
Looking at the variables that are significant to the three models compared in this study, they are very sensitive to urban daily water supply management system. The DWT, which means daily water treated depend on the quantity of DWP, which mean daily raw water production and the treated water have to be distributed to the users, in that process if there are leak pipes, it will reduce the amount of daily water that would have been supplied to consumers, which mean daily water leakage (DWL).
Figure 7: Water scarcity events in FCT, Abuja.
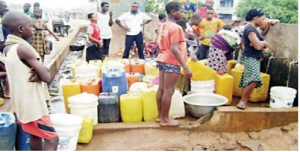
Source: (Premium Time by Nnanna Ibeh, 2013).
Possible reasons the FCTWB, Corporation, Abuja daily water supply volume is showing downward trend could be due to some factors such as reservoir capacity, the functioning of treatment plants and the negligence of the management toward pipe leakage and other system maintenance. The quantity of daily raw water produced is greatly depending on the capacity of the reservoir, i.e., how much volumes of water the reservoir can hold. And the quantity volumes of water treated depend on the quantity of raw water produced if the treatment plants are functioning well.
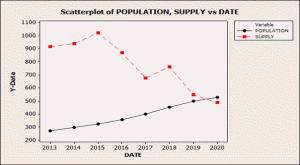
Figure 8: Actual observed daily water supply versus FCT, Abuja estimated population from 2013 to 2020.
The study of how every system of FCTWB, corporation Abuja functions is not our major target in this study. Our target is to measures the volumes of daily water supplied to the resident of FCT, Abuja by the existing water corporation system and to forecast the future volume of daily water supply to the resident of FCT, Abuja by the same existing water corporation system and recommend base on our finding.
CONCLUSIONS
The motivation for this study was also to investigate some issues that have not been investigated in the literature concerning urban daily water supply. From the results of this study, the following conclusions were made;(1) the use of MLR in forecasting daily water supply in an urban area of high outdoor and indoor water used is greatly better than ANN and MNLR models;(2) urban daily water supply is very much correlated with daily raw water produced (DWP), daily water treated (DWT), and daily water leakage (DWL); (3) adding number of domestic household connected to FCTWB water network (NH) and number of commercial area connected to FCTWB water network (NC) and 2013 to 2020 yearly estimated population (EP) does not contribute much to the models accuracy.
With reference to the main aims of this study and the finding, it can be also concluded that: (i) it was determined that the use of DWP, DWT, and DWL as independent variables to multiple linear regression (MLR) models help provide very accurate forecasts of urban daily water supply. (ii) The result of this study indicates that the multiple linear regression (MLR) is the most adequate model for the observed data and best in modeling urban daily water supply compared to other models. (iii) Considering water as scarce commodity require effective planning and management which require good forecasts of the future water supply. Base on the eight years forecasts, our models have depicted downward trend of daily water supply in FCT, Abuja by FCTWB Corporation. Due to its present daily water supply, there is need to forecast future daily water supply volume in order to forestall reoccurrence of water scarcity with Government plan for intervention in urban water supply management. For ensuring adequate daily water supplies in urban cities; reservoirs must retain as much water as possible, treatment plant must be functioning, pipe leakage should be controlled, and water network connection should be consistent along with city expansion. It has been observed that the basic standard of living of any country can be determine through the effective portable water supply for consumption, sanitation and hygiene for the citizen. We use figure 7 and 8 of this study to drawn attention of the Federal Minister of FCT, Abuja and the FCTWB Corporation to take a proactive measure in addressing water scarcity in FCT, Abuja.
RECOMMENDATIONS
Base on the research finding, the following recommendations were made to achieve urban daily water supply.
- The Federal Capital Territory Water Board (FCTWB) Corporation should make use of multiple linear regressions model in determining the daily water supply levels to the domestic household and commercial area of FCT, Abuja.
- The forecasted daily water supply levels using the above model could be greatly help the federal capital territory water board corporation in its management and operational activities.
- Forecast is very important in every system, as well as in urban daily water management as it gives insight to the behavior of the information modeled for effective management and planning.
- If there will be available data, a new MLR model should be developed in order to study the influence of other factors on urban daily water supply sustainability, such as DAM strength, reservoir capacity, and daily water flow rate.
- For effective water supply coverage in federal capital territory (FCT), Abuja, there should be need for enforceable water legislation, building of institutions and policies related to urban water supply planning, development, management, and imbibe maintenance culture.
- The federal capital Territory water Board (FCTWB) Corporation should put in effective and efficient water production and supply strategies in Abuja since its population is steadily increase.
REFERENCES
- Adams R. (1981), Heartland of Cities: Survey of Ancient Settlements and Land use on the Central Floodplain of the Euphrates. University of Chicago Press, Chicago, USA.
- Adam Piasecki, Jakub Jurasz, & Bartosz Kazmierezak (2018), periodical polytechnical civil. Engineering, 63(3), pp. 818 – 824, 2018, https://doi. Org/1003311/ppoi 11930.
- Adamoulski, J. (2007), Development of a Short-term River Floor Forecasting method based on wavelet analysis, J. Hydrology. 353 (3-4), 247-266, doi: 10.1016/J. J Hydron. 2003.02.2013.
- Al-Massri, R. Y., Al-Astel, Y., Ziadia, H., Mousa, D. K., & Abu-Naser, S. S. (2018). Classification Prediction of SBRCTs Cancers Using Artificial Neural Network. International Journal of Academic Engineering Research (IJAER), 2(11), 1-7.
- Ali K. A (2012), Development of water supply infrastructure in Nigeria: challenge and prospects. In being 2012 Nigeria society of Engineers October lecture. Abuja Nigeria society Engineers.
- Ali Idri and Alain Abran (2000), COCOMO Cost model using fuzzy Logic, Research Lab.in software Engineering Management.
- Amed Abdulkadir, Stefan Kloppel, Clifford R. Jack Jr., Nickolaos Koutsouleris, Janaina Mourao – Miranda, Prashanth Vemuri (2012), Neurolmage, Volume 61, issue June 2012, page 457-463.
- Anirudah Sharma, Micheal D. Divito, Darriel E., Share Andrew D., Block Katies Pollock P. (2018), Journal of magnetism and magnetic materials 459,176-181, 2018.
- Babagana Abubakar (2020). Origin and meaning of Abuja the capital City of Nigeria.https://www.researchgate.net/publication/345166243.
- Babel M. Gupta A.D, and Padma, P. (2007), Multivariate econometric approach for domesticwater demand modeling; An application to Kathmandu, Nepal resource research. 48 (1),Wo1528.
- Balling R. C. Jr. Gober P., and Jones, N. (2008), Sensitivity of residential water consumption to variations in climate. An intra urban analysis of phoenix, Arizona. Water Resource research, vol. 44, W. 10401.
- B. I, Gwaivangmin and J. D. Jiya, Water demand prediction using Artificial Neural Network for supervision control. Nigeria Journal of Technology (NIJOTECH) Vol. 36, No. 1, January 2017, Pp. 145-154.
- Billings R. and Jones C. (2008), Forecasting urban water demand 2nd ed. M. VALENTINE. R. S. How ARD & C. Armstrong, EDS., Denve R. American water works Association.
- Biwater (2013). Lower Usuman Dam Water Treatment Plant (phase 3 and 4) September 2013. Image Courtesy of Biwater.
- Blimes I. S” SCADA and Network Analysis Hydraulics and Hydrology in small computer Age”, American society of civil Engineers (2) pp 880-886, 1985.
- Bridget R. Searlean, Ian Jolly, Marious Sophocleous, Lu Zhang (2007). First Published: 27 March 2007|https://doi.org/10.1029/2006WR005486|.
- Chambers, C. and Ekanem, N. (2007) Note on project reports Federal Public Services Reform programme: Federal Capital Territory Water Board Structural Assessment and Capacity Requirement. Abuja partner for Water and sanitation.
- COHRE (2008), Centre on Housing Rights and Evictions and Social and Economic RightAction Centre. The myth of the Abuja master plan, Abuja.
- Coulibaly P., Anctil F. and Bobee B. (2000), Daily reservoir inflow forecasting using Artificial Neural Networks with stopped Training Approach.Journal of hydrology, pp.24– 257.
- Çuhadar, M. (2006). Turizm sektöründe talep tahmini için yapay sinir ağları kullanımı ve diğer yöntemlerle karşılaştırmalı analizi (Antalya İli’nin dış turizm talebinde uygulama) [Forecasting tourism demand by artificial neural networks and time series methods (A comparative analysis in inbound tourism demand to Antalya).(Doctoral.Thesis)].üleymen Demirel Üniversitesi Sosyal Bilimler Enstitüsü, Isparta.
- Cybenko.G. (1989), Approximation by supervisions of Sigmoid Function Mathematics of control, signals and systems 2.302-314.
- Emir, Ş. (2013). Yapay sinir ağları ve destek vektör makineleri öntemlerinin.sınıflandırmaperformanslarının karşılaştırılması: Borsa endeks yönünün tahmini üzerine bir uygulama [Classification performance comparison of artificial neural networks andsupport vector machines methods: An empirical study on predicting stockmarket index movement direction (Doctoral Thesis)]. İstanbul Universities Sosyal Bilimler Enstitüsü, İstanbul.
- Ergün Akgün and Metin Demir (2018), International Journal of Assessment Tools in Education, 2018, Vo1. 5, No, 3, 491 – 509.DO1: 10. 21449/ijate 4444073. Published at http:// wwww.ijate.net
- FCTWB (2000). Second treatment plant commences operation Abuja: Federal Capital Territory water board special edition.
- Govindaraju R. S (2000), Artificial neural network in hydrology. Journal of hydrologic Engineering, 5 (2), 124-137.
- Grander M.W. Dorling S.R (1998), Artificial neural networks (the multilayer perceptron), a review of application of the atmospheric sciences. Atmospheric environment 6 (32); 2627-2636.
- Haque M. M. Hadda K. Rahman A. Hossan M. Hagere D. and Kabria G. (2013), Long Term Demand Forecasting: Use of Carios Crooss validation for the best model selection;20thinternational congress on modeling and simulation, Adelelade, Australia, pp 2311 – 2317, 2013.
- Henri P. Given. (2016). The Levenberg-Marquardt method for nonlinear least squares curve-fitting problems.
- Hornik, Stincheamber M.S White H. (1989). Multilayer feed forward Network and universal Approximators. Neural Networks, 2 (5), 359-366.
- IPA – International planning associates (1979), The master plan for Abuja – The New Federal capital of Nigeria, Abuja: International planning Associates.
- Ivakhnenko A. G (1970), Heuristic self – organization in problems of engineering cybermutic, Automatica, 6(2), 207 – 219, doi: 10. 1016/0005 – 1098(70) 90092 – 0.
- Jagadeesh A. Bin Z. and Govindaraju R. S (2000), Comparison of ANNS and Empirical Approaches for predicting water shed Runoff. Journal of water resources planning and management/may/june 2000.
- Jefferson and Qiang (2010), Statistical Modeling of daily urban water consumption in Hong Kong; Trend, changing patterns, and forecast. Water resources research, March, 2010, Doi:101029/2009 WR008147.
- httpps://pdfs.Semanticscholar.org/69F 8/173 C375 and 07F3e43Ca9cdd34-19C 8CeC 923.pdf.
- Karamouz M. F. Szidarovsk and B. Zahraie (2003), Water resources system analysis. Leris publ., Boca Raton, Fla.
- Kinney H. C. MD, T. McHugh, BS, K. Miller, MD, R. A. Belliveau, BS.S. F. Assmarn (2002), Journal of Neuropathology and Experimental Neurology, volume 61, issue 5, may 2002.
- Kisi O. (2004), “Multi-layer Preceptors with Levenberg – Marquardt training algorithm for suspended sediment concentration prediction and estimation. Hydrological Science Journal 49(6).https://doi:org/10.1623/hysj.49.6.1025.55720.
- Kuyucu, Y. E. (2012). Lojistik regresyon analizi (LRA), yapay sinir ağları (YSA) ve sınıflandırma ve regresyon ağaçları (C&RT) yöntemlerinin karşılaştırılması ve tıp alanında bir uygulama [Comparison of logistic regression analysis (LRA), artificial neural networks (ANN) and classfication and regression trees (C&RT) methods and an aplication in medicine (Master’s Thesis)]. Gaziosmanpaşa Üniversitesi Sağlık Bilimleri Enstitüsü, Tokat.
- Lahlou M. & Colyer, D. (2000), Water conservation in Casablanca, Journal of American water resource association (JAWRA), 36(5), 1003-1012.
- Lynne E. Parker (2010), Notes on multilayer, Feedforward Neural Networks, CS425/528: Machine Learning. Fall 2010.
- Maier. G.C Dandy (2000), “Neural networks for the prediction and forecasting of water resource variables: a review of modeling issues and applications”, environmental modeling and software, pp.101-124, Jan.2000.
- Md. Mahmudul Haque, Ataur Rahman, Dharma Hagara and Golam Kibria (2013), A comparison of linear and Nonlinear regression modeling for forecasting long term urban water demand. A case study of for Blue Mountains water supply system in Australia:ICWRER 2013/proceeding” Do:105675/ ICWRER,2013.
- N. Mohana Sundram, S. N Sivanandam and V.Renupriya, (2016), Artificial neural network approach for dynamic modeling of heat exchange data prediction. Indian journal of science and Technology, vol. 9 (sI), Do1: ID,17485/ijst/2016/vgi si/8689, December 2016.
- Office Technology Assessment (OTA) U, S; use of models for Water Resources Management, Planning and Policy; August 1982; NTIS Order # P1383 –103655. Pp. 119 – 128 (Chap. 6)
- Ozbek F.S. and H. Fidan (2009), Estimation of pesticide usage in the agriculture sector in Turkey using artificial neural network (ANN), J. Annual plant sci, 4(3),373 – 378.
- Premium Time, by Nnanna Ibeh, February 28, 2013.
- Prüss-Üstün A, Boss R, Gore F, Bartram J. (2008). Safer Water, better health; costs, benefits and sustainability of interventions to protect and promote health. World Health Organization, Geneva, 2008.
- Rahmato, D. (1999), Water resource development in Ethiopia: Issues of Sustainability and Participation, Forum for Social Science Studies (FSS) Addis Ababa, Ethiopia.
- R. Ita Enang, B. J. Reed and S. Kayaga (UK) (2016) 39th WEDC international conference, Kumasi, Ghana, 2016. Ensuring availability and sustainable management of water headquarters and area office perspectives.
- Saurabh Karsoliya, (2012) “Approximating Number of Hidden layer neurons in multiple Hidden layer BPNN Architecture, “International Journal of Engineering Trends and Technology – volume 3 Issue 6-2012.
- Saul Arlosoroff (1998), Water demand management. Regional conference on promoting sustainable consumption in Asian Cities, 1998.
- Shahoo, G. B., and C. R (2006), Flow Forecasting for a Hawaii Stream using rating curves and neural networks, J. Hydrel., 317, 63 – 80, Doi:10:1016/J. JhydnoL. 2005. 05.008.
- Şengür, D. ve Tekin, A. (2013). Öğrencilerin mezuniyet notlarının veri madenciliği metotları ile tahmini [Prediction of student’s grade point average by using the data mining methods]. Bilişim Teknolojileri Dergisi, 6(3), 7-16.
- Shandas V. and Parandvash G. H., (2010), Integrating urban form and management: An empirical analysis of Portland, OR. Environment and planning B, vol. 37, 112 – 128.
- S. N. Sivanadam, S. Sumathi, and S. N. Deepa, Introduction to Neural Networks Using Matlab 6.0, Tata McGraw Hill, 1st edition, 2008
- Sumayah Amal AL-din, modeling the water quality index and climate change variables using an artificial neural network and non-linear regression: International Journal of Engineering and Technology, July 2018.
- UNDAF (2006), United Nations Development Assistance Frame work reported 2002 –2006 policy paper in corroboration between united Nations and Arab Republic of Egypt 2006.
- UN-Habitat (1999), Global urban observatory. United Nations Human Settlements Programme, version 2.
- United Nation (2012), The human right to water and sanitation; International decade for action water for life”2005 to 2015.http: www.un.org./water for life decade human right water. Retrieved on August, 2013.
- United Nation (UN) Sixty – fourth General Assembly Plenary 28, July (2010), on Human light to water and sanitation. (61) United Nation Population Urbanization prospect (UNPUP) (2015).
- Wegelin – Schuringa M. (2000), Water Demand Management and the urban poor, IRC int. water and saint. Cent. The Haque, Netherlands.
- WHO (1996). The World Health report 1998 – Fighting disease, fostering development; Geneva, Zwitzerland, http:// WWW.who. Int/whr/ 1996/en/.
- WHO/UNICEF Annual Report (2017), Joint Monitoring Programmed for water Supply, Sanitation and Hygiene (JMP).
- Yurdakul, E. M. (2014). Türkiye’de ithalatın gelişimi ve ithalatın yapay sinir ağları yöntemiile tahmin edilebilirliğine yönelik bir analiz [The evolution of import in Turkey and an analysis about predictability of import by artificial neural network method (Doctoral Thesis)]. Adnan Menderes Üniversitesi Sosyal Bilimler Enstitüsü, Aydın