Estimating a Finite Population Mean Under Two-Phase Sampling Using Exponential Ratio Estimator
- Miriel Oshome Caren
- 144-164
- May 4, 2024
- Mathematics
Estimating a Finite Population Mean Under Two-Phase Sampling Using Exponential Ratio Estimator
Miriel Oshome Caren
Department of Mathematics and Actuarial Sciences, Kenyatta University, Kenya
DOI: https://doi.org/10.51584/IJRIAS.2024.90410
Received: 11 March 2024; Accepted: 04 March 2024; Published: 04 May 2024
ABSTRACT
Estimation of population parameters such as population mean, and population total has been a major concern in Sample Survey Theory. In sampling theory, researchers employ auxiliary information to improve precision and validity of estimators. This study applies two-phase sampling in estimation of a finite population mean using modified exponential ratio estimator. Two-phase sampling was used since it leverages on the information collected in the first phase, along with auxiliary variables, to guide the selection of a more targeted and efficient second-phase sample, resulting in increased precision for the estimates of interest. Study results showed that the proposed modified exponential ratio estimator produced a smaller Bias and MSE than Shabbir and Gupta (2007), and Singh and Solanki (2013). Further, the proposed estimator produced a higher relative efficiency as compared to Shabbir and Gupta (2007), and Singh and Solanki (2013).
INTRODUCTION
This chapter presents background of study, problem statement, objectives, justification and significance of the study.
Background Information
Many methods are available in literature on how to estimate population parameters such as population mean and population total. These methods can generally be divided into two broad methods, namely parametric methods where a probability distribution is assumed to generate random values for the survey variable(s) and non-parametric methods where no underlying distribution is assumed prior to estimation of population parameters. In the later approach, values are assumed to be distribution free (Kvam, Vidakovic, & Kim, 2022).
In Sampling Theory, researchers employ auxiliary information to improve the efficiency of estimators for population parameters of interest. Authors such as Särndal, Swensson and Wretman (2003) discussed various methods of finding estimators and categorised these methods as: model-based approach, model assisted approach and design-based approach. As such, model-based estimators rivalled design-based estimators when the survey variables were linearly related to the auxiliary random variables.
Haq, Khan and Hussain (2017) observed that auxiliary information improves the precision and validity of estimating the population mean for the variable under study. Traditional estimators such as ratio, product, difference and linear regression estimators that utilized the information on auxiliary variables were introduced. The ratio estimator introduced by Cochran (1940) is more efficient if there is a positive correlation between study variable Y and auxiliary variable X, while the product estimator introduced by Murthy (1964), is more useful when there is a negative correlation between study variable Y and auxiliary variable X. A linear regression estimator is useful when the line of regression of Y on X is linear but does not pass through the origin.
Auxiliary variables have assisted in finding unbiased estimators in population totals (Dagdoug, Goga, & Haziza, 2023). According to Walsh (1970), the total Y of a finite population of size N is estimated based on a simple random sample of size in and complete knowledge about a population of N values that correspond to the values of the population with unknown total Y. Srivenkataramana and Tracy (1979) considered four estimators suited for cases where correlations were only moderate and a rule for choosing among these traditional estimators was established. The methods were built around the idea that estimating the population total is essentially equivalent to estimating the total corresponding to non-sample units. These methods consider an extension for using multi-auxiliary information.
Such modified estimators were generally developed ether using one or more unknown constants or introducing a convex linear combination of sample and population means of auxiliary characteristic with unknown weights. In both cases, optimum choices of unknown constant are made by minimising the mean square error of modified estimators to become more efficient than the traditional one. Bahl and Tuteja (1991) introduced exponential ratio-product type estimator and showed that the estimators performed better than the traditional estimators. Later on, various authors like Upadhyaya et al. (2011) and Solanki et al. (2012) added to the knowledge of exponential estimators in sampling theory. Singh (1967) utilised information on two auxiliary variate x1 and x2 and suggested a ratio-cum-product estimator for population mean. Singh and Tailor (2005) utilised known correlation coefficient between auxiliary variates (px1,x2) and x2.
The choice of two-phase sampling has been informed by Hidiroglou and Sarndal (1998) and Hidiroglou (2001), whose works contended that two phase sampling is more efficient when the population mean (x̄) of the auxiliary variable (X) is unknown at the start of a survey. As such, it is usually used when the number of units required to give the desired precision on different items is widely different. Also, its usefulness emerges when it uses the gathered information from the first phase as auxiliary information so as to increase the precision of information to be obtained in the second phase (Singh & Vishwakarma, 2007).
Thus with an ever dynamic data characteristics, estimation techniques need to be as dynamic as possible in order to rightly derive meaningful information from data. Therefore, this study sought to improve finite population mean estimation under two-phase sampling using an exponential ratio estimator.
Problem Statement
Estimation of the population mean with greater precision is of great concern in Sampling Survey Theory. Precision of estimates can be improved by increasing the sampling isize ibut doing so tends to reduce the benefits of sampling. Therefore, the precision may be increased by using an appropriate estimation procedure that utilises auxiliary information closely related to the study variable. Some of the estimation methods that make use of auxiliary information include products, ratio and regression estimators. When there is a strong positive or negative correlation with the auxiliary variable and the regression line passes through the origin, then the estimator which is informed by the auxiliary variable improves population mean estimation.
According to Shabbir and Gupta (2011), despite regression estimator having less practicality, it appears to be in a unique position because of its strong theoretical foundation. Even though the regression estimator is more effective in many real-world situations, the traditional ratio and product estimators have efficiency levels that are comparable to those of linear regression. Due to the less practicability restriction (assumption violations, data sample size requirement, multicollinearity, outliers and missing values), different scholars have conducted studies in an effort to increase the effectiveness of the current ratio, product, or classes of ratio and product estimators of the population mean in simple random sampling without replacement. This far, Singh and Solanki (2013) proposed an estimator, which was a modification of Kadilar and Cingi (2006a, 2006b) estimators, and was more efficient than the regression estimator. Moreover, in instances where data collection is very costly and presents an impossibility due to factors linked to acquisition of the raw data, phased sampling becomes useful. That is, if a researcher is investigating a variable Y and it is costly to gather data on Y, but there exists a variable X that is known to be correlated to Y and is cheap to get data on, phased sampling becomes handy. By developing an estimator utilising the correlation between X and Y, two-phase sampling lowers the variance of the predicted total. The two-phase framework can be used in cases where there are challenges of missing data, as is in some occasions during sampling, or no suitable frame. As such, the proposed study estimates a finite population mean using a modified exponential ratio estimator in a two-phase sampling.
Justification and Significance of the Study
This study focused on developing a modified ratio exponential estimator of the population mean in two–phase sampling. It is expected that estimators developed under these sampling schemes will give rise to smaller variance compared to their rival estimators under other sampling schemes.
Objectives of the Study
General Objective
To construct a modified exponential ratio estimator for finite population mean under two-phase sampling.
Specific Objectives
- To derive a modified ratio exponential estimator of the population, mean in two phase sampling.
- To compare the efficiency of the proposed estimator to that of Shabbir and Gupta (2007) and that of Singh and Solanki (2013).
Significance of the Study
This study focused on developing a modified ratio exponential estimator of the population mean in two-phase sampling. The estimators developed under two-phase sampling schemes gave a smaller Mean Squared Errors compared to their rival estimators under other sampling schemes therefore resulting to higher precision of estimators.
LITERATURE REVIEW
Introduction
This chapter reviews previous work related to this study. In particular, reviews of estimation methods and empirical reviews of ratio estimators are provided.
Review of Estimation Methods
The main approaches used in estimation of a modified ratio exponential estimator, as discussed by Särndal, Swensson and Wretman (2003), are the design based approach, model-based or super-population approach, model assisted approach and design assisted approach. In the design-based approach, the observed values of the variable Y given by y1, y2, ……,yn are assumed to be unknown but fixed constants. In this concept, a sample is drawn from the finite population and the sample measurements are utilised in the estimation of the population parameter of interest. Under the model based approach, an assumption that the actual survey measurements y1, y2, …..,yn are realised values of the random vector Y1,Y2,……,YN is made. In this approach, the model is summarized as Yi=m(Xi)+ei for =1,2,…..,N where m(Xi) is a smooth function and ei is a sequence of independent and identically distributed random variables with mean zero and finite variance.
The estimator of the population mean under this approach is defined as:
T ̂= Σies Yi + Σier Yi
where Σies Yi denotes the sample proportion and Σier Yi denotes the non sample pro-portion (Särndal, Swensson & Wretman, 2003).
The model assisted approach incorporates auxiliary information into the design based estimation of the population mean. It assumes the existence of a super population model between the auxiliary variables and variable of interest for the sampled population (Ståhl et al., 2016). The model assisted approach integrates auxiliary information, which are related to the main variable of interest but may not be directly measured within the sampled population (Dagdoug, Goga, & Haziza, 2023). By leveraging this additional information, the approach aims to enhance the accuracy and robustness of population mean estimation.
In addition, the model-assisted approach utilises the design-based estimation framework, which considers the specific sampling design used to collect the data (Haq, Khan, & Hussain, 2017). This approach allows for more information about the entire population based on the information of the sampling process, ensuring that estimation results are grounded in the underlying sampling design.
Moreover, the model-assisted approach operates under the assumption of a super population model, delineating the correlation between auxiliary variables and the variable of interest throughout the entire population (Haq, Khan, & Hussain, 2017; Dagdoug, Goga, & Haziza, 2023). By incorporating information from this model, the approach gives a better understanding of how auxiliary variables influence the variable of interest within the sampled population. Additionally, the approach posits that there is a connection between the auxiliary variables and the variable of interest in the sampled population (Haq, Khan, & Hussain, 2017).
The population quantities of interest are estimated in such a way that the design-based properties of the estimator can be established. This contradicts the model-based approach for which the design-based inference is into possible. In the design assisted approach, the model is used to increase the efficiency of the estimators (Onsongo, 2018). Design assisted approach aims to enhance the precision of survey estimates and make data collection more efficient by incorporating pre-existing information into the survey design process (Onsongo, 2018; Mugambi, 2023). Estimators remain typically design consistent even if the model is not correct. Since this approach has a great potential to improve the precision of the required survey estimators when the appropriate auxiliary information is available, it often requires that these models are linear (Odhiambo, 2019). Of the survey approaches, the model-based approach has been considered to be the most consistent method of estimation (Särndal, Swensson & Wretman, 2003; Ståhl, 2016). In this study, a model-assisted approach was applied.
Empirical review of ratio estimators
Sing, Malviya and Tailor (2023) presented a new category/class of ratio-product-ratio estimators in two phase sampling. The research determined the optimum mean values, as well as the least mean square error of the proposed estimator. Using the mean square error criteria, the researchers compared the performance of the proposed and existing estimators such as those developed by Pal and Singh, (2017), Muhammad, Zakari, & Audu, (2021) and found that the proposed class of estimators were more efficient than the prior estimators. Samiuddin and Hanif (2007) proposed regression and ratio estimation methodologies for estimating the population mean utilizing instances with partial and no information in two-phase sampling. Using actual datasets, the characteristics of proposed estimators, including bias and mean square error were determined. On the basis of the comparisons, the study concluded that the derived estimators were more efficient than their rival estimators constructed under other sampling schemes. In addition, Ahmad (2008) provided a number of estimators for two-phase and multiphase sampling utilizing data on a variety of auxiliary variables. Using several auxiliary variables, Hanif et al. (2010) created the regression estimator. The proposed estimator’s characteristics, such as bias and mean square error, were developed and evaluated using actual data sets. The results showed that the mean square error obtained from Hanif et al. (2010) estimator were lower than those of Ahmad (2008), presenting a better estimator in the process.
Singh and Vishwakarma (2007) modified the two-phase sampling developed by Bahl and Tuteja (1991). Using actual datasets, the study evaluated the proposed estimator to existing estimators-based ion the criterion of mean square error and relative efficiency. The empirical study found that Singh and Vishwakarma (2007) ratio and product estimator, that was obtained after modifying the estimator developed by Bahl and Tuteja (1991), was more efficient compared to Bahl and Tuteja (1991) estimators (exponential ratio-type and exponential product-type estimators). Ozgul and Cingi (2014) introduced a class of exponential regression cum ratio estimators for estimating the populations mean using two-phase sampling. In terms of mean square error and percent relative efficiency, the developed estimator had a higher efficiency (Pal & Singh, 2017). Using a two-phase sampling technique, Sukhatme (1962) proposed a generalized ratio-type estimator. The suggested classes of estimators were generated and applied to actual datasets. Rao (1973) used two-phase sampling when stratification and non-response challenges were present. Non-response challenges occur when selected units or respondents do not participate or provide complete information in a survey (Sikov, 2018). These issues can lead to biased, less precise, and potentially inaccurate results. The study determined the properties of the proposed estimator, including bias and mean square error. The suggested estimator demonstrated superior performance in terms of mean square error and relative efficiency.
Srivenkataramana (1980) advocated transforming an auxiliary variable to improve the performance of the estimator of the population mean. Using two auxiliary variables for two-phase sampling, Sahoo et al. (1993) proposed a regression-based technique to estimate. They got the characteristics of the proposed estimator, including bias and mean square error. The suggested estimator demonstrated superior performance in terms of mean square error and relative efficiency (El-kenawy et al., 2022). Singh and Upadhyaya (1995) proposed a generalized estimator for the population mean employing two auxiliary variables in two-phase sampling as a means of enhancing the accuracy of estimators.
Yadav et al. (2016), and Misra (2018), proposed a two-phase estimation method for estimating the population mean in double sampling with an auxiliary variable. In the first stage, a random sample was drawn from the population, and in the second stage, an additional sample was taken using ani auxiliary variable that was correlated with the variable of interest. Yadav et al. (2016) estimators typically involved weighting the observations from each phase based on the auxiliary variable’s correlation with the variable of interest. Misra (2018) approach improved upon the foundation laid by Yadav et al. (2016) and further refined the estimation method for double sampling with an auxiliary variable. The key contribution of Misra (2018) was the development of novel weighting schemes that better accounted for the relationship between the auxiliary variable and the variable of interest. The aim was to minimize bias, reduce variance, and improve the overall precision of the population mean estimates.
Several researchers have, however, proposed modified estimators for predicting the population mean of the study variable using known values of specific population parameters, such as coefficient of variation, coefficient of kurtosis, and correlation coefficient. Recent study by Yahaya and Kabir (2017) proposes a modified ratio product estimator of the population mean of utilising the median and coefficient of variation of the auxiliary variable in a stratified random sampling strategy. However, the studies of these alternative estimators still have low precision and may be improved by the use of two-phased sampling scheme.
METHODOLOGY
Introduction
This chapter presents the modified exponential ratio estimator under two phase sampling in estimating the finite population mean.
Exponential Ratio Estimator
Let a finite population U = {U1 ,… …, UN} of size N comprising of (Yi, Xi). Let Ȳ= ∑Ni=1Yi/N and x̄=∑Ni=1Xi/N be the population means of the study variable Y and the auxiliary variable X, respectively.
In estimating the population mean Ȳ of y, a simple random sample of size n is drawn without replacement from the population U. Let ȳ= ∑Ni=1 yi/n and x̅=∑Ni=1 xi/n be the unbiased estimators of population means Ῡ and x̄ respectively. Then the modified ratio estimator is defined by;
ȳp =ȳ(x̄/x̅), if x̅≠ 0 (3. 1)
Where x̅, the mean of the auxiliary variables x is known.
With known population mean x̄, Bahl and Tuteja (1991) suggested that the exponential ratio-type estimator given by
ȲRe = ȳ exp(x̄−x̅/x̄+x̅) (3. 2)
be for the population mean Ȳ.
If the population mean x̄ of the auxiliary variable X is not known before the start of the survey, then it may be necessary to do the sampling in two-phase (or double sampling). Notably, this study considered only simple random sampling without replacement scheme (SRSWOR).
When the population mean x̄ of the auxiliary variable X is unknown, a first-phase sample of size in′ is drawn from the population ion which only the auxiliary variable X is observed. Then a second phase sample of size in is drawn on which both study variable Y and auxiliary variable X are observed. Let ȳ= ∑ni=1 yi/n and x̅=∑ni=1 xi/n denote the sample means of variables Y and X, respectively,
obtained from the second sample of size n and x̅ˊ=∑ni=1xi/n′ those obtained from the first sample of size n′. Then the two-phase sampling version of the ratio ȲRd estimator of population mean Ȳ will be given by;
ȲRd= ȳ(x̄′/x̅ ) (3. 3)
The estimator ȲRd is due to Sukhatme (1962). In two-phase sampling, the study suggested the following modified exponential ratio estimator for Ȳ, as;
Ȳ ̂ReMd = ȳ exp (x̅′−x / x̅′+x̅) (3.4)
It was observed that ȳRd and Ȳ ̂ReMd were biased estimators, but the bias being of the order n-1, can be assumed negligible in large samples. The variances of these estimators were obtained up to the terms of order e-1 (Singhi & Vishwakarma, i2007).
Modification of Exponential Ratio Estimator under Two Phase Sampling
Adebola and Adegoke (2015), used the model assisted approach and proposed the ratio estimator under two phase sampling scheme as;
ȲRd=ȳ(x̅*/x̄)+α(x̄-x̅* ) (3. 5)
Where α represents a parameter that minimises the mean square error of the estimator Ȳ*Rd.
Thus, the proposed modified exponential estimator under two-phase sampling where there will be two components, the first part – the ratio type estimator as proposed by Sukhatme (1962), and the second part – the regression type estimator proposed by Adebola and Adegoke (2015) is given by;
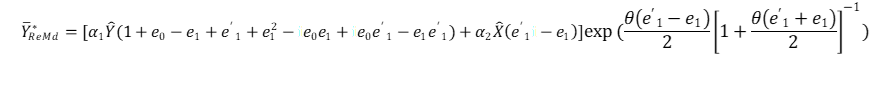
Ȳ*ReMd = exp (x̅′−x / x̅′+x̅) [α1ȳ(x̅*/x̄)+α2(x̄-x̅*)] (3. 6)
Asymptotic property of the Modified Exponential Estimator
The study determined the asymptotic biasedness and mean squared error of the modified exponential estimator.
Asymptotic Biasedness of the Modified Exponential Estimator
Let the proposed estimator, in equation (3.6) be defined in such a way that, α1=1 and α2=0, then the mxture estimator simplifies to a ratio-type exponential estimator. Similarly, when α1=0 and α2=1, the mxture estimator simplifies to a regression-type exponential estimator. Here, α1 and α2represent real parameters that need to be determined such that the mean square error of the proposed estimator Ȳ*ReMd is minimised.
ȳ=Ȳ(1+e0), x̅=x̄(1+e1), and x̅′=x̅(1+e’1) (3. 7)
Where;
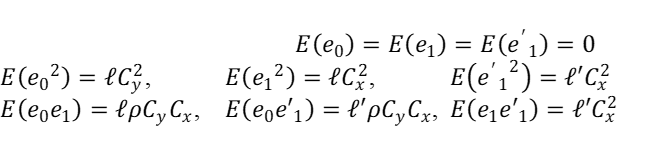
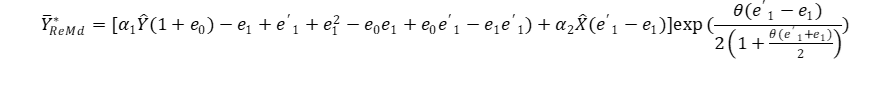
Rewriting equation (3.6) in terms of ei(=0,1);
 (3. 8)
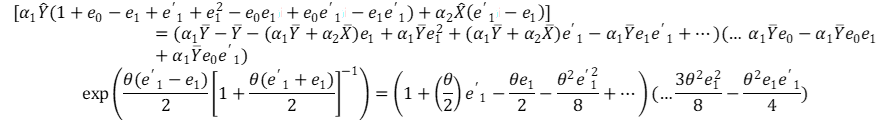
By utilizing the first-order Taylor series expansion of (1+e1)−1, factorizing the exponential component and expanding the first term to the first-order approximation, and subsequently multiplying and disregarding terms of ei’s greater than two, gives:
 (3. 9)
Where ;
θ=(αxX ̂)/(αxX ̂+bx)
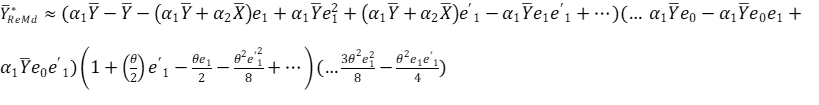
Factoring out the common terms in the exponential part in equation 3.9;
 (3. 10)
Expanding the first and second (exponential) part, and disregarding terms of ei’s greater than two;
From equation 3.10;
 (3. 11)
Expanding and factoring out the common terms;
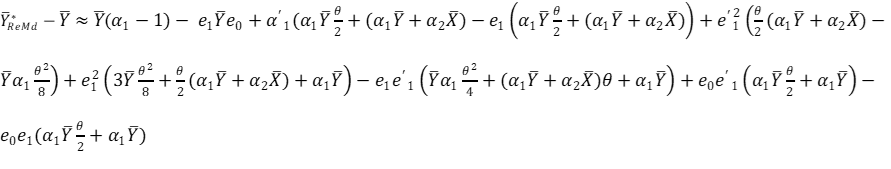 (3. 12)
The Bias, from equation (3.12), of the proposed estimator is given by;
 (3. 13)
λ and λ′ are constants for the population and sample units. Cy is the coefficient of variation for y (Cy=Sy/Ȳ) and Cx is the coefficient of variation for auxiliary variable x (Cx=Sx/x̄). ρ is the correlation coefficient between auxiliary variable x and y (ρyx=Syx/(SySx)). Syx is the covariance between the study and auxiliary variables.
Further, the MSE of the proposed estimator, from equation 3.12, becomes;
![]() (3. 14)
(3. 14)
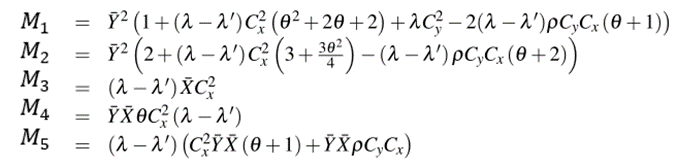
The Asymptotic Mean squared of the Modified Exponential Estimator
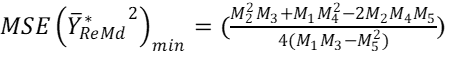
Asymptotic Mean Squared Error of the Modified Exponential Estimator represents the estimator’s expected squared values in the limit of a large sample size which is finite. Differentiation partially with respect to α1 and α2 and equating to 0, the optimum values for α1 and α2 becomes;
α1=M2M3−M4M5/2(M1M3−M25)
and2
α2=M1M4−M2M5/2(M1M3−M5)
Replacing the optimal values of α1 and α2 into equation (14), the minimum MSE of the proposed estimator becomes;
DISCUSSION OF SIMULATION RESULTS
Introduction
In this chapter, simulation study was conducted to investigate the performance of the modified ratio exponential estimator in two-phase sampling. The results were compared with estimators developed by Shabbir & Gupta, (2007) and Singh & Solanki, (2013).
Simulation Study
Let Y be a sample of n=1000, and X be a sample of n’=1000. The study simulated three different population as shown in Table 4. 1, Table 4. 2, and Table 4. 3. Model 1 conforms to a normal distribution, model 2 adhered to a mixed beta-normal distribution, and model 3 adhered to a mixed gamma-normal distribution. The model parameters resembled a linear, exponential, and quadratic models.
In the first simulation, let the population be drawn from three different models, as defined in Table 4. 1.
Table 4. 1 Model Simulation for Population 1
|
Population |
Study Variable (Y) |
Auxiliary Variable (X) |
|
1 |
First Model: Y=aX+ε (Linear) |
X Normal(1.5,1) |
|
2 |
Second Model: Y=a+πx+ε (Exponential) |
X Beta(2,2) |
|
3 |
Third Model: Y=aX2+X+ε (Quadratic) |
X Gamma(7.5,1) |
Source: Researcher (2024).
Table 4. 1 above displays the simulation parameters and the adopted models. Within each model, the parameters were simulated utilising linear, exponential, and quadratic models as presented in Table 4. 4.
Again, in the second simulation, let the population be drawn from three different models, as defined in Table 4. 2.
Table 4. 2 Model Simulation for Population 2
|
Population |
Study Variable (Y) |
Auxiliary Variable (X) |
|
1 |
First Model: Y=aX+ε (Linear) |
X Normal(2.3,1.2) |
|
2 |
Second Model: Y=a+πx+ε (Exponential) |
X Beta(1.5,1) |
|
3 |
Third Model: Y=aX2+X+ε (Quadratic) |
X Gamma(6.3,2) |
Source: Researcher (2024)
Table 4. 2 above displayed the simulation parameters and the adopted models. Within each model, the parameters were simulated utilising linear, exponential, and quadratic models as presented in Table 4. 5.
In the third simulation, let the population be drawn from three different models, as defined in Table 4. 3.
Table 4. 3 Model Simulation for Population 3
|
Population |
Study Variable (Y) |
Auxiliary Variable (X) |
|
1 |
First Model: Y=aX+ε (Linear) |
X Normal(4.5,2.2) |
|
2 |
Second Model: Y=a+πx+ε (Exponential) |
X Beta(3.3,3) |
|
3 |
Third Model: Y=aX2+X+ε (Quadratic) |
X Gamma(4.4,1) |
Source: Researcher (2024)
Table 4. 3 above displayed the simulation parameters and the adopted models. Within each model, the parameters were simulated utilising linear, exponential, and quadratic models as presented in Table 4. 6.
The proposed modified exponential estimator under two-phase sampling where there are two components, the first part drawn from iSukhatme (1962), and the second part drawn from Adebola and Adegoke (2015), was given as:
Ȳ*ReMd = exp (x̅′−x / x̅′+x̅) [α1ȳ(x̅*/x̄)+α2(x̄-x̅*)]
Shabbir and Gupta (2007) estimator:
ȳ=[Ȳ(1+δ0)−x̄δ1](1+δ1/N+1)
Where;
δ0=ȳ−Ȳ/Ȳ, δ1=x̅−x̄/x̄
Singh and Solanki (2013) estimator
ȳ^=ȳ+β(x̄−x̅)
Where;
β^=Syx/S2x
Bias(H)=1100∑100i=1(Ȳ^−Ȳ), MSE (H)=1/100∑100i=1(Ȳ^−Ȳ)2, and REH= MSE(Ȳ)MSE(H), where H represents the respective estimators’ mean, and RE represents Relative efficiency of the estimator.
Simulation results
Within each model, the estimators were simulated utilising linear, exponential, and quadratic models and presented in Table 4. 4, Table 4. 5, and Table 4. 6.
Table 4. 4 Model Parameters from Population 1
|
Estimators |
Means |
Bias |
MSE |
RE |
|
Model 1: Y=aX+ε |
||||
|
Sample Mean (ȳ) |
1.5 |
0.01429 |
0.14871 |
100 |
|
Shabbir and Gupta (2007) |
1.4613 |
0.01147 |
0.14378 |
103.43 |
|
Singh and Solanki (2013) |
1.0828 |
0.01246 |
0.14474 |
102.74 |
|
The proposed ( Ȳ*ReMd ) estimator |
1.4943 |
-0.08469 |
0.13702 |
108.53 |
|
Model 2: Y=a+πx+ε |
||||
|
Sample Mean (ȳ) |
0.5 |
0.00042 |
0.0708 |
100 |
|
Shabbir and Gupta (2007) |
1.9422 |
0.04389 |
0.26051 |
27.18 |
|
Singh and Solanki (2013) |
0.5845 |
0.01905 |
0.11643 |
60.81 |
|
The proposed ( Ȳ*ReMd ) estimator |
0.5391 |
0.08511 |
0.08283 |
85.48 |
|
Model 3: Y=aX2+X+ε |
||||
|
Sample Mean (ȳ) |
7.5 |
0.15288 |
21.83404 |
100 |
|
Shabbir and Gupta (2007) |
7.9836 |
-0.48764 |
18.0436 |
121.01 |
|
Singh and Solanki (2013) |
7.6418 |
0.08125 |
16.43158 |
132.88 |
|
The proposed (Ȳ*ReMd ) estimator |
7.5517 |
0.02124 |
12.70415 |
171.87 |
Source: Researcher (2024)
From Table 4. 4 above, each model (Model 1, Model 2, and Model 3), the table presents results for three different estimators: Sample Mean, Shabbir and Gupta (2007) estimator, Singh and Solanki (2013) estimator, and the proposed estimator ( Ȳ*ReMd). Under each model, Bias column quantifies the bias of each estimator compared to the true value of the parameter. The MSE column presents the mean squared error of each estimator, indicating its overall accuracy. The RE column shows the relative efficiency of each estimator compared to the sample mean, with a higher value indicating greater efficiency.
In model 1 whose auxiliary variable was drawn from a Gaussian distribution, the bias and MSE of the proposed estimator (Bias=-0.08469; MSE=0.13702) was lower than the bias for Sample Mean, Shabbir and Gupta (2007), Singh and Solanki (2013) estimators (Bias=0.01429, 0.01147, and 0.01246; MSE=0.14871, 0.14378, and 0.14474). The proposed estimator had a higher relative efficiency (RE=108.53%), as compared to Sample Mean, Shabbir and Gupta (2007) estimator, Singh and Solanki (2013) estimators whose relative efficiencies were 100%, 103.43%, and 102.74% respectively. In model 2 whose auxiliary variable was drawn from a Beta distribution, the bias of the proposed estimator (Bias=-0.08511 was greater than the bias for Sample Mean, Shabbir and Gupta (2007) estimator, Singh and Solanki (2013) estimator (Bias=0.00042, 0.04389, and 0.01905), while the MSE of the proposed estimator (MSE=0.08283) was lower than Shabbir and Gupta (2007), and Singh and Solanki (2013) estimators (MSE= 0.26051, and 0.11643). In addition, the proposed estimator had a higher relative efficiency (RE=85.48%), as compared to Shabbir and Gupta (2007) estimator, Singh and Solanki (2013) estimators whose relative efficiencies were 27.18%, and 60.81% respectively. Nevertheless, the sample mean had the least Bias (0.00042) and MSE (0.0708), and a higher relative efficiency (100%).
In model 3 whose auxiliary variable was drawn from a Gamma distribution, the bias and MSE of the proposed estimator (Bias=-0.02124; MSE=12.70415) was lower than the bias for Sample Mean, Shabbir and Gupta (2007), Singh and Solanki (2013) estimators (Bias=0.15288, -0.48764, and 0.08125; MSE=21.83404, 18.0436, and 16.43158). The proposed estimator had a higher relative efficiency (RE=171.87%), as compared to Sample Mean, Shabbir and Gupta (2007), Singh and Solanki (2013) estimators whose relative efficiencies were 100%, 121.01%, and 132.88% respectively.
From the second simulation described in Table 4. 2, Table 4. 5 presents the model estimates that were obtained.
Table 4. 5 Model Parameters from Population 2
|
Estimatorsi |
Means |
bias |
iMSE |
RE |
|
Modeli 1: Y=aX+ε |
||||
|
Samplei mean (ȳ) |
2.3 |
-0.01049 |
0.15373 |
100 |
|
Shabbir and Gupta (2007) |
2.3309 |
-0.07539 |
0.15009 |
102.43 |
|
Singh and Solanki (2013) |
2.3286 |
-0.01023 |
0.14871 |
103.38 |
|
The proposed ( Ȳ*ReMd ) estimator |
2.3289 |
-0.00913 |
0.14779 |
104.02 |
|
Model 2: Y=a+πx+ε |
||||
|
Sample Mean (ȳ) |
0.6 |
0.00115 |
0.00947 |
100 |
|
Shabbir and Gupta (2007) |
0.6062 |
-0.00087 |
0.01076 |
88.01 |
|
Singh and Solanki (2013) |
0.5723 |
-0.00292 |
0.00939 |
100.85 |
|
The proposed ( Ȳ*ReMd ) estimator |
0.5912 |
-9e-05 |
0.00918 |
103.16 |
|
Model 3: Y=aX2+X+ε |
||||
|
Sample Mean (ȳ) |
12.6 |
0.01983 |
1.03203 |
100 |
|
Shabbir and Gupta (2007) |
12.7113 |
-0.09538 |
0.88082 |
117.17 |
|
Singh and Solanki (2013) |
12.6974 |
0.0104 |
0.79857 |
129.23 |
|
The proposed (Ȳ*ReMd ) estimator |
12.5854 |
0.00378 |
0.64547 |
159.89 |
Source: Researcher (2024)
From Table 4. 5 above, model 1 whose auxiliary variable was drawn from a Gaussian distribution, the bias and MSE of the proposed estimator (Bias=-0.00913; MSE=0.14779) was lower than the bias for Sample Mean, Shabbir and Gupta (2007), Singh and Solanki (2013) estimators (Bias=-0.01049, -0.07539, and -0.01023; MSE=0.15373, 0.15009, and 0.14871). The proposed estimator had a higher relative efficiency (RE=104.02%), as compared to Sample mean, Shabbir and Gupta (2007) estimator, Singhi and Solanki (2013) estimators whose relative efficiencies were 100%, 102.43%, and 103.38% respectively.
Further, in model 2 whose auxiliary variable was drawn from a Beta distribution, the bias and MSE of the proposed estimator (Bias=-9e-05; MSE=0.00918) was lower than the bias for Sample Mean, Shabbir and Gupta (2007), Singh and Solanki (2013) estimators (Bias=0.00115, -0.00087, and -0.00292; MSE=0.00947, 0.01076, and 0.00939). The proposed estimator had a higher relative efficiency (RE=103.16%), as compared to Sample Mean, Shabbir and Gupta (2007) estimator, Singh and Solanki (2013) estimators whose relative efficiencies were 100%, 88.01%, and 100.85% respectively.
Likewise, in model 3 whose auxiliary variable was drawn from a Gamma distribution, the bias and MSE of the proposed estimator (Bias=0.00378; MSE=0.64547) was lower than the bias for Sample Mean, Shabbir and Gupta (2007), Singh and Solanki (2013) estimators (Bias=0.01983, -0.09538, 0.0104; MSE=1.03203, 0.88082, and 0.79857). The proposed estimator also had a higher relative efficiency (RE=159.89%), as compared to Sample mean, Shabbir and Gupta (2007) estimator, Singh and Solanki (2013) estimators whose relative efficiencies were 100%, 117.17%, and 129.23% respectively.
From the third simulation described in Table 4. 3, Table 4. 6 presents the model parameters that were obtained.
Table 4. 6 Model Parameters from Population 3
|
Estimators |
Means |
Bias |
MSE |
RE |
|
Model 1: Y=aX+ε |
||||
|
Sample Mean (ȳ) |
4.5 |
0.00387 |
0.19128 |
100 |
|
Shabbir and Gupta (2007) |
4.8531 |
-0.04291 |
0.18423 |
103.83 |
|
Singh and Solanki (2013) |
4.4606 |
0.004 |
0.17241 |
110.94 |
|
The proposed ( Ȳ*ReMd estimator |
4.4987 |
0.00559 |
0.16705 |
114.5 |
|
Model 2: Y=a+πx+ε |
||||
|
Sample Mean (ȳ) |
0.524 |
-0.00518 |
0.00847 |
100 |
|
Shabbir and Gupta (2007) |
0.4732 |
-0.00434 |
0.00947 |
89.44 |
|
Singh and Solanki (2013) |
0.5147 |
-0.00727 |
0.00839 |
100.95 |
|
The proposed ( Ȳ*ReMd) estimator |
0.5167 |
-0.00492 |
0.00829 |
102.17 |
|
Model 3: Y=aX2+X+ε |
||||
|
Sample Mean (ȳ) |
4.4 |
0.1387 |
7.98266 |
100 |
|
Shabbir and Gupta (2007) |
4.2755 |
-0.34045 |
6.73 |
118.61 |
|
Singh and Solanki (2013) |
4.3381 |
0.08788 |
6.16047 |
129.58 |
|
The proposed (Ȳ*ReMd) estimator |
4.3642 |
0.04629 |
4.89781 |
162.98 |
Source: Researcher (2024)
From Table 4. 6 above, model 1 whose auxiliary variable was drawn from a Gaussian distribution, the bias of the proposed estimator (Bias=-0.00559) was lower than the bias for Shabbir and Gupta (2007) (Bias=-0.04291), but higher than those for sample mean, Singh and Solanki (2013) estimators (Bias=-0.00387, and 0.004). The proposed estimator a lower MSE value (MSE=0.16705), compared to Sample Mean, Shabbir and Gupta (2007) estimator, Singh and Solanki (2013) estimators (MSE=0.19128, 0.18423, and 0.17241). Further, the proposed estimator had a higher relative efficiency (RE=114.5%), as compared to Sample Mean, Shabbir and Gupta (2007) estimator, Singhi and Solanki (2013) estimators whose relative efficiencies were 100%, 103.83%, and 110.94% respectively.
In addition, in model 2 whose auxiliary variable was drawn from a Beta distribution, the bias and MSE of the proposed estimator (Bias=-0.00412; MSE=0.00829) was lower than the bias for Sample Mean, Shabbir and Gupta (2007), Singh and Solanki (2013) estimators (Bias=-0.00518, -0.00434, and -0.00727; MSE=0.00847, 0.00947, and 0.00839). The proposed estimator had a higher relative efficiency (RE=102.17%), as compared to Sample Mean, Shabbir and Gupta (2007) estimator, Singh and Solanki (2013) estimators whose relative efficiencies were 100%, 89.44%, and 100.95% respectively.
Furthermore, in model 3 whose auxiliary variable was drawn from a Gamma distribution, the bias and MSE of the proposed estimator (Bias=0.04629; MSE=4.89781) was lower than the bias for Sample Mean, Shabbir and Gupta (2007), Singh and Solanki (2013) estimators (Bias=0.1387, -0.34045, and 0.08788; MSE=7.98266, 6.73, and 6.16047). The proposed estimator also had a higher relative efficiency (RE=162.98%), as compared to Sample Mean, Shabbir and Gupta (2007) estimator, Singh and Solanki (2013) estimators whose relative efficiencies were 100%, 118.61%, and 129.58% respectively.
Chapter Summary
In this chapter, the simulation study aimed at assessing the performance of the modified exponential ratio estimator using two-phase sampling. The focus was on the relative efficiency of this estimator compared to Shabbir and Gupta (2007) and Singh and Solanki (2013) estimators. The study observed that the proposed modified exponential ratio estimator consistently had a higher relative efficiency compared to both Shabbir and Gupta (2007) estimator and Singhi and Solanki (2013) estimator.
SUMMARY, CONCLUSION, AND AREAS FOR FURTHER RESEARCH
Introduction
This chapter presents conclusions and areas for further research.
Conclusion
In this study, a modified exponential ratio estimator for finite population mean under two-phase sampling was derived. The efficiency of the proposed modified exponential ratio estimator for estimating the population mean under a two-phase sampling design was investigated. The estimator was compared to the Shabbir and Gupta (2007) and Singh and Solanki (2013) estimators. Through simulations and subsequent calculations, the study observed a substantial improvement in the efficiency of the proposed estimator, with a relative efficiency of as high as 162.98% compared to Shabbir and Gupta (2007), and Singh and Solanki (2013). These findings suggest that the proposed estimator was more efficient than both the Shabbir and Gupta (2007), and Singh and Solanki (2013).
While slightly fluctuating across different models, the proposed estimator maintains a commendable level of precision. These findings underscore the potential practical advantages of the proposed modified exponential ratio estimator over existing estimators, offering improved efficiency in estimating the population mean under a two-phase sampling design.
These findings suggest the potential practical applicability and advantages of the proposed modified exponential ratio estimator for population mean estimation under two-phase sampling. The results further reinforce the importance of considering alternative estimators that account for the unique characteristics of the sampling scheme.
Area for Further Research
This research assumed that the data had no missing values. However in practice sometimes missing values occur during sampling. Future study could consider estimation of finite population mean under two phase sampling using the exponential ratio estimator in the presence of missing values.
LIST OF ABBREVIATIONS AND ACRONYMS
| S | Sample proportion |
| r | Non sample proportion |
| n | Sample size |
| p | Population size |
| i | Sample element |
| j | Non sample element |
| x | Auxiliary variable |
| y | Study variable |
| f | Sampling fraction |
| ei | Error term |
| p | population size |
| MSE | Mean Square Error |
| SRSWOR | Simple Random Sampling without Replacement Scheme |
ACKNOWLEDGEMENT
I wish to sincerely thank my supervisor Dr. Christopher Ouma Onyango for consistently guiding me and offering his unlimited support and knowledge in the field of sample survey. His invaluable advice and input always kept me focused on the ultimate goal and greatly contributed in the completion of my project.
REFERENCES
- Adebola, F.B., & Adegoke N.A. (2015). A class of regression estimator with cum-dual product estimator as intercept. Global J. Sci. Frontier Res. (F)15: 48-56.
- Bouza, C. N. (2009). Ranked set sampling and randomized response procedures for estimating the mean of a sensitive quantitative character. Metrika, 70(3), 267.
- Cochran, W. G. (1940). The estimation of the yields of cereal experiments by sampling for the ratio of grain to total produce. The journal of agricultural science, 30(2), 262-275.
- Dagdoug, M., Goga, C., & Haziza, D. (2023). Model-assisted estimation through random forests in finite population sampling. Journal of the American Statistical Association, 118(542), 1234-1251.
- Dagdoug, M., Goga, C., & Haziza, D. (2023). Model-assisted estimation through random forests in finite population sampling. Journal of the American Statistical Association, 118(542), 1234-1251.
- Ekpenyong, E. J., & Enang, E. . (2015). Efficient exponential ratio estimator for estimating the population mean in simple random sampling. Hacettepe Journal of Mathematics and Statistics, 44(3), 689-705.
- El-kenawy, E. S. M., Ibrahim, A., Bailek, N., Bouchouicha, K., Hassan, M. A., Jamei, M., & Al-Ansari, N. (2022). Sunshine duration measurements and predictions in Saharan Algeria region: An improved ensemble learning approach. Theoretical and Applied Climatology, 1-17.
- Grover, L. K., & Kaur, P. (2011). An improved exponential estimator of finite population mean in simple random sampling using an auxiliary attribute. Applied mathematics and Computation, 218(7), 3093-3099.
- Gupta, S., & Shabbir, J. (2007). On the use of transformed auxiliary variables in estimating population mean by using two auxiliary variables. Journal of statistical planning and inference, 137(5), 1606-1611.
- Hanif, M., Shahbaz, M. Q., & Ahmad, Z. (2010). Some improved estimators in multiphase sampling. Pakistan Journal of Statistics, 26(1), 195-202.
- Haq, A., Khan, M., & Hussain, Z. (2017). A new estimator of finite population mean based on the dual use of the auxiliary information. Communications in Statistics-Theory and Methods, 46(9), 4425-4436.
- Hartley, H. O., & Ross, A. (1954). Unbiased ratio estimators. Nature, 174(4423), 270-271.
- Irfan, M., Javed, M., & Bhatti, S. H. (2020). Difference-Type-Exponential Estimators Based on Dual Auxiliary Information Under Simple Random Sampling. Scientia Iranica.
- Javed, M., Irfan, M., & Pang, T. (2019). Hartley-Ross type unbiased estimators of population mean using two auxiliary variables. Scientia Iranica, 26(6), 3835-3845.
- Kadilar, C. & Cingi, H. (2006). An improvement in estimating the population mean by using the correlation coefficient, Hacettepe Journal of Mathematics and Statistics 35 (1), 103-109.
- Kadilar, C., & Cingi, H. (2006). Improvement in estimating the population mean in simple random sampling. Applied Mathematics Letters, 19(1), 75-79.
- Kvam, P., Vidakovic, B., & Kim, S. J. (2022). Nonparametric statistics with applications to science and engineering with R (Vol. 1). John Wiley & Sons.
- Kvam, P., Vidakovic, B., & Kim, S. J. (2022). Nonparametric statistics with applications to science and engineering with R (Vol. 1). John Wiley & Sons.
- Loken, E., & Gelman, A. (2017). Measurement error and the replication crisis. Science, 355(6325), 584-585.
- Mugambi, N. (2023). Non-Parametric Estimator for a Finite Population total under Stratified Sampling incorporating a Hybrid of Data Reflection and Transformation Techniques (Doctoral dissertation, Meru University of Science and Technology).
- Muhammad, ., Zakari, Y., & Audu, A. (2021). An alternative class of ratio-regression-type estimator under two-phase sampling scheme. CBN Journal of Applied Statistics, 12(2), 1-26.
- Mutembei, T., Kung’u, J., & Ouma, C. (2014). Mxture Regression-Cum-Ratio Estimator Using Multi-Auxiliary Variables and Attributes in Single-Phase Sampling. Open Journal of Statistics.
- Odhiambo, L. A. (2019). Estimation of the Population Variance using a Smoothing Operator under Simple Random Sampling (Doctoral dissertation, Kenyatta University).
- Onsongo, W. M. (2018). Nonparametric Estimation of Finite Population Total (Doctoral dissertation, JKUAT-PAUSTI).
- Pal, S. K., & Singh, H. P. (2017). A class of ratio-cum-ratio-type exponential estimators for population mean with sub sampling the non-respondents.
- Sanaullah, A., Khan, H., Ali, H. A., & Singh, R. (2012). Improved exponential ratio-type estimators in survey sampling. Journal of Reliability and Statistical Studies, 119-132.
- Särndal, C. E., Swensson, B., & Wretman, J. (2003). Model assisted survey sampling. Springer Science & Business Media.
- Shabbir, J and Gupta, S. (2011). On estimating finite population mean in simple and stratified sampling, Communications in Statistics – Theory and Methods, 40, 199-212.
- Shabbir, J., Haq, A., & Gupta, S. (2014). A new difference-cum-exponential type estimator of finite population mean in simple random sampling. Revista Colombiana de Estadística, 37(1), 199-211.
- Sijtsma, K., & Emons, W. (2010). Nonparametric statistical methods. International encyclopedia of education, 3, 347-353.
- Sikov, A. (2018). A brief review of approaches to non‐ignorable non‐response. International Statistical Review, 86(3), 415-441.
- Singh, H. P., & Pal, S. K. (2015). A new chain ratio-ratio-type exponential estimator using auxiliary information in sample surveys. rn, 55, 7.
- Singh, H. P., & Solanki, R. S. (2013). Improved estimation of finite population variance using auxiliary information. Communications in Statistics-Theory and Methods, 42(15), 2718-2730.
- Singh, H. P., & Tailor, R. (2005). Estimation of finite population mean using known correlation coefficient between auxiliary characters. Statistica, 65(4), 407-418.
- Singh, H. P., & Vishwakarma, G. K. (2007). Modified exponential ratio and product estimators for finite population mean in double sampling. Austrian journal of statistics, 36(3), 217-225.
- Singh, H. P., Malviya, P., & Tailor, R. (2023). Dual to A Two-Parameter Ratio-Product-Ratio Estimator Using Auxiliary Information in Sample Surveys.
- Singh, M.P. (1967). Ratio-cum product method of estimation, Metrica, 12, 34-42.
- Singh, R., Chauhan, P., Smarandache, F., & Sawan, N. (2007). Auxiliary information and a priori values in construction of improved estimators. Infinite Study.
- Singh, R., Kumar, M., & Smarandache, F. (2008). Almost unbiased estimator for estimating population mean using known value of some population parameter (s). Pakistan Journal of Statistics and Operation Research, 63-76.
- Sisodia, B. V. S., & Dwivedi, V. K. (1981). Modified ratio estimator using coefficient of variation of auxiliary variable. Journal-Indian Society of Agricultural Statistics.
- Ståhl, G., Saarela, S., Schnell, S., Holm, S., Breidenbach, J., Healey, S. P., … & Gregoire, T. G. (2016). Use of models in large-area forest surveys: comparing model-assisted, model-based and hybrid estimation. Forest Ecosystems, 3(1), 1-11.
- Upadhyaya, L. N., & Singh, H. P. (1999). Use of transformed auxiliary variable in estimating the finite population mean. Biometrical Journal of Mathematical Methods in Biosciences, 41(5), 627-636.
- Wu, C. (1999). The effective use of complete auxiliary information from survey data. Burnaby, Canada: Simon Fraser University.
- Yasmeen, U., Noor ul Amin, M., & Hanif, M. (2016). Exponential ratio and product type estimators of finite population mean. Journal of Statistics and Management Systems, 19(1), 55-71.
APPENDICES
Appendix: Work Plan
|
Activities |
May 2022–Aug 2023 |
September 2023 |
Oct 2023-Jan 2024 |
Feb 2024 |
|
Developing draft proposal |
|
|
|
|
|
Correction of draft proposal |
|
|
|
|
|
Submission and presentation of proposal |
|
|
|
|
|
Developing the model and deriving the asymptotic properties of the estimator |
|
|
|
|
|
Carrying out simulation study |
|
|
|
|
|
Compilation of final project document |
|
|
|
|
|
Correction of draft final project document |
|
|
|
|
|
Presentation of final project |
|
|
|
|
Appendix II: Research Budget
|
ITEM |
TOTAL (KSHS) |
|
Preparation of research proposal. Printing of draft proposals. Printing of final proposal. Photocopying final proposal. Internet services |
2,500 4,500 4,500 8,000 |
|
Data collection: Collection of secondary data Researcher’s travelling expenses. |
30,000 40,000 |
|
Preparation of the project. Photocopying of project defense. Final project loose binding. Printing of corrected final project. Final project hard copy binding. Proof reading & editing Research assistants stipends-for writing code for simulation |
8,000 5,000 5,000 3,000 10,000 30,000 |
|
Typing and printing tools 1 laptop Flash disk = i2@2000 3 blank Compact Disks |
60,000 4000 150 |
|
MISCELLANEOUS |
25,000 |
|
TOTAL |
239,650 |
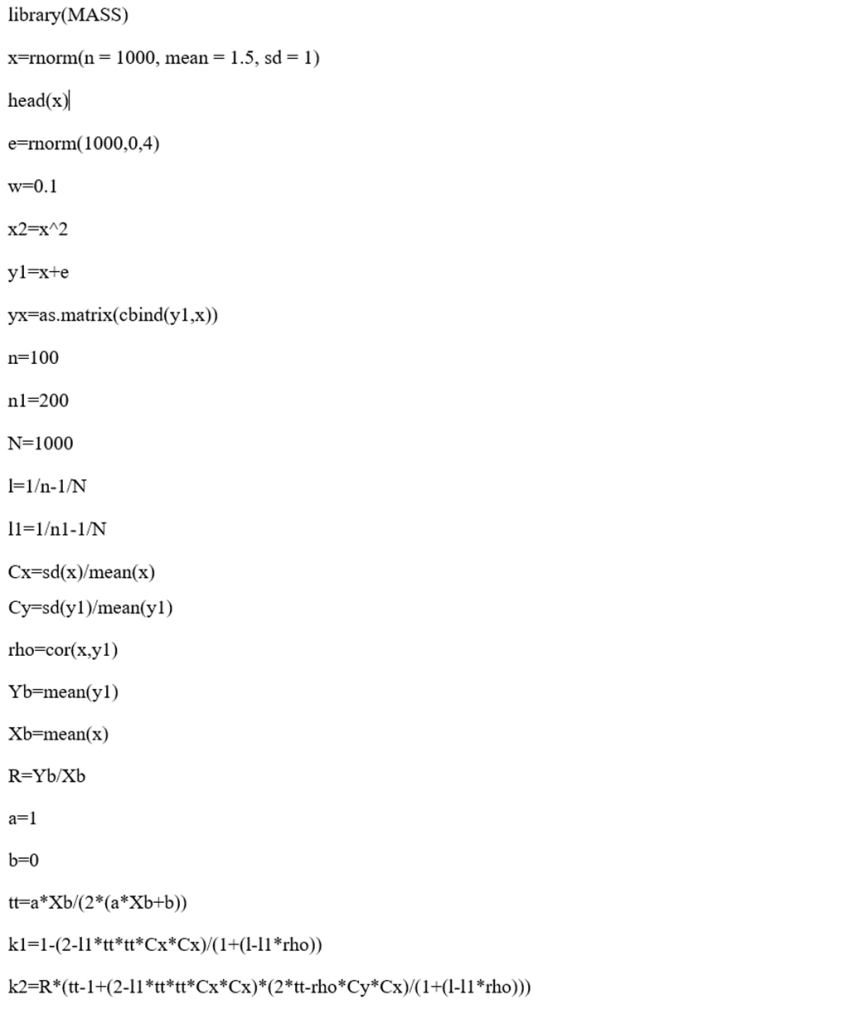
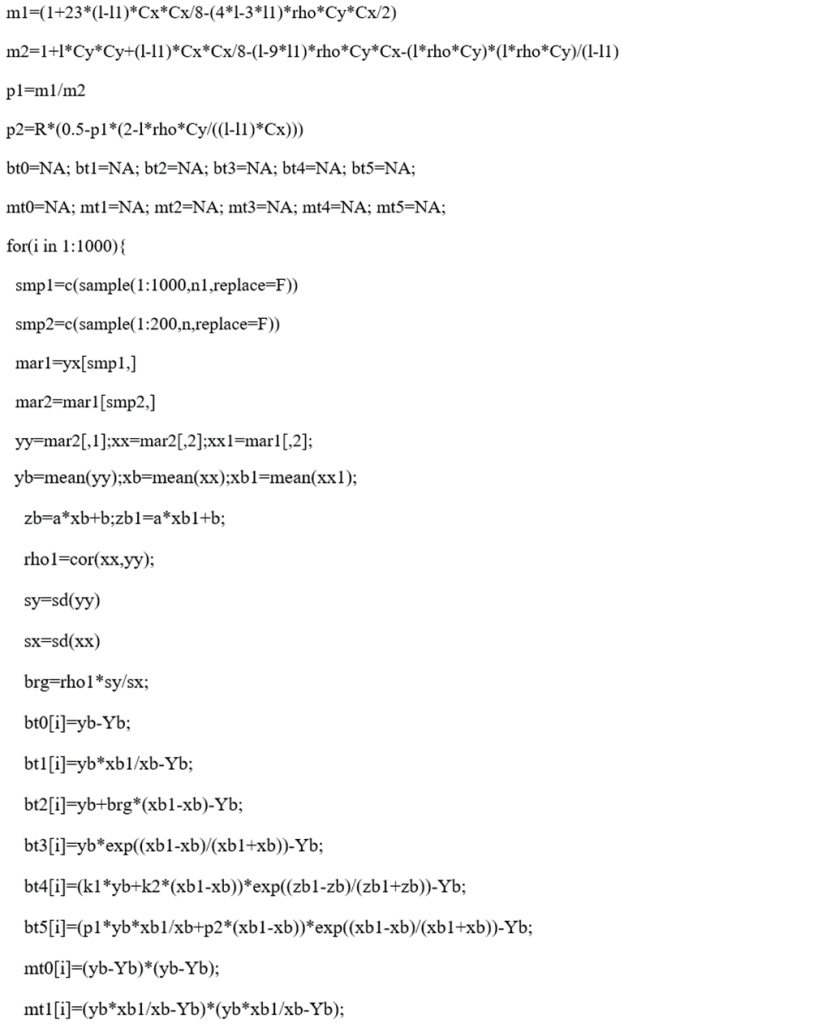
Appendix III: Simulation Codes