Mwakirunge Dumpsite – A Simmering Disaster: An Environmental Impact Assessment
- Okeyo Benards
- 63-81
- Aug 29, 2024
- Environmental Impact
Mwakirunge Dumpsite – A Simmering Disaster: An Environmental Impact Assessment
Okeyo Benards, PhD.
Pwani University, Kenya
DOI: https://doi.org/10.51584/IJRIAS.2024.908007
Received: 17 July 2024; Accepted: 24 July 2024; Published: 29 August 2024
ABSTRACT
With particulate matter tripling the acceptable levels, prohibitive carbon monoxide, higher BOD and COD levels not to mention contamination by heavy metals – leaching to adjacent lands and moving through the food chains – you need not pester anyone to take action now and not later. A true situation of Mombasa’s Mwakirunge Dumpsite.
INTRODUCTION
Mwakirunge dumpsite is the main waste garbage dump for Mombasa County. It is found along the geographical coordinates of 3° 57′ 0″ South, 39° 40′ 0″ East. It is found in Kisauni constituency, about 12 Km North of Mombasa Central Business District and about 700 meters Southeast of Colorado Shopping Centre. Currently, it is the main dumpsite particularly after the closure of Kibarani dumpsite, which has since been transformed into a recreational park.
The area generally has a topography of a rugged landscape characterized by valleys and hills. Settlements are clustered and littered over the landscape with some commercial set ups several found meters away. It is located within the coastal strip which generally experiences more than 6 hours of sunshine daily exceeding 8 hours between October and March. The rainfall pattern is bimodal with rainfall averaging between 900-1300mm annually. The long rains come between April and July while the short rains are experienced between November and December.
In terms of inhabitants – there are around 500 people living within the site, majority of whom are women and children. The main source of livelihood for these people is scavenging through the garbage to find items of sale such as plastics, bottles, pieces of metal, clothes, utensils, paraphernalia, furniture etc. Equally, they also scavenge for food – mostly in the initial stages of spoilage and laced with molds or beginning to rot. There are also some temporary structures to act as houses against the scorching sun as well as the rains. Most of those houses are not waterproof and not strongly anchored on the ground. During rainy seasons they fall and further expose them to the vagaries of weather. The road network within the dumpsite is rather haphazard and becomes extremely slippery and muddy during rainy seasons. The use of drugs especially bangi is rather common coupled with heavy drinking of the alcoholic drink ‘Mnazi’ – a local brew made from the coconut plums. It is perhaps reasonable to estimate that a good chunk of their income is spent on these two main items – mnazi and drugs. The place is littered with broken pieces of glass, myriad kind of chemicals and different kind of industrial waste of varied toxicity levels. When these enemies of nature are added to the suffocating fumes of poisonous gases and irritating soils, it qualifies as a true definition of hell, just here under our nose in Mombasa County.
Other than the life within the dumpsite, the neighborhood is a burst of life. In the Northern side lies the sprawling estate of Kiembeni – a town growing by leaps and bounds and moving fast towards the fringes of the dumpsite. On the Western side is the town of Colarado – beaming with new up-coming commercial cum residential houses – unfortunately covered by the irritating smoke coming from the dumpsite most of the times – due to the frequent flow of the wind from the North to the South. On the Western side, lies the farming villages like Mwakirunge and Marimani dotted with several schools and churches, typical Giriama villages of the coast. These areas (lying to the West) are equally affected by the effluents emanating from the dumpsite not to mention the spike in unexplained death rates (personal communication and certified by death records from local hospitals as well as death certificates attached) ostensibly arising from the pollution impacts of the dumpsite. On the Eastern side is the Indian Ocean – receiving the effluent flow.
Scope of Assignment
A group of interested parties approached us to assist unearthen the environmental consequences of the dumpsite, long seen as the epicenter of most of their ill health and loss of productivity. Upon acceptance of the task, we set to do this first; by identifying and engaging a National Environmental Management Authority (NEMA) certified laboratory to undertake samples and analyses of various parameters. We finally settled on Polucon Laboratory Services based in Mombasa. Second, we had to select parameters for analysis – these were then segregated into three, namely;
- Air quality parameters – which included Carbon Monoxide, Nitrogen Oxides, Particulate Matter, Sulphur Oxides, Hydrogen Sulphides
- Leachates – which involved elements that had percolated into the ground usually after the rains. These included pH values, Biochemical Oxygen Demand, Chemical Oxygen Demand, Lead, Copper as Cu, Chromium as Cr, Arsenic as As, Zinc as Zn, Nitrogen as N and Ammonia as NH4.
- Soils – and these were to involve analysis of Zinc as Zn, Mercury as Hg, Copper as Cu, Cadmium as Cd, Lead as Pb, Nickel as Ni, Chromium as Cr, Calorific value on Dry Matter Basis, Ash Content and Moisture Content
The findings of the analysis done on the various parameters constitutes the backbone of new presentations in this report and detailed in the subsequent pages.
Adverse air pollution
The biggest challenge of the dumpsite is the ever rising volumes of poisonous gases – spreading far and wide the vicinity of the dumpsite (see fig. 1). This spread can go as far as 5km away from the dumpsite. Both the persons within the 5km radius of the dumpsite are at acute exposure to the toxic air pollutants emanating from the dumpsite. The health risks posed to humans can be through one or a combination of the following pathways;
- Breathing contaminated air
- Drinking water contaminated by toxic air contaminants
- Ingestion of contaminated soils – usually for young children during their playing sessions and the often putting their contaminated hands or play objects in their mouths
- Making body contact with contaminated soil, dust or water
Other ways of pathways of the toxic chemicals into the human body are through;
- Eating contaminated foods and food products e.g. the fish from contaminated waters especially those
caught at the shores of the Indian Ocean visited by deposits of contaminated surface runoffs, feeding on meat, milk, eggs from animals that fed on contaminated plants, or fruits and vegetables grown in contaminated soils on which air toxics have been deposited
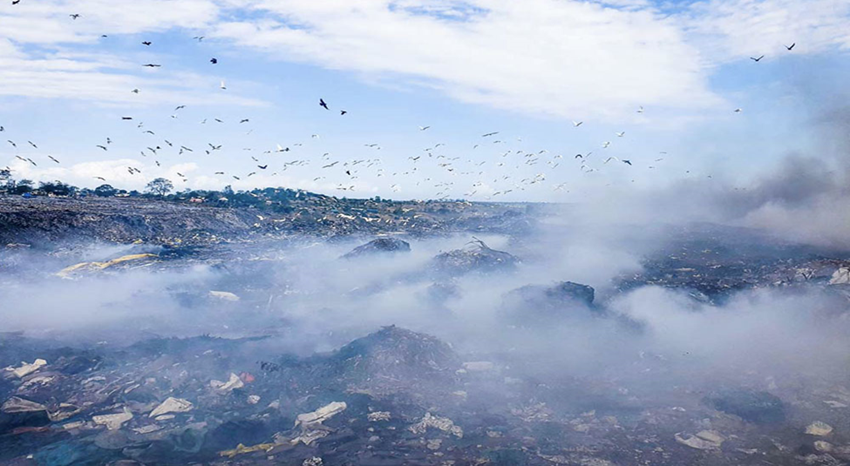
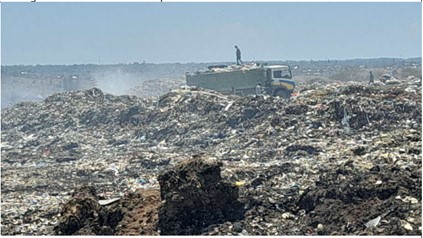
Fig. 1: the surface-ambient view of Mwakirunge during a normal day
Determination of Ambient air quality within and around the Mwakirunge dumpsite
This is necessary in order to make a determination whether the dumpsite poses an existential threat to those living within and without the dumpsite – especially those living within the 5m radius from the epicenter of the dumpsite. A study was designed to:
- to determine the ambient air quality measurements at 2 locations within the vicinity of the dumpsite and
- to correlate the findings to the Environmental Management Coordination (Air Quality Regulations 2014)
METHODOLOGY
Ambient air quality monitoring of test parameters was done for four hours at each of the selected two points. The two monitoring locations were selected methodologically to represent the conditions at receptor locations as a result of the dumpsite open burning activities. Both locations were positioned downwind in relation to the wind direction.
A short description of the monitoring positions is as shown in table 1 below:
Table 1: Description of the air quality monitoring sites
| No | Site Name | GPS Coordinates | Description | On-going activities |
| 1 | Point 1 | 3°56’26.19″S
39°40’22.58″E |
The location was situated South of the dumpsite, a few meters from the road connecting the dumpsite and Colorado shopping centre. | Burning of solid wastes at the heart of the dumpsite. Occasional dump truck movement |
| 2 | Point 2 | 3°56’21.40″S
39°40’22.05″E |
The point was located West of the dumpsite, within the settlement area of the squatters nearby. | The site was characterized by occasional truck movement to and from the dumpsite. |
It was important to take care of basic weather parameters, which are shown in table 2. Monitoring point selection was based on the size of the site and expected critical impact and operation areas maintaining at least 10 meters minimum radius between each measurement location.
Table 2: Weather characteristics of the sampling site on the sampling day
| Date | Temperature | Humidity | Wind speed/Direction |
| 03/11/2022 | 27°C | 68% | 13 km/h NE |
Monitoring locations are shown in fig. 2 below:
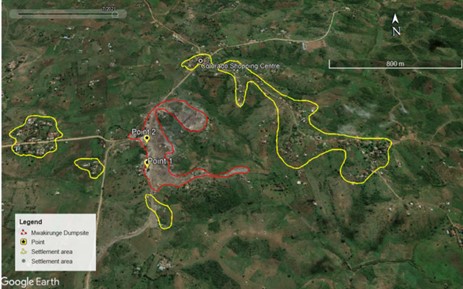
Fig. 2: Aerial photo of the monitoring sites of the Mwakirunge dumpsite
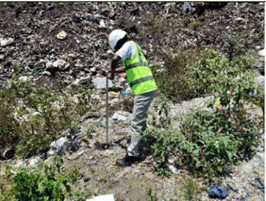
This study involved the sampling for the gaseous and particulate parameters. Ambient air quality monitoring was done by active monitoring methodology by use of a real time equipment (AQM Series). The AQM meter series, a state-of-the-art gas analyzer was used to measure the Particulate Matter (PM) and gaseous parameters levels using modern technologies (see figures 3 and 4 below).
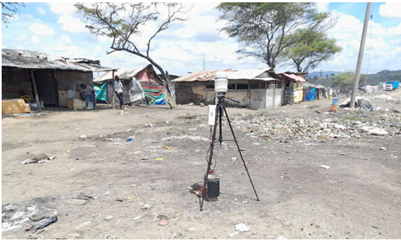
Fig. 3: Sampling for Air Quality at Point 1
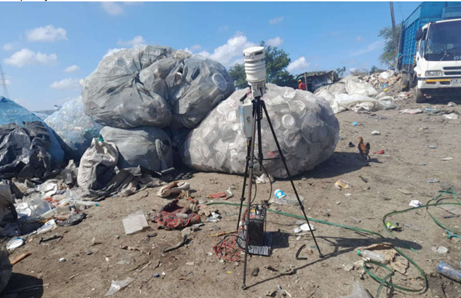
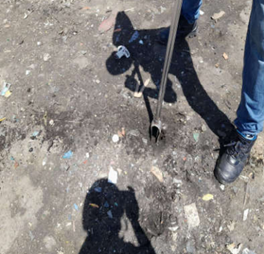
Fig. 4: Sampling for Air Quality at Point 2
Active sampling involved the use of an air sampling pump which actively pull air through a collection device such as a filter that much independent of wind speed. Dust sampler which use the laser particle sensors were used for monitoring particulate suspended matter. Air quality monitoring for gaseous and particulate parameters was done using the meter which was mounted about 1-2 meters above the ground surface.
A brief description and rationale for the air quality parameters measured
1) Nitrogen Oxides (NOx)
The oxides of nitrogen (NOX) comprise nitric oxide (NO) and Nitrogen Dioxide (NO2), which are gases produced from natural sources, motor vehicles and other fuel burning processes. Nitric oxide is colorless and is oxidized in the atmosphere to form nitrogen dioxide. Nitrogen dioxide has an odour and is an acidic and highly corrosive gas that can affect our health and environment. There are also natural sources of Nitrogen oxide gases which include volcanoes, oceans, biological decay, and lightning strikes
2) Carbon Monoxide (CO)
Carbon monoxide is a colorless, odorless, tasteless gas produced by burning gasoline, wood, propane, charcoal, or other fuel. Combustion of fossil fuel such as diesel results in the emission of Carbon Monoxide as a byproduct of combustion. CO can also be generated from combustion of solid wastes in limited oxygen supply.
3) Particulate Matter
Particulate matter refers to is small particles that are classified as PM10, PM 2.5 or PM 0.1 depending on their size. These particles have a diameter of less than 10 µm, 2.5 µm and 0.1 µm respectively; particles smaller than 0.1 µm are also called ultrafine particles (UFPs). There is a natural concentration of PM in the atmosphere that consists of marine salt or pollen, but it is enhanced by various human activities such as the burning of fuels or the handling of goods. The combustion of diesel and heavy fuel oil leads to a high amount of PM emissions. PM also develops when certain pollutants meet other substances. The smaller the particles, the worse the effect on human health. Inhalation of inhalable particulate matter pose a great health risk. These tiny particles get into the lungs and are small enough to pass through tissues and enter the blood stream. They can then trigger inflammations which eventually cause heart and lung failures. The World Health Organization estimates that long term exposure to PM2.5 is associated with an increase in the risk of cardiopulmonary mortality by 6–13% per 10 µg/m3 of PM2.5.
4) Sulphur Dioxides
Sulphur dioxide is a colorless gas with a strong choking odor. It is produced from burning of fossil fuels and smelting of mineral ores such as copper, aluminum, zinc and lead. SOx (Oxides of Sulphur) consists of a family of different chemical compounds characterized by the presence of Sulphur and Oxygen. In nature, these emissions are typically produced by volcanoes. They have harmful effects on the human body, as they stimulate nasal and throat nerves causing respiratory problems especially in asthmatic individuals. Considered local and global pollutants at the same time, SOx emissions are dangerous to health be-because they can provoke respiratory problems; moreover, SOx gases can react with oxygen in presence of NO2 resulting in sulfuric acid, which can eventually damage the environment through acid rains. SOx gases can raise the eutrophication potential and can also bring a cooling effect on the temperature and consequently to climate change.
5) Hydrogen Sulphide
Hydrogen sulfide is a colorless gas with a rotten-egg odor. Most hydrogen sulfide in the air comes from natural sources. It is produced when bacteria break down plant and animal material, often in stagnant waters with low oxygen content such as bogs and swamps.
Volcanoes, hot springs and underwater thermal vents also release hydrogen sulfide. Industrial sources of hydrogen sulfide include petroleum and natural gas extraction and refining, pulp and paper manufacturing, rayon textile production, chemical manufacturing and waste disposal.
Most of the information on human health effects from hydrogen sulfide exposure comes from accidental and industrial exposures to high levels. Exposure to high levels can cause muscle cramps, low blood pressure, slow respiration and loss of consciousness. Short-term exposure to moderate amounts of hydrogen sulfide in the workplace produces eye, nose and throat irritation, nausea, dizziness, breathing difficulties, headaches and loss of appetite and sleep.
Continued exposure can irritate the respiratory passages and can lead to a buildup of fluid in the lungs
Acceptable air quality limits: The legislative guidelines by NEMA (2014)
The Kenya Air Quality Regulations 2014 impose limit values as detailed in the SPECIAL ISSUE Kenya Gazette Supplement No.41, Legislative Supplement No.15, Legal Notice No. 34, compliance with the objectives (prevention, control, and abatement of air pollution to ensure clean and healthy ambient air) is a legal requirement in Kenya. Statutory requirements relevant to this study FIRST SCHEDULE are detailed in Table below.
FINDINGS OF AIR QUALITY
A summary of the air quality assessments of the two selected monitoring sites of Mwakirunge dumpsite are as shown below in table 3.
| Parameter | Point 1 | Point 2 | EMC (Air Quality) regulations, 2014 for residential & other areas |
| PM2.5 (μg/m3) | 282.20 | 339.20 | – |
| PM10 (μg/m3) | 301.20 | 405.20 | 100μg/Nm3 |
| CO (mg/m3) | 3.216 | 3.274 | 2.0 mg/m |
| SO2 (μg/m3) | 23.60 | 44.40 | 80 ug/m3 |
| H2S (μg/m3 | 0.033 | 0.039 | – |
| NO2 (μg/m3) | 0.062 | 0.077 | 0.5 ppm |
| Ozone (μg/m3) | 0.094 | 0.100 | 1.25 ppm |
| Temperature (0C) | 29.30 | 26.78 | – |
| Humidity (%) | 63.02 | 72.04 | – |
Graphical presentation of select parameters
The graphs below depict the results graphically in respect to the EMC (Air Quality) Regulations, 2014. Only PM10, CO have been displayed graphically since these are the two parameters that have surpassed the EMC air quality limits.
Particulate matter
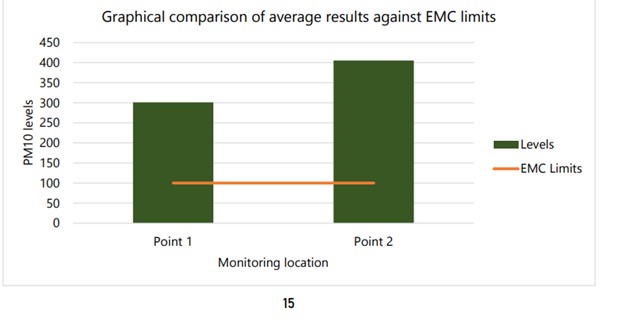
Fig. 2: Graphical comparison of Particulate Matter levels to EMC limits
As shown in figure two – the levels of particulate matter at the sampled sites are more than triple the acceptable limits.
Carbon Monoxide
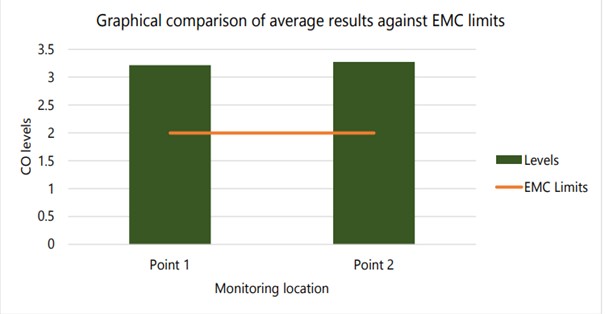
Fig. 3: Graphical comparison of CO levels against acceptable EMC limits
Results show that (figure 3) Carbon Monoxide levels at Mwakirunge Dumpsite is almost double the acceptable limits.
DISCUSSION AND CONCLUSION AIR QUALITY
Results for Particulate matter (PM10) and Carbon monoxide (CO) were relatively high and surpassed the EMC (Air quality) regulation 2014 limits. All the other studied parameters had notable concentration levels and complied with reference threshold limits.
Burning of solid wastes was ongoing at the time of monitoring. Smoke generated from these activities majorly contributed to particulate matter and CO levels recorded at both locations. Had it not been for the moderate rains experienced a day before the monitoring these values could have been much higher – indicating the inhabitable conditions of high particulate and Carbon Monoxide levels at Mwakirunge.
As mentioned earlier the inhalation of inhalable particulate matter pose a great health risk. These tiny particles get into the lungs and are small enough to pass through tissues and enter the blood stream. They can then trigger inflammations which eventually cause heart and lung failures. The World Health Organization estimates that long term exposure to PM2.5 is associated with an increase in the risk of cardiopulmonary mortality by 6–13% per 10 µg/m3 of PM2.5. Numerous scientific studies have linked fine and ultrafine particulate matter to a variety of serious health problems including premature deaths in people with heart or lung disease, heart attacks, irregular heartbeats, asthma, cardiovascular disease, decreased lung function, airway irritation, coughing and difficulty breathing
Higher levels of Carbon Monoxide can cause serious tissue damage especially when breathed in large amount for a prolonged period of time. Even in small doses, Carbon monoxide can cause headache, nausea and dizziness. Carbon monoxide poisoning occurs when carbon monoxide builds up in your bloodstream. When too much carbon monoxide is in the air, your body replaces the oxygen in your red blood cells with carbon monoxide. This can lead to serious tissue damage, or even death. It may also cause people to have irreversible brain damage or even die before anyone realizes there’s a problem.
Carbon Monoxide Risk factors
Exposure to carbon monoxide may be particularly dangerous for:
Unborn babies: Fetal blood cells take up carbon monoxide more readily than adult blood cells do. This makes unborn babies more susceptible to harm from carbon monoxide poisoning.
Children: Young children take breaths more frequently than adults do, which may make them more susceptible to carbon monoxide poisoning.
Older adults: Older people who experience carbon monoxide poisoning may be more likely to develop brain damage.
People who have chronic heart disease: People with a history of anemia and breathing problems also are more likely to get sick from exposure to carbon monoxide.
Those in whom carbon monoxide poisoning leads to unconsciousness. Loss of consciousness indicates more severe exposure.
Thus operations at Mwakirunge dumpsite are a threat to life and 3 environment.
ANALYSIS OF THE LEACHATES
This section gives a brief description the major leachates and their consequences in Mwakirunge dumpsite
Scope
Sampling of leachates from the dumpsite taken and submitted to the laboratory for analysis of pH,
Biological oxygen demand, Chemical oxygen demand, Lead, Copper, Chromium, Arsenic, Zinc,
Nitrogen and Ammonia.
Objectives
To collect and analyze samples for the specific contaminants.
Correlate the test results with the tolerance limits set in the Environmental Management and Coordination (Water Quality) Regulations 2006, third schedule legal notice no. 120, for effluent discharge to environment
Tools and Equipment
1. Sampling Tools
Sampler
GPS
Cooler Box
2. Equipment used for leachates laboratory analysis
Atomic Absorption Spectrophotometer (AAS)
BOD incubator
COD analyser
pH/EC/TDS meter
Sampling and Testing Methodology
3. Field Sampling Methodology
The International Standard ISO 5667 for representative grab sampling was adopted. Of concern were the following parts of the standard:
Part 1: Guidance on the design of sampling programmes
Part 2: Guidance on sampling techniques
Part 3: Guidance on the preservation and handling of samples
4. Testing Methodology
Sample analysis was performed by the Polucon Environmental Laboratory in Mombasa, an ISO accredited laboratory. Method of analysis for each parameter analysed is displayed in Table 2-1 below:
Table 4: Parameter and Method of analysis table
| Parameter | Method of Analysis | Units |
| Biological Oxygen Demand (BOD5) | AOAC 973.44 mg/ | mg/l |
| pH | APHA 4500H+ B | @25 0 c |
| Chemical Oxygen Demand (COD) | AOAC 973.46 | mg/l |
| Lead | APHA 3111B | mg/l |
| Copper | APHA 3111B | mg/l |
| Chromium | APHA 3111B | mg/l |
| Arsenic | AOAC 920.205As | mg/l |
| Zinc | APHA 3111B | mg/l |
| Nitrogen | APHA 4500-N | |
| Ammonia | APHA 4500 NH4 |
Sampling location
Leachates were collected at one sampling location. The location is indicated in the google map show below (figure 5)
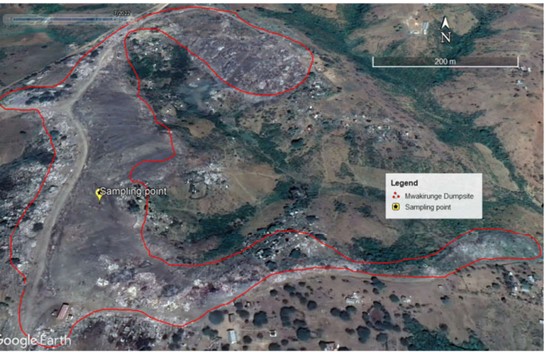
Fig. 5: Leachates sampling site at Mwakirunge dumpsite
Sampling location were as below
Table 5: Leachate sampling position at Mwakirunge Dumpsite
| Location | Type of sample | Coordinates |
| Sampling area | Grab | 3°56’24.72″S
39°40’24.30″E |
Legislation and Guidelines
The Environmental Management and Coordination Act, Water Quality Regulations, 2006/ Legal Notice No. 120 (Kenya) in the 4th Schedule, contains a monitoring guide categorized per industry. Further, the regulation contains Standards for Effluent discharge to the Environment (3rd Schedule). The Act underlines the proper management of the Kenya water resources.
Environmental Management and Coordination (Water Quality) Regulations 2006
Table 6: Standard for Effluent Discharge into the Environment
| Parameter | Units | Limits |
| mg/kg | Intervention Value | |
| Biological Oxygen Demand (BOD) | mg/kg | 30 max |
| pH | mg/kg | 6.5min – 8.5max |
| Chemical Oxygen Demand (COD) | mg/kg | 50 max |
| Lead | mg/kg | 0.1 max |
| Copper | mg/kg | 1.0max |
| Chromium | mg/kg | 2.0 max |
| Arsenic | mg/kg | 0.1 max |
| Zinc | mg/kg | 0.5 max |
| Nitrogen | Cal/g | – |
| Ammonia | % by wt | 100 max |
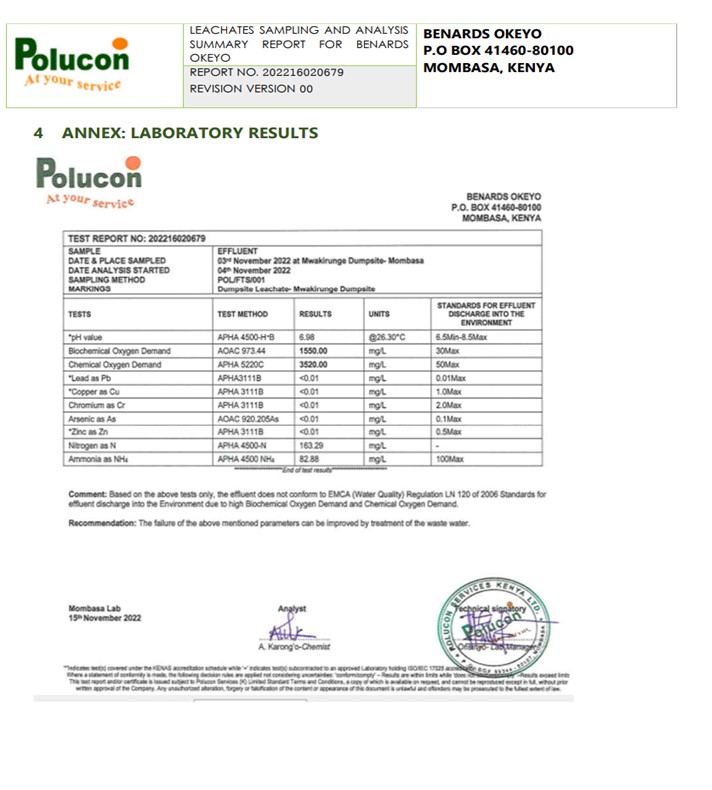
Results and Discussion for Leachates
Table 7: Summary of leachate analysis
| Parameter | Units | Dumpsite Leachate levels | Limits |
| mg/kg | Intervention Value | ||
| 11Chemicakl | mg/kg | 1150.00 | 30 max |
| pH | mg/kg | 6.98 | 6.5min – 8.5max |
| Chemical Oxygen Demand (COD) | mg/kg | 3520 | 50 max |
| Lead | mg/kg | <0.01 | 0.1 max |
| Copper | mg/kg | <0.01 | 1.0max |
| Chromium | mg/kg | <0.01 | 2.0 max |
| Arsenic | mg/kg | <0.01 | 0.1 max |
| Zinc | mg/kg | <0.01 | 0.5 max |
| Nitrogen | Cal/g | 163.29 | – |
| Ammonia | % by wt | 82.88 | 100 max |
The levels of Biological Oxygen Demand (BOD) and Chemical Oxygen Demand (COD) were notably high and surpassed the EMCA limits. Results for elemental parameters were low depicting limited contamination of the sample from metallic wastes. The levels of ammonia were relatively high but did not surpass the limits. Nitrogen on the other hand had notable levels, however, there were no set limits in the reference standard, to compare against.
The high level of BOD and COD is an indicator of massive contamination of organic and inorganic wastes, draining from the dumpsite to the surrounding environment. BOD and COD are dissolved oxygen depleting parameters. Their high concentration in a sample is an indicator of limited oxygen availability hence a significant threat to life supporting processes. Massive influx of inorganic compounds can have profound effects to floara and fauna, especially where these compounds are stable against disintegration. When assimilated, the contaminants can be biomagnified resulting into a myriad of effects to other organisms within the food chain. Results showed limited contamination of heavy metals in the sample. This however, does not rule out the presence of heavy metals at the site. Sample size should be increased in the sample size (in subsequent studies) to determine their distribution and concentration at the site.
SOIL SAMPLE ANALYSIS
Scope
Here soil grab samples were collected and submitted for analysis of moisture content, ash content, Calorific value of dry mass basis and Heavy metals (Chromium, Mercury, Nickel, lead, Cadnium, Copper and Zinc).
Objectives
To collect and analyze samples for the specific contaminants.
Correlate the test results with the tolerance limits set mentioned in the Dutch Soil (here there are still not set standards by NEMA, hence they were compared to the Dutch Standards Remediation Circular of 2013).
Tools and Equipment
5. Sampling Tools
Soil Sampler
GPS
Cooler Box
6. Equipment used for Soil laboratory analysis
Atomic Absorption Spectrophotometer (AAS)
Digestion Block
Scrubber
Fume hood
Sampling and Testing Methodology
7. Field Sampling Methodology
The top soil was scrapped using a shovel to eliminate undesired particles from being part of the sample. The soil sampler (Soil auger) was drilled into the ground to about 0.3m and used to collect grab samples into clean sampling bags. Sampling bags were clearly labeled then transported to the laboratory in a cooler box for analysis. Collected samples were in the custody of the field technician until the samples were relinquished to another party (sample receiving) for registration. Special care was taken not to contaminate samples.
8. Soil Testing Methodology
A homogeneous sample were dried, grounded digested and analyzed for the heavy metals concentrations in the samples by plasma atomic emission spectrometry. Moisture content in soil samples were determined gravimetrically and results expressed as a percentage of sample weight.
Sampling Location
Subsurface soil samples were collected from 2 points and used to make one homogenous sample. Sampling locations are shown in the map below (figure 6):
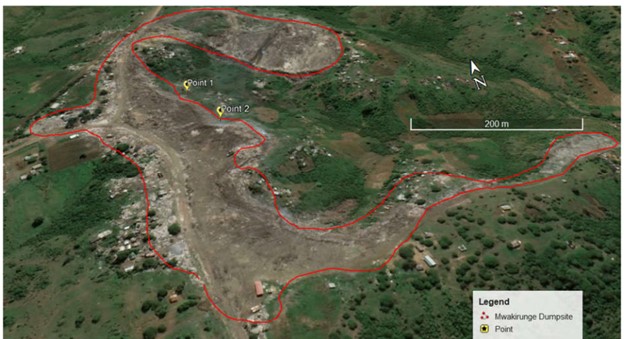
Fig. 6: Soil sampling sites at Mwakirunge Dumpsite
Table 8: Sampling locations
| Label | Type of sample | Coordinates | Pictorials |
| Point 1 | Grab | 3°56’17.82″S
39°40’24.49″E |
 |
| Point 2 | Grab | 3°56’20.27″S
39°40’25.27″E |
 |
Legislation & Guidelines
Kenya is yet to formulate the guideline limits for soil monitoring and therefore the Dutch Target and Intervention Values as detailed in the Dutch Soil Remediation Circular of 2013 was adopted (Table 9). These guidelines are the baseline values below which pollutants are assumed not to affect the natural properties of soil and ecological interactions. The guidelines are expected to guide in determining the appropriate mitigation measures for remedying soil contamination from anthropogenic activities.
Table 9: Standards excerpt from the Dutch Soil standards
| Parameter | Units | Soil/Sediment (mg/kg) dry matter |
| mg/kg | Intervention Value | |
| Zinc | mg/kg | 720 |
| Nickel | mg/kg | 100 |
| Mercury | mg/kg | 4 |
| Chromium | mg/kg | 78 |
| Lead | mg/kg | 530 |
| Arsenic | mg/kg | 76 |
| Cadmium | mg/kg | 13 |
| Copper | mg/kg | 190 |
| Calorific value on dry matter basis | Cal/g | – |
| Ash content | % by weight | – |
| Moisture content | % by weight | – |
RESULTS AND DISCUSSION OF THE SOIL SAMPLES
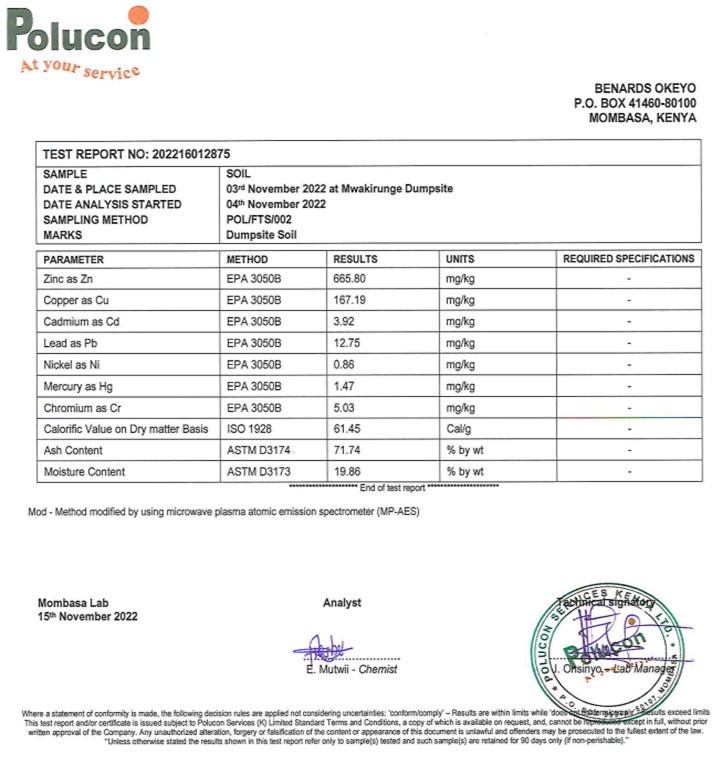
Table 10: Summary of results from the analyses of the soil samples from Mwakirunge Dumpsite
| Parameter | Units | Dumpsite Values | Soil/Sediment (mg/kg) dry matter |
| mg/kg | Intervention Value | ||
| Zinc | mg/kg | 665.80 | 720 |
| Nickel | mg/kg | 0.86 | 100 |
| Mercury | mg/kg | 1.47 | 4 |
| Chromium | mg/kg | 1.56 | 78 |
| Lead | mg/kg | 5.03 | 530 |
| Cadmium | mg/kg | 3.92 | 13 |
| Copper | mg/kg | 167.92 | 190 |
| Calorific value on dry matter basis | Cal/g | 61.45 | – |
| Ash content | % by weight | 71.74 | – |
| Moisture content | % by weight | 19.86 | – |
Test results were compared against the relevant standards to determine compliance. The levels of Zinc, mercury and copper were notably high in the tested sample. These levels however did not surpass the Dutch remediation limits set to protect the edaphic properties from pollution emanating from anthropogenic activities. Amount of ash in the sample was relatively high however, the standard does provide reference limits to compare against. The results of ash content further show that ash (majorly incombustible inorganic compounds) is easily drained from the dumpsite to soils around the settlement areas.
Potential sources of heavy metals at the site included metallic wastes as well as other hazardous materials dumped at the site. The moisture content results were also, relatively low indicating that the soil aggregates and colloids were generally dry. This could be as a result of influx of compounds which have drying effects to soil particles.
Since the grab samples were collected on the fringes of the dumpsite i.e. along the boundary of the dumpsite and the neighboring human settlement, the results show evidence of accumulation of contaminants from the dumpsite to soils at the nearby receptors. Heavy metals such us Mercury, Zinc and Copper can be absorbed into farm crops which when ingested by humans and other animals, can bio-accumulate and also be biomagnified along the food chain. Based on the analysis results, contaminants which leach into soil of the dumpsite have the potential to harm edaphic chemical, physical and biological properties and the environment at large.
SUMMARY OF KEY FINDINGS
| Environmental dimension | Key findings | Implications |
| Air Quality | Particulate Matter (PM 10) for the two sites were 301.20 and 405.20 μg/Nm3 exceeding the acceptable limit of 100μg/Nm3 by far. Carbon monoxide levels were: 3.216 and 3.274μg/Nm3 for the two sites – exceeding the acceptable limits of 2.0 mg/m3 higher than acceptable levels
Nm3 (Normal cubic meter) refers to gas volume occupied at normal temperature and pressures which are 0 deg c and 14.7 psia. Am3 refers to gas volume at actual operating conditions of the process. Use P1xV1/T1 = P2xV2/T2 for the conversion. μg – microgram |
Particulate matter, the order PM10, can travel long distances by wind. They are tiny enough to get into lungs, body tissues and even blood stream. Have the potential to trigger inflammations causing eventual heart and lung failure. At low doses, they have been linked with heart attacks, irregular heartbeats, asthma, cardiovascular diseases, decreased lung function, airway irritation, coughing, and difficulty in breathing among others. The effects are much more pronounced in babies, expectant mothers as well as older or immune compromised persons.
There were also exceeding levels of carbon monoxide – CO is when breathed for a prolonged period of time can result in serious tissue damage and eventual death. In small doses it can cause headache, nausea and dizziness |
| Leachates | Biological Oxygen Demand (BOD) levels were 1150.00mg/kg way far beyond the acceptable level of 30max.
Chemical Oxygen Demand (COD) levels were 3520 mg/kg again almost six times higher than the acceptable limit of 50 max. Other parameters like Ammonia was equally high but below limits. |
The high levels of BOD and COD is an indicator of massive contamination of organic and inorganic wastes draining from the dumpsite to the neighboring areas – draining dissolved oxygen hence a big threat to life supporting processes and with profound effects to flora and fauna. Those organic and inorganic substances causing high levels of BOD and COD, can be assimilated and bio-magnified resulting into different negative effects to other organisms and affecting food chains reaching human populations. |
| Soils | Levels of Zinc (665.80 mg/kg), Mercury (1.47mg/kg), Copper (167.92mg/kg), Ash content (71.74% if total dry weight) were higher albeit not past the limits – the Dutch remediation limits since our NEMA does not have set limits still. | Since the grab samples were collected on the fringes of the dumpsite i.e. along the boundary of the dumpsite and the neighboring human settlement, the results show evidence of accumulation of contaminants from the dumpsite to soils at the nearby receptors. Heavy metals such us Mercury, Zinc and Copper can be absorbed into farm crops which when ingested by humans and other animals, can bio-accumulate and also be biomagnified along the food chain.
Based on the analysis results, contaminants which leach into soil of the dumpsite have the potential to harm edaphic chemical, physical and biological properties and the environment at large. |
REFERENCES
- Dutch Soil remediation Circular 2013, Version of 1st July 2013.
- Methods of Plant, Soil and Water analysis: Manual for West Asia and North Africa region, ICARDA 3rd Edition
- The Environmental Management and Coordination Act, Water Quality Regulations, 2006/ Legal Notice No. 120
ANNEXES
Annex 1: Leachates Laboratory Analysis Report
Annex 2: Soils Laboratory Analysis Report
Annex 3: Equipment calibration certificate
