Implementation of Random Forest Classifier for Financial Distress Prediction in Technology Sector Companies on the Indonesia Stock Exchange
- Netania Pangalinan
- Muhammad Rakib
- Muhammad Ashdaq
- 135-144
- Aug 31, 2024
- Accounting and Finance
Implementation of Random Forest Classifier for Financial Distress Prediction in Technology Sector Companies on the Indonesia Stock Exchange
Netania Pangalinan, Muhammad Rakib*, Muhammad Ashdaq
Universitas Negeri Makassar, Indonesia
*Corresponding Author
DOI: https://doi.org/10.51584/IJRIAS.2024.908012
Received: 25 July 2024; Accepted: 30 July 2024; Published: 31 August 2024
ABSTRACT
Using the Random Forest Classifier algorithm, this study produces a financial crisis prediction model for technology companies listed on the Indonesia Stock Exchange. Historical financial statement data of eight technology companies were analyzed to generate financial indicators as prediction inputs. The results show that this model has an accuracy of 88%, with an increase in accuracy to 92% after resampling techniques. Important financial indicators used include liquidity, profitability, activity and leverage ratios. This research provides an effective predictive tool to identify companies at risk of financial distress, assisting financial management and investment decision-making.
Keywords: Financial Distress, Random Forest Classifier, Financial Prediction, Technology Company, Indonesia Stock Exchange
INTRODUCTION
The performance of the stock market can be affected by a country’s overall economy. When the value of the rupiah weakens against the US dollar, this usually has a negative impact on the stock market. This encourages foreign investors to sell. All businesses can experience a financial crisis, especially when the country’s economy is in crisis (Cahya et al., 2016) The instability experienced by the stock market due to rising inflation and economic uncertainty led to a decline in companies’
earnings and, consequently, a decline in the value of their shares. The technology sector on the Indonesia Stock Exchange (IDX) will undergo major changes by 2023. A number of external and internal factors, such as government policies, the global economic situation, individual business performance and market perceptions, influence price movements in the industry. This can be reflected in the data displayed by the Jakarta Composite Index (JCI) which is the main stock market index on the Indonesia Stock Exchange (IDX), reflecting the average performance of the listed stocks on the exchange as follows.
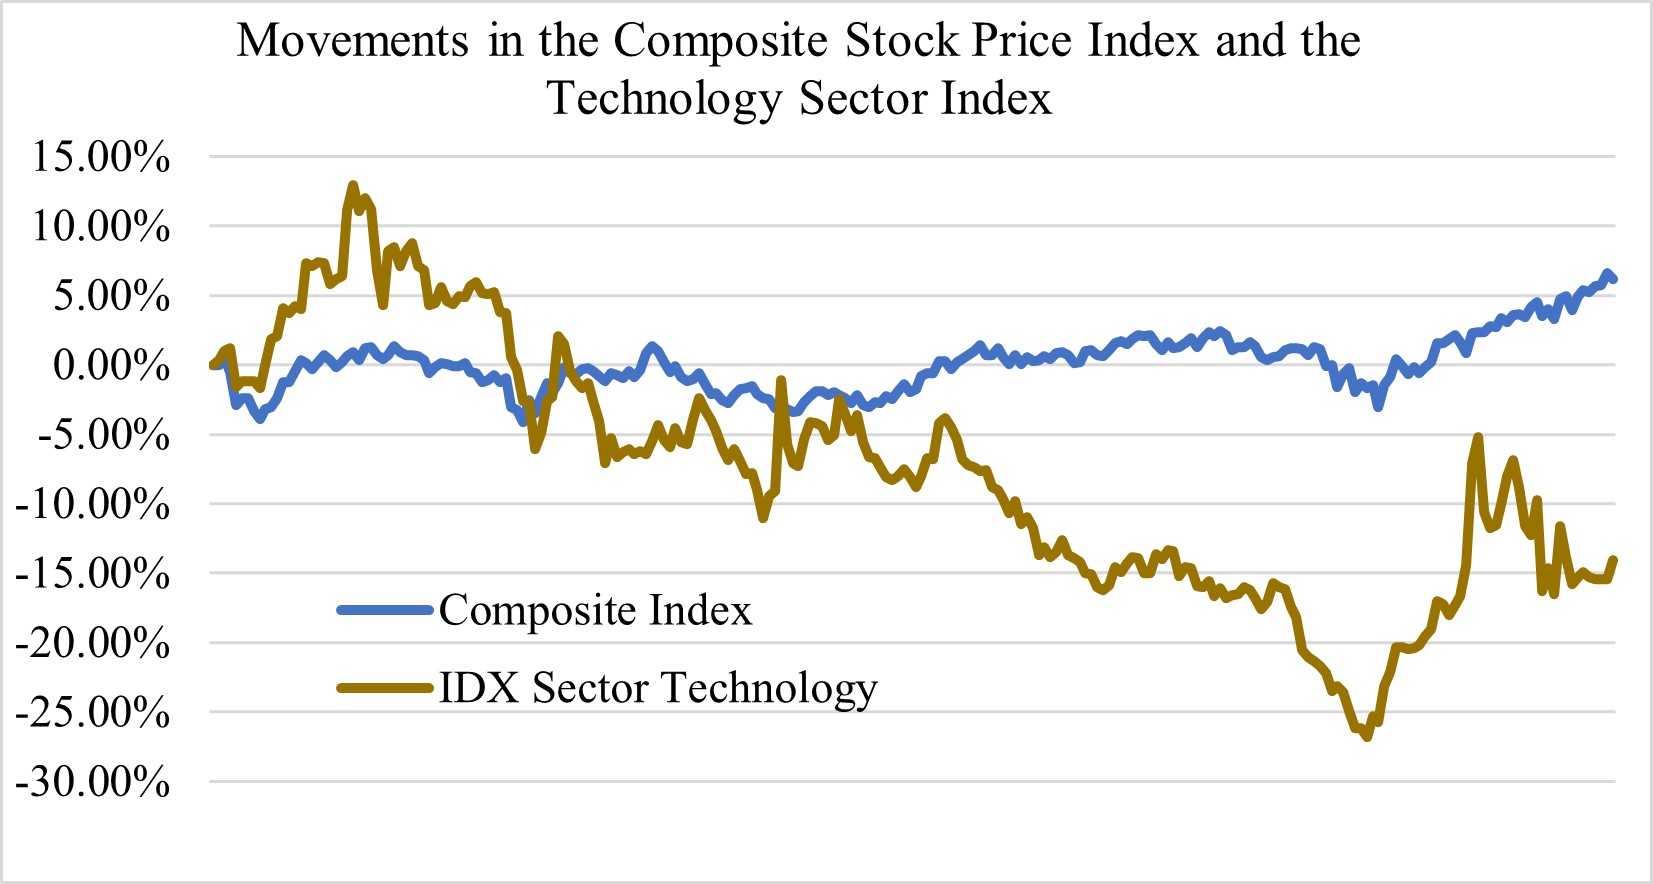
Image 1: JCI Technology Sector Index Movement December 2022 – 2023
Source: Data processed by researchers, 2024
Technology sector companies play an important role in the modern economy by providing essential products and services to society (Rakib M et al., 2022). Financial distress can be identified when companies experience negative performance in terms of operating profit, net profit, and book equity value. In addition, engaging in merger activity can also be a potential indicator of financial distress. In such a situation, the company may face difficulties in fulfilling financial obligations to related parties such as banks, vendors, and other third parties (Sumani, 2020).
Analyzing the financial ratio factors that affect the risk of corporate bankruptcy is one of the effective preventive measures. Financial ratio analysis is used by internal and external parties of companies to assess their financial performance over a period of time. It is also used to assess the likelihood of financial crisis or bankruptcy. One of the main focuses in financial ratio analysis is to determine the condition of the company’s operational and financial difficulties. This shows a close relationship between financial ratios and financial distress prediction.
Financial ratio analysis shows the financial state of the company and compares the relationship between the accounts in the financial statements. Since there is a strong relationship between the numerator and denominator, the interpretation of financial ratios is very important. Not all ratios have a significant effect on the likelihood of financial distress, so when you use financial ratios to predict financial distress, you must consider indicators that are relevant to the factors that cause financial distress (Jenny. P. Assaji, 2019)
According to Salehi et al. (2016) as cited by Nurdini (2018) that the prediction of financial distress has been a crucial research focus since the 1960s, by dividing into two periods. The focus of the first period uses statistical methods, while the second period uses non-linear techniques (Nurmayanti, 2022). . Along with the development of science, researchers began to use machine learning-based techniques, one of which is the Random Forest Classifier. The analysis method using machine learning has the advantage of being able to take into account many financial ratios to improve understanding of the factors that affect financial distress (Rifanda et al., 2023).
The purpose of this study is to predict companies in both financial distress and non-financial distress. Financial ratio analysis is used as an indicator, and machine learning models are used to evaluate success. The study of how to predict corporate financial problems is important. Timely and accurate predictions are critical because they affect the growth of the company and various stakeholders such as management, employees, shareholders, creditors, suppliers, clients, government, general economy, and capital market structure (Yi Jiang, 2019). Random Forest is a machine learning algorithm used to predict numerical values based on several related financial ratio indicators.
LITERATURE REVIEW
A. Financial Performance
According to Jumingan (2006), financial performance shows how good a company’s finances are during a certain time. This performance is usually measured by metrics such as efficiency, profitability, leverage, capital adequacy, and liquidity (Richmayati, 2022). In general, the financial performance of a company reflects a good or bad financial condition and can show the company’s achievements in a certain period as measured by various financial performance indicators (Seto et al., 2023).
B. Financial Distress
This rapid development and intense competition forces entrepreneurs to work harder to remain competitive. Companies are required to implement various strategies in order to maintain the sustainability of their business (Rakib M et al., 2022). According to Plat & Plat (2002), Financial Distress is a situation in which a company faces significant financial difficulties before bankruptcy or liquidation, and faces difficulties meeting its financial obligations, especially short-term liquid obligations(Platt & Platt, 2002). If the business shows poor performance in terms of operating profit, net profit, and book equity value, as well as conducting mergers, financial difficulties or financial difficulties can be identified as experiencing financial distress (Lukman, 2023).
C. Financial Ratio
In the context of management principles, it is important to carry out activities to obtain and use funds optimally and efficiently (Rakib M et al., 2023). This is directly related to the use of financial ratios as a tool to measure the Company’s financial health. Hery (2018) says that financial ratios are a ratio calculation carried out using financial reports, which are used to assess financial conditions and business performance (Nurhana, 2023).
D. Machine Learning
Arthur Samuel (1959) said that machine learning is a field that studies algorithms that allow computers to learn from data without writing special code (Ibnu Daqiqil, 2021). In general, Machine Learning can be explained as the ability of computers to learn from experience without requiring explicit programming. Mitchel (1997), in addition to Samuel, provides a clear definition of Machine Learning. For him, Machine Learning is a computer program that acquires knowledge from experience (Experience, E) related to a task (Task, T), and measures performance improvement (Performance Measure, P)
RESEARCH METHODS
A. Type of Research
This research uses a quantitative approach, which asserts that the study adheres to scientific principles including the existence of concrete/empirical, objective, measurable, rational, and systematic elements (Balaka, 2022). In this study, researchers used a quantitative approach to predict financial distress which involves steps such as collecting historical financial statement data from various companies, designing a statistical or mathematical model to find patterns or trends that indicate the likelihood of financial failure, and testing the model using separate data to assess how accurate it is.
B. Research Procedures
This stage consists of three (3) steps including: 1) determining data collection techniques; 2) determining research subjects; and 3) research instruments.
1. Determination of data collection techniques. One of the main characteristics and strengths of case studies is the utilisation of various sources and techniques for collecting data. The data collection technique used is secondary data. Secondary data is data that is not directly obtained but obtained through other intermediaries such as documents, reports, records, published or unpublished evidence. In this study, data was obtained from the official IDX website to obtain quarterly financial reports of technology companies in the quarter 2020 – Quarter I 2024 listed on the exchange. After the financial statement data is obtained, the next step is to perform financial ratios which include, liquidity, profitability, activity and solvency ratios. The purpose of using financial ratio reports is to evaluate the company’s financial performance, stability and efficiency. It aims to provide an overview of various aspects of the company’s business and financial activities.
2. Determination of the research subject. This includes one of the strengths of case studies, namely the utilization of various sources and data collection techniques. The sampling technique in this study uses a purposive approach. The companies that became research subjects were companies in the technology sector that issued financial reports from the quarter of 2020 to the first quarter of 2024. This criterion was chosen because the focus of the research is the implementation of the Random Forest algorithm to predict poor financial conditions, and complete financial data is needed to develop and test the model.
3. Research Instruments: In the context of secondary data collection techniques for research on the implementation of the Random Forest algorithm in predicting financial distress in technology sector companies on the Indonesia Stock Exchange, several tools and techniques can be used to access, collect, and analyse data. The following are some of the tools used
- Official website of the Indonesia Stock Exchange (IDX): download quarterly financial reports of companies listed on the IDX.
- Spreadsheet: serves to store, clean, summarize financial data from quarterly reports and analyze financial ratios
- Python: Used for further data analysis and building models with the Random Forest algorithm.
- Google Collaboratory: a cloud-based platform that allows users to write and run Python code through a web browser
C. Data Analysis Technique
- Data Collection and Preprocessing: At this stage, data is collected manually from the IDX website and stored in Microsoft Excel format files. Next, data preprocessing is carried out to ensure that the data does not contain unusual values (outliers) and there are no empty values.
- Descriptive Statistics: Descriptive statistical analysis to summarize and describe financial ratio data. This includes calculating statistics such as mean, standard deviation and minimum and maximum values.
- Classification with the Random Forest algorithm: This algorithm is a classifier that generates multiple decision trees to extend the notion of decision trees. This method first randomly selects a sample of data to form a set of characteristics that make up each decision tree. Then, the model error rate is calculated from each of these decision trees. Next, various decision trees are compared to find the combination of indicators that results in the best classification method. Among the existing classification algorithms, Random Forest (RF) is known to have high accuracy. This model is effective in handling missing data, and its accuracy rate remains high even if there is a large amount of missing data.
- Accuracy and Model Evaluation: Evaluate the model with confusion matrix visualization to find accuracy, precision, recall, and f1-score. Calculating the accuracy of machine learning models in prediction can be done directly through the method run or indirectly.
RESULTS AND DISCUSSION
A. Research Results
This research is expected to make a significant contribution to the field of financial management by providing a reliable predictive tool to identify companies at risk of financial distress, thus enabling more effective preventive action. effective preventive action. This research utilises secondary data sources derived from the official website www.idx.co.id as the main foundation.
1. Determination of Financial Distress Label with Springate Z-score method
Before dividing the data into 80% training and 20% testing parts, the Springate Score method serves as a marker or indicator to assign labels to the data. The results of the Springate Z score calculation for determining the financial distress label are shown in the following table
Table 1 Values on labelled data with Springate formula
| Company Name | Year | Quarterly | Financial Distress |
| PT. Bukalapak.com Tbk. | 2021 | Q2 | -0,75 |
| PT. Bukalapak.com Tbk. | 2021 | Q3 | 0,3 |
| PT. Bukalapak.com Tbk. | 2021 | Q4 | 0,39 |
| …. | …. | …. | …. |
| PT. NFC Indonesia Tbk. | 2024 | Q1 | 0,76 |
Source: Data processed by researchers 2024
The table above shows the classification results based on the threshold of the Springate Score. If the score obtained is 0.862, it is categorised as FD or 1. If the score obtained is 0.862, it is categorised as Non-Financial Distress or 0. Of the total 121 quarters, there are 51 quarters that are classified as experiencing Financial Distress and 70 other quarters are classified as Non-Financial Distress.
Table 2 Classification results based on Springate Score threshold
| Company | Year | Quarterly | S-Score (Z) | Target |
| PT. Bukalapak.com Tbk. | 2021 | Q2 | -0,75 | 1 |
| PT. Bukalapak.com Tbk. | 2021 | Q3 | 0,3 | 1 |
| …. | …. | …. | …. | …. |
| PT. NFC Indonesia Tbk | 2024 | Q4 | 0,76 | 1 |
Source: Data processed by researchers 2024
Sumber: Data diolah Peneliti, 2024
The table above shows the classification results based on the threshold of the Springate Score. If the score obtained is \le 0.862, it is categorised as FD or 1. If the score obtained is \geq 0.862, it is categorized as Non-Financial Distress or 0. Of the total 121 quarters, there are 51 quarters that are classified as experiencing Financial Distress and 70 other quarters are classified as Non-Financial Distress.
2. Data Distribution
Understanding this distribution is crucial as it significantly affects the performance of the applied machine learning algorithm. This can be reflected in the distribution of both the original dataset and the dataset after re-sampling.
a. Original dataset label distribution
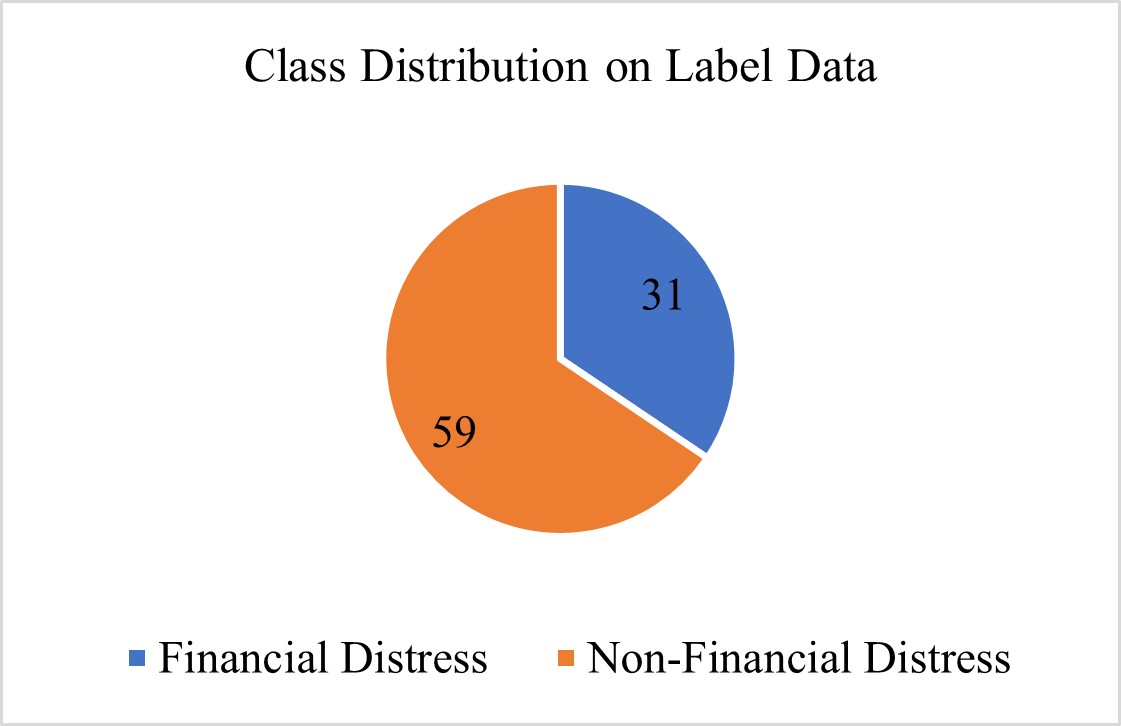
Image 2 Distribution of original class distress
Source: Data a processed by researchers, 2024
The imbalance of class distribution between financially and non-financially stressed samples is shown in the figure above. From a total of 96 data, only 31 data (about 32.29%) belong to the financial distress category, while 65 data (about 67.71%) belong to the non-financial distress category. This imbalance may cause the prediction model to be more likely to predict the majority class (non-financial distress), ignoring the minority class (financial distress). As a result, while the model may show high overall accuracy, its ability to detect financial distress could be quite limited.
b. Class Distribution after re-sampling
In general, to handle the data imbalance, it can be optimized at the data level using the re-sampling technique, which is to resample the data. The following figure shows the data distribution after re-sampling with the undersampling technique The figure above shows the balanced class distribution after re-sampling with Random Under-Sampling (RUS).
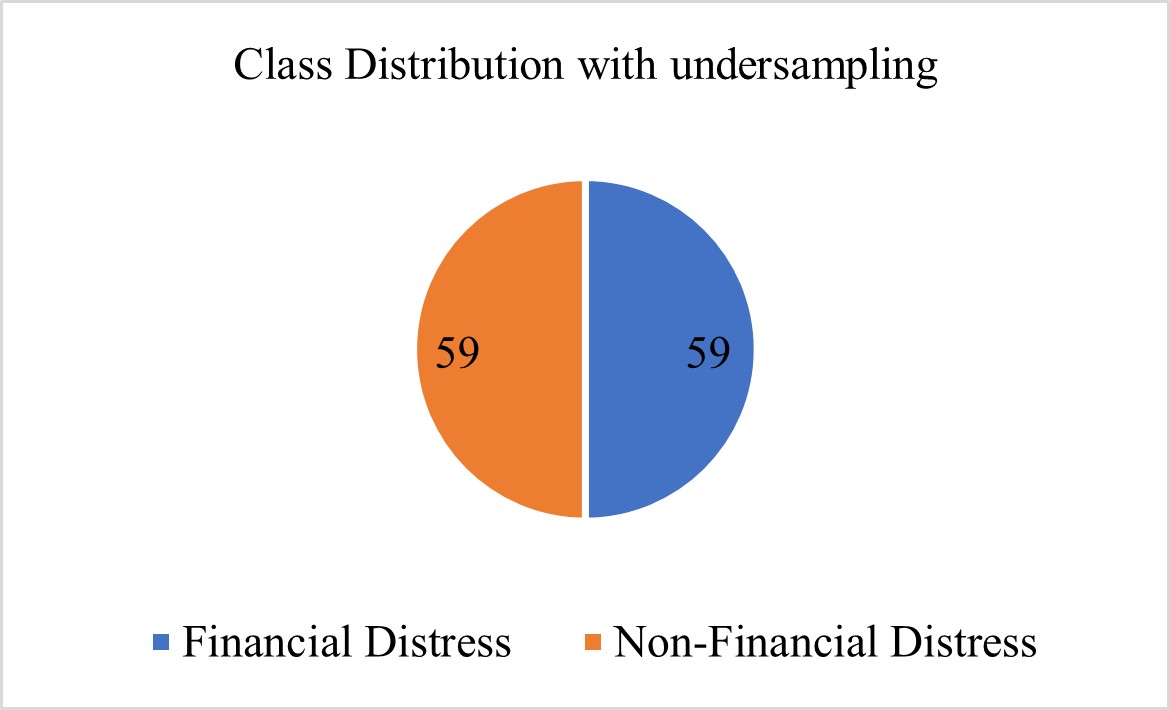
Image 3 Class distribution with undersampling
Source: Data processed by researchers, 2024
Randomly removes objects from the majority target (in this case, target 0) until their number equals the number of objects in the minority target (target 1). In this case, 30 objects are removed from target 0. After re-sampling, the dataset is balanced. Target 0 and target 1 have 5 objects each.
3. Dataset Splitting
After retesting with the undersampling technique (RUS), the class distribution becomes the same, i.e. the amount of data is divided by 50% for each instructional data class. The comparison of data before and after retesting with the RUS technique is shown in the following table.
Table 3 Division of train dataset after re-sampling
| Label (y) | Row data | Row data with RUS |
| 0 | 59 | 59 |
| 1 | 37 | 59 |
| Total | 96 rows | 118 rows |
Source: Data processed by researchers, 2024
After Random Under Sampling (RUS), the proportion of data was balanced with label 0 and label 1 at 50% each, resulting in a total of 118 rows of data, with 59 rows of data for each label. This technique is used to reduce the amount of data from the dominant label (label 0) to match the amount of data from the minority label (label 1)
4. Modelling with Random Forest
a) Prediction of testing data
Table 4 Prediction of testing data (y_test)
| Label (y) | y_test (actual) | y_pred | y_pred_under |
| 0 | 11 | 10 | 9 |
| 1 | 14 | 15 | 16 |
| Total | 25 rows data Testing | ||
Source: Data processed by researchers, 2024
The table above shows the results of testing the prediction model using 25 rows of test data. The label (y) column contains the actual values of the labels used for testing. The y_test (Actual) column reflects the actual value of the test data used to validate the model. The y_pred column contains the predicted value generated by the model, while the y_pred_under column shows the predicted value after further adjustment. For example, in the first row, the actual value is 11, while the model predicts a value of 10, and after adjustment it becomes 9, and in the second row, the actual value is 14, while the model predicts a value of 15, and after adjustment it becomes 16. These results show how close the model’s prediction is to the actual value and how effective the adjustment is to improve the prediction.
b) Model Accuracy
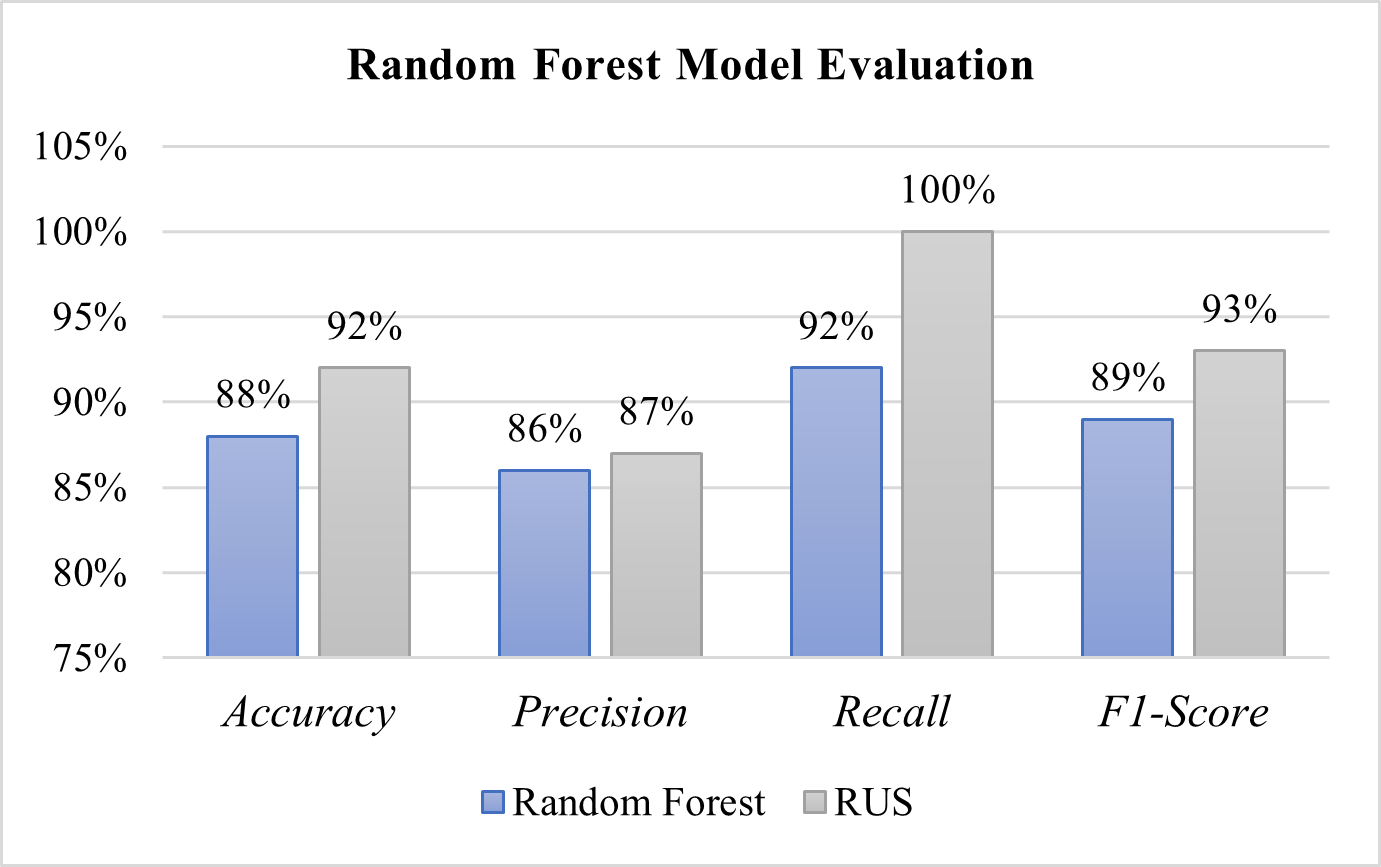
Image 4 Model Accuracy Comparison
Source: Data processed by researchers, 2024
The figure above shows that while Random Forest performs consistently, the use of re-sampling techniques such as RUS can improve the model’s ability to handle class data imbalance more effectively in the context of this study.
c) Prediction accuracy with confusion matrix
The confusion matrix will reflect the performance of the model after applying the RUS technique, which has the highest evaluation performance with an accuracy of 92%. Thus, the research focuses on the results of this technique to get the most accurate picture of the model’s ability to classify the condition of the company based on the level of financial health. The following are the prediction accuracy results after using the Random Forest model with the RUS technique
Table 5 Confusion Matrix of RUS technique
| Condition | Actual Positive (1) | Actual Negative (0) |
| Prediction Labels (+) | 14 | 2 |
| Prediction Labels (-) | 0 | 9 |
Source: Data processed by researchers, 2024
The table above displays the results of prediction accuracy with confusion matrix with Random Under-Sampling (RUS) technique, which shows the highest evaluation results in the context of this study. This can be reflected in the following explanation.
- True Positives (TP): The model successfully identified 14 cases that actually experienced Financial Distress (1) correctly.
- False Positives (FP): There are 2 cases where the model incorrectly predicts that the company is in Financial Distress (1), when in fact it is not in Non-Financial Distress (0).
- True Negatives (TN): The model correctly predicts in 9 cases that the company is in Non-Financial Distress (0).
- False Negatives (FN): There are no cases where the model incorrectly predicts that the company is in Non-Financial Distress (0) when it should be in Financial Distress (1).
d) Feature Importance Ranking of Predictor Variables
Table 6 Significant Results of Importance Features
| Feature | Importance |
| Working Capital Turnover | 19.21% |
| Receivable Turnover | 19.01% |
| Return on Asset | 15.71% |
| Net Profit Margin | 15.05% |
| Current Ratio | 10.45% |
| Cash Ratio | 8,48% |
| Debt to Asset Ratio | 5.58% |
| Debt to Equity Ratio | 6.51% |
Source: Data processed by researchers, 2024
The table above shows the results of evaluating the significance of various features in predicting a company’s financial condition based on their contribution to the model, measured in percentage. The most influential feature in predicting a company’s financial condition is Working Capital Turnover, which contributes 19.21% to the model. Followed by Receivable Turnover with a contribution of 19.01%, and Return on Asset with 15.71%. These features significantly affect the model’s ability to identify and predict the financial condition of companies from the analyzed data. Furthermore, Net Profit Margin and Current Ratio also have significant contributions, at 15.05% and 10.45% respectively, showing the importance of net profit margin and current ratio in financial analysis. Debt to Asset Ratio (DAR) contributed 5.58%, while Debt to Equity Ratio (DER) contributed 6.51%.
B. Discussion
Discussion of the Implementation of Random Forest Classifier for Financial Distress Prediction in Technology Sector Companies on the Indonesia Stock Exchange is described as follows:
1. Financial Distress
Financial distress is the stage of financial decline experienced by a company before bankruptcy or liquidation. Signs of financial distress include poor performance in operating profit, net profit, and book equity value, as well as merger activity. This study analyses how financial ratios can assess a company’s financial performance and identifies ratios that are significant in the prediction of financial distress.
2. Financial Ratio
Financial ratios are tools to evaluate various aspects of a company’s operations, monitor financial health, and identify the risk of financial distress. Liquidity ratios (Current Ratio, Cash Ratio) provide insight into a company’s ability to meet short-term debt. Bukalapak.com Tbk., with a high Current Ratio, indicates strong financial stability, while DCI Indonesia Tbk. with a low Current Ratio in 2023 indicates potential financial problems. Profitability ratios (Return on Assets (ROA), Net Profit Margin (NPM)) measure a company’s efficiency in generating profits. Bukalapak.com Tbk. shows significant variations in ROA and NPM, reflecting challenges in achieving consistent profitability. DCI Indonesia Tbk. shows consistency with stable and increasing ROA and NPM, reflecting efficiency in asset utilization. Activity ratios (Working Capital Turnover (WCTO), Receivable Turnover) evaluate the efficiency of a company’s asset management. MCAS Integration Tbk. stood out with the best activity in these two ratios in 2023, showing high efficiency in managing working capital and receivables.
3. Random Forest Model
Random Forest model is used to analyze financial ratios by assessing the importance feature of each ratio. The results show that Working Capital Turnover (WCTO) has the greatest influence with an importance value of 19.21%, followed by Receivable Turnover with a value of 19.01%. These ratios show the importance of working capital and receivable management in reducing the risk of financial distress. Return on Asset (ROA) with an importance value of 15.71% and Net Profit Margin (NPM) with 15.05% show that company profitability is also an important factor in predicting financial distress
CONCLUSIONS AND SUGGESTIONS
A. Conclusion
Based on this research, financial ratios such as liquidity, solvency, profitability, and activity are proven to have a significant influence in predicting a company’s financial distress. Through the Random Forest algorithm, these ratios provide deep insights into a company’s financial performance, helping companies to be more proactive in managing their financial health. In addition, these findings also provide early indicators for investors to make better investment decisions, mitigating possible risks.
The results show that the financial distress prediction model using Random Forest algorithm is able to provide accurate and reliable results. This algorithm successfully reduces the risk of overfitting and improves prediction accuracy by combining multiple decision trees. Thus, it is expected that this model can be used by companies to identify potential financial problems early and take the necessary precautions to overcome or prevent financial distress.
B. Suggestions
Based on the results of the research that has been carried out, it can be concluded that these findings are not only useful for companies in managing their financial health, but can also help investors in making better investment decisions by providing early indicators of potential financial problems in the analyzed companies. In addition, although liquidity, solvency, profitability, and activity ratios have been proven to have a significant influence, this study also suggests exploring other factors that may contribute to the financial health condition of the company. For future research, it is recommended to use feature permutation after performing feature importance to gain deeper insight into the influence of each feature in the prediction model. This feature permutation will help identify interactions between various financial ratios and other factors, thus improving the accuracy and reliability of the model in predicting financial distress
REFERENCES
- Balaka, M. Y. (2022). Metodolgi Penelitian kuantitatif. In I. Ahmaddien (Ed.), Widina Bhakti Persada Bandung. Widina Bhakti Persada Bandung.
- Cahya, L. M., Daru, A., & Andrian, D. (2016). Aplikasi Data Mining dengan Metode Support Vector Machine ( SVM ) untuk Prediksi Financial Distress pada Industri Jasa Go Public yang Terdaftar di Bursa Efek Indonesia. Seminar Nasional Inovasi Dan Aplikasi Teknologi Di Industri (Seniati), 81–86.
- Ibnu Daqiqil. (2021). Machine Learning : Teori, Studi Kasus dan Implementasi Menggunakan Python (1st ed.). UR Press.
- Jenny. P. Assaji, Z. M. (2019). Rasio Keuangan dan Prediksi Financial Distress. Jurnal Penelitan Ekonomi Dan Bisnis, 2(2), 58–67.
- Lukman, I. (2023). Menyingkap Misteri Pasar Keuangan dan Keberhasilan Bisnis. Deepublish.
- Nurhana. (2023). Analisis Rasio Keuangan sebagai Salah Satu Alat Ukur Kinerja Keuangan. CV. Ruang Tentor.
- Nurmayanti, A. (2022). Prediksi Financial Distress Perusahaan Pertambangan Batubara di Bursa Efek Indonesia menggunakan Support Vector Machine, K-Nearest Neighbor dan Naive Bayes Classifier. Jurnal Mitra Manajemen, 5(10), 718–735.
- Platt, H. D., & Platt, M. B. (2002). Predicting Corporate Financial Distress: Reflections on Choice-based Sample Bias. Journal of Economics and Finance, 26(2), 184–199.
- Rakib M, H. T., Nuraisyiah, Abdussamad, Z. K., Jubaidi, A. S. U. F., Hayati, A. I., Kango, U., & Sudjiman. (2022). Pengantar Etika Bisnis (Tahta Media (ed.)). Tahta Media Group.
- Rakib M, Isma, A., Rahman, V., Hasdiansa, I. W., & Nugraha, M. E. S. (2023). Technopreneurship (T. Media (ed.)). Tahta Media Group.
- Richmayati, M. (2022). Good Corporate Governance, Corporate Social Responsibility Dan Kinerja Keuangan. CV. AZKA PUSTAKA.
- Rifanda, A., Yuwandhani, P., & Rizal, N. A. (2023). Analisis Rasio Keuangan Untuk Memprediksi Financial Distress Menggunakan Support Vector Machine Financial Ratio For Predicting Financial Distress Using Support Vector Machine. 10(2), 633.
- Seto, A. A., Latif, I. N., Sari, O. H., Mareta, S., Susiang, M. I. N., Indrawati, A., & Purwatmini, N. (2023). Manajemen Keuangan dan Bisnis (Teori dan Implementasi). PT. Sonpedia Publishing Indonesia.
- Sumani. (2020). Prediksi Financial Distress : Rasio Keuangan Dan Sensitivitas Makroekonomi Perusahaan Sektor Primer. EKUITAS (Jurnal Ekonomi Dan Keuangan), 3(3).
- Yi Jiang. (2019). Corporate Pistress prediction in China : a Machine Learning Approach.