Optimal Deployment of Unified Power Flow Controller on Nigerian 330 kV Grid Using Artificial Bee Colony
- Jabir, G. Bakare, G. A.
- Haruna, Y. S.
- 18-31
- Sep 5, 2023
- Physics
Optimal Deployment of Unified Power Flow Controller on Nigerian 330 kV Grid Using Artificial Bee Colony
Jabir, G. Bakare, G. A. and *Haruna, Y. S.
Department of Electrical and Electronics Engineering
Faculty of Engineering and Engineering Technology
Abubakar Tafawa Balewa University, Bauchi
*Correspondence Author
DOI: https://doi.org/10.51584/IJRIAS.2023.8803
Received: 16 July 2023; Accepted: 08 August 2023; Published: 03 September 2023
ABSTRACT
Transmission line power loss minimization and voltage profile improvement are challenging problems in modern power systems due to continuous increase in load demand. In this paper, an optimal location and sizing of unified power flow controller (UPFC) to improve the performance of the updated 54-bus 330 kV Nigerian network was presented. Here, the maximum power loss bus was identified to be the most favorable location for fixing the UPFC under different loading conditions; slightly underloaded (90%), normal loading (100%) and slightly over loaded (110%). The optimum location was determined using the artificial bee colony (ABC) algorithm. The work was implemented in MATLAB® 2021b environment and its performance was evaluated based on the simulation results obtained. The simulation results revealed that, ABC proved to be robust based on the facts that all the voltage profile that violate ± 5% tolerance margin of the nominal voltage criteria were kept within the acceptable limit after the UPFC optimal deployment. Moreover, the proposed approach also recorded significant reduction in the overall active and reactive power loss in the entire network with a minimum percentage average active power loss reduction of 45.3% under different loading conditions.
Keywords: Unified power flow controller, loading conditions, optimal deployment, power loss, voltage profile
INTRODUCTION
In the past two decades, the rapid development of power electronics has made it possible to design power electronic equipment of high rating for high voltage systems. Flexible AC transmission system (FACTS) devices have been specifically evolved for modern power systems applications. Some of the benefits of FACTS devices [1] are: added power flow control, improved power system stability, increased system reliability, added flexibility in citing new generation and eliminate or deferral of the need for new transmission lines. In addition, FACTS devices can also minimize transmission losses and secure improved voltage profile. For the avoidance of doubt, FACTS devices have not been installed in the Nigerian power system and the exploratory research work in respect of their applications to the Nigerian national grid have not attained maturity. Whilst optimal allocations of distributed FACTS devices could attract the aforementioned benefits, they lack the capability to insure generation-load balance in the sudden generation deficiencies frequently experienced in the Nigerian power system.
The operation of electric power system has become more complex due to the continuous growing demand for electricity and the interconnections of new loads. Furthermore, there are economic and environmental issues that militate against the desired expansion of modern power system to meet the demand. The consequence is that rapidly growing power systems especially in the developing countries have operated closer to their maximum power transfer capability limits, with higher probability for system insecurity and unacceptably low reliability.
Against the backdrop of these operational problems in the Nigerian grid system stated above, there is need to investigate the application of emerging technologies such as admission of FACTS devices in the Nigerian system to forestall unacceptable voltage regulation, equipment over loading and in system bus voltage profile enhancement. The increase in electric power demand, together with environmental constraints and competitive electricity markets has forced most power systems to operate closer to their thermal and stability limits.
The existing family of FACTS devices include: SVC, STATCOM, static synchronous series compensator (SSSC), TCSC, dynamic flow controller (DFC), UPFC, etc. Amongst the existing types of FACTS devices, the most versatile is UPFC because of its capability of controlling the voltage magnitude as well as real power and reactive power flows when appropriately sited in power system network. From the foregoing overview of FACTS devices, it is clear that modelling of FACTS devices is very critical in assessing their enhancement capabilities in specific power system network infrastructure of interest.
There are several ways of modeling the selected class of FACTS devices bearing in mind that the suitability of a model depends on the specific problem at hand. Some of the three basic modeling techniques are: injection model, total susceptance model and firing angle model [2]. Each FACTS device is assumed to take a fixed number of discrete values within its permissible range. The power injection model is a good model for FACTS devices because of its capability for handling the FACTS devices adequately and conveniently in the power flow computation problem [3].
Metaheuristic search techniques such as gradient projection method [4], and evolutionary programming (EP) [5], genetic algorithm (GA) [6], have been implemented for solving the OPF problem. However, the recent findings have identified some deficiencies in the GA performance. Recently, a new evolutionary computation technique, called artificial bee colony (ABC), has been proposed and introduced by Karaboga[7]. The ABC algorithm was developed based on inspecting the behaviors of real bees on finding nectar and sharing the information of food sources to the bees in their hive. The main advantages of the ABC algorithm over other optimization methods for solving optimization are; ability to handle the objective with stochastic nature [8], simplicity, high flexibility, strong robustness [9], few control parameters [10], ease of combination with other methods, fast convergence, and both exploration and exploitation [11].
This paper presents the deployment of UPFC device which minimize losses and improved voltage profile on the update 54-bus Nigerian 330 kV power system using Artificial Bee Colony optimization (ABC). The technique has also determined the optimal location and sizing of the UPFC on the network. The proposed algorithm has been tested on the updated 54-bus systems of Nigeria 330 kV power system for both normal and contingent cases.
LITERATURE REVIEW
Literature review is important in bringing the basis and current of any research. This chapter presents the brief theoretical background about FACTs devices. The review is divided into two sections: review of the fundamental concepts and a review of similar work.
2.1 Review of Fundamental Concept
Some of the basic theoretical aspects pertaining FACTS devices and the method of their deployment into the power system were described in this sub section.
2.1.1 Flexible AC Transmission Devices
Power electronics equipment developed under the name of flexible alternating current transmission system (FACTS) is very popular in last few years. FACTS device is a static equipment used for the AC transmission of electrical energy. It is meant to enhance controllability and increase power transfer capability. It is generally a power electronics-based device. There are many types of FACTS devices, such as: Static VAR compensator (SVC), Static Synchronous Compensator (STATCOM), Static Synchronous Series Compensator (SSSC), Unified Power Flow Controller (UPFC) etc. The focus of the research is on use of UPFC for loss minimization and voltage profile improvement, and is briefly discussed as follows.
2.1.2 Unified Power Flow Controller (UPFC)
Several power systems analysis and control schemes have been proposed in the literature on optimal Flexible Alternating Current Transmission (FACTS) placement in transmission network for the last three decades. Load flow analysis is one of such methods used to determine the real power, reactive power, losses, power factor, improve voltage stability, enhance voltage profile and analyze the transients introduced in the system due to occurrence of faults. The FACTS devices such as UPFC are becoming important in suppressing power system oscillations and improving system damping. The UPFC is a solid-state device, which can be used to control the active and reactive power [12]. Unified Power Flow Controller is a FACTS device used for improving power quality in power system as shown in Figure 1.
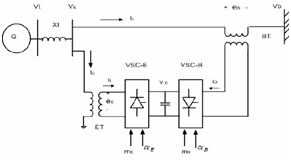
Figure 1: UPFC Based Control System [13]
The UPFC consist of combination of series converter and shunt converter. The DC terminals of shunt devices are connected to a common DC link capacitor. The shunt converter of the UPFC controls the UPFC bus voltage/shunt reactive power and the dc link capacitor voltage. In this case, the shunt converter voltage is decomposed in two components. One component is in phase and the other in quadrature with the UPFC bus voltage. Decoupled control system has been employed to achieve simultaneous control of real and reactive power flow in the transmission line. The series converter injected voltage is decomposed in to two components. One component of the series injected voltage is in quadrature and the other is in phase with the UPFC bus voltage. The quadrature injected components control the transmission line real power flow. This strategy is like that of phase shifter. The in-phase components control the transmission line reactive power flow. This strategy is like that of a tap changer.
2.2 Metaheuristic Methods
Metaheuristic technique is a solution method that orchestrate an interaction between local improvement procedures and higher-level strategies to create a process capable of escaping from local optima and performing a robust search of solution space. In the last decades many optimization techniques for Optimal Power Flow (OPF) have been presented. The main goal for all the proposed techniques in the literature is to find a better solution efficiently. Some examples of metaheuristic methods are: Ant Colony Optimization (ACO), Artificial Bee Colony Optimization (ABC), Bee Colony Optimization (BCO), Genetic Algorithm (GA), Particle Swarm Optimization (PSO), Differential Evolution (DE), Tabu Search Optimization (TSO), Simulated Annealing (SA) etc.
Many studies were dedicated to using metaheuristic optimization techniques including; genetic algorithm (GA), simulated annealing (SA) [14], particle swarm optimization (PSO) [15]. Other techniques found in the literature include bacterial foraging technique (BFA), imperial competition algorithm (ICA), moth flame optimization (MFO) etc. are commonly employed to solve power system optimization problems as they offer high-quality solutions [16], and ant colony optimization (ACO)[17].
2.2.1 Artificial Bee Colony (ABC) Algorithm
The artificial bee colony (ABC) algorithm is a swarm-based metaheuristic optimization technique, developed by inspiring foraging and dance behaviors of honeybee colonies. ABC consists of four phases named as initialization, employed bee, onlooker bee and scout bee. The employed bees try to improve their solution in employed bees phase. If an employed bee cannot improve self-solution in a certain time, it becomes a scout bee. This alteration is done in the scout bee phase. The onlooker bee phase is placed where information sharing is done. Although a candidate solution improved by onlookers is chosen among the employed bee population according to fitness values of the employed bees, neighbor of candidate solution is randomly selected [18].
ABC is a population-based optimization algorithm and tries to achieve global minimum or maximum iteratively. The termination conditions for ABC should be maximum cycle number or acceptable error value. The population in ABC hive consists of three kinds of bees; employed bees, onlooker bees and scout bee. The employed bees and onlooker bees exploit nectar sources found around the hive and the scout bee explores the solution space. In ABC algorithm, number of nectar sources around the hive equals to number of employed bees. Additionally, number of employed bee’s equals to number of onlooker bees. In a cycle, number of scout bee in ABC algorithm can be one. The ABC algorithm have four phases sequentially realized; initialization, employed bee, onlooker bee and scout bee phases. The flowchart of ABC algorithm is given Figure 2.
2.3 Review of Similar Works
Some reviews of the methods used in industries regarding voltage stability and how these developments relate to the proposed method in this research are presented here.
[20] proposed an ABC algorithm for solving optimal power flow problem. The proposed algorithm has been tested on the IEEE 30-bus, 57-bus, and 118-bus systems. The numerical results have indicated that the proposed algorithm can find high quality solution for the problem in a fast manner via the result comparisons with other methods in the literature.
[21] proposed Artificial Bee Colony Algorithm to solve reactive power / voltage control problem of the Nigerian grid system. The effectiveness of the developed tool under three different loading scenarios has been tested on standard IEEE 30 bus network and updated 54-bus Nigeria 330kV grid system modeled in MATPOWER. The goals were achieved with available generating units’ excitation systems and discrete adjustment of tap positions of on-load tap changer of transformers as well as switching of discrete doses of inductors or capacitors etc at load buses. The approach was able to procure improved voltage profile and significant power loss reduction for real time online application.
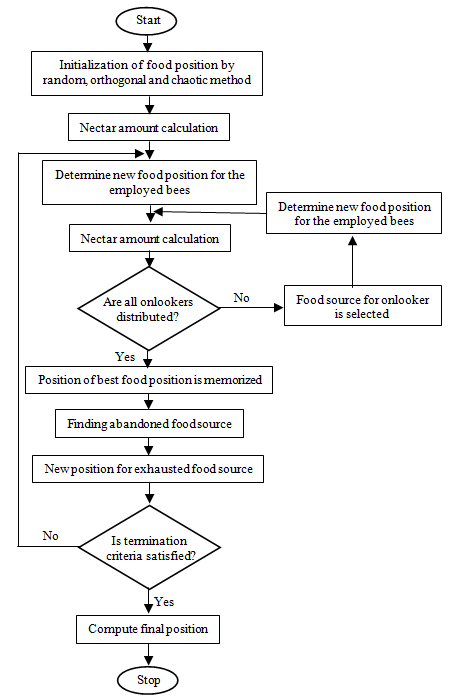
Figure 2: The Basic Flow Chart of ABC [19]
[22] applied an improved artificial bee colony for unit commitment on the Nigerian power system. The outcome of the results obtained for the Nigerian Power system applying ABC and iABC to solve the unit commitment problem during weekdays and weekends shows that iABC returned the lowest cost of N7,776,665 as compared with N9,988,767 for conventional ABC during weekdays and also that iABC returned the lowest cost of N6,770,112 as compared with N8,839, 001 for conventional ABC during weekends respectively. Therefore, the improved artificial bee colony performed better than the conventional ABC in terms of fuel cost minimization.
[23] proposed an Artificial Bee Colony based on Cauchy OBL group to compete with the traditional initial group, selects excellent individuals to form an improved initial group, and improves the quality and diversity of the population; in the neighborhood search stage, the Cauchy OBL process is added to improve the global exploration ability of the algorithm. At the same time, it speeds up the convergence speed, the global optimal solution and multi-dimensional update strategy are introduced. The simulation results show that the improved algorithm is easy to jump out of the local optimization and has higher search accuracy and faster convergence speed.
[24] performed load flow analysis on 132 kV Nigerian Grid using Artificial Bee Colony. The results of simulations revealed that the voltages and angles solved by the ABC normal and ABC gbest techniques are closely correlated i.e., not significantly different from zero, with a p-value of about 0.3033 and 0.2029 respectively with the Pearson T-test; and on the other hand, there exists no correlation between the ABC normal and ABC controlled technique corresponding to a significant distance from zero. The ABC gbest also fared better giving the least cost or power mismatch after 15,000 iterations of the load flow simulation.
[25] investigate the impact of ABC, PSO, BFO and Cuckoo optimization technique on UPFC for sustainable voltage stability. The results so obtained for tuning PSO, ABC, BFO and Cuckoo Search with UPFC device are compared to know the technique that yields the best loading parameter for Nigerian 56- bus power system for voltage stability margin enhancement. It is found that UPFC tuned with Cuckoo Search outperforms the other techniques in terms of the increased loading parameter of the Nigerian power system with margin improvement of 86.6%, 90% and 88.6% for Adiabor (Bus 45), Jalingo (Bus 34) and Jos (Bus 13). The tuned UPFC device has proved beyond reasonable doubt that it can improve voltage stability margin of the entire Nigerian 330 kV Network as envisaged from results before and after optimization
In this paper, the voltage stability improvement of the updated 54-Bus 330 kV Nigerian network is to achieve the possible placement of UPFC on the network to minimize losses and improve voltage profile using Artificial Bee colony optimization technique, this will be achieved also by developing an algorithm to suit the appropriate sizing and optimum location of the UPFC device in MATLAB/SIMULINK environment.
METHODOLOGY
The 54-Bus Updated Nigerian 330 kV grid network is characterized with major problems like voltage instability, long transmission lines and high-power losses which affect power generation and distribution systems. The Nigerian 330kV consists of 54 buses, 12 generating stations, 12 transformer taps, 15 switchable reactors and 36 transmission lines. The single line diagram of 330 kV Nigerian networks is shown in Figure 3. All data required for running the OPF of this network can be found in [21].
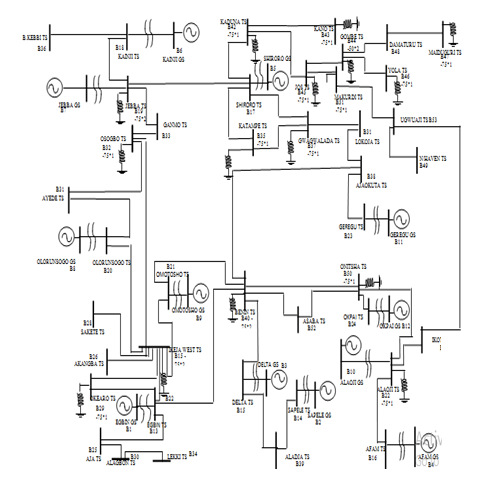
Figure 3: Updated 54-Bus Nigerian 330 kV Nigerian Network [21]
3.2.1 Problem Formulation
Optimal deployment of UPFC can be described as an optimization process with nonlinear objective function and nonlinear constraints. In general, UPFC deployment can be expressed as Eqn. (1):
Minimize F(x) …(1)
subject to g(x)=0, h(x)≤0
where, F(x) is the objective function, g(x) represents the equality constraints, h(x) represents the inequality constraints, and x is the vector of the control variables varied by a control center operator (generated active and reactive powers, generation bus voltage magnitudes, etc.).
The objective function is also subject to satisfying the load flow equations (equality constraints) without violating the inequality constraints. The usual types of inequality constraints are upper bus voltage limits at generations and load buses, lower bus voltage limits at load buses, reactive power limits at generation buses, maximum active power limits corresponding to lower limits at some generators, maximum line loading limits, and limits on tap settings. The inequality constraints of the problem include the following.
Generation Constraint: Generator voltages, real power outputs, and reactive power outputs are restricted by their upper and lower bounds as shown in Eqn. (2):
,
for i=1, 2, NG, …(2)
Security Constraint: Voltages at load bus are restricted by their upper and lower bounds as follows:
for i = 1, 2, …, NL …(3)
Where, N L is the number of load buses.
3.3 Implementation of ABC for the UPFC Deployment
There are ten main work functions required for the simulation experiment. It follows the sequence outlined below:
Step1: Initialize the population of the line power loss and voltage at all the buses.
Step 2: Generate the random number of population input voltage and the power loss.
Step 3: This step evaluates the fitness of the population.
Step 4: Set the iteration count as 1, i.e., iteration I=1.
Step 5: Repeat
Step 6: The onlooker bee attains the elite fitness function of the bus system and improve the velocity of the populations.
Step 7: Apply the selection process to find the better fitness of the new solutions and determine the probability.
Step 8: In this phase solutions which were not improved those solutions are replaced by the scout bee.
Step 9: Memorize the best solution attained so far.
Step 10: To check the iteration range, if the iteration is not attained the maximum range increase the iteration count, i = i+1 or else the process is terminated. The procedure is continued until the termination criterion is attained.
Once the above process is finished, the system is ready to produce the maximum power loss bus for the specified loading condition. Once the UPFC is placed at optimum location given by the algorithm, power loss is minimized, voltage profile is improved thus power system stability is guaranteed. The initialization parameters for the proposed ABC based method are presented in Table 1. Figure 4 shows the flowchart implemented for the optimal allocation of UPFC using ABC algorithm.
Table 1: ABC Optimal Parameter Settings
| S/N | Parameter | Value |
| 1 | Population size | 100 |
| 2 | Max. number of iterations | 200 |
| 4 | Acceleration coefficient upper bound | 1 |
RESULTS AND DISCUSSIONS
The proposed method was validated using the 54 bus 330 kV Nigerian network. Discussions on the results obtained were also presented herein.
4.2 Simulation Results
The proposed ABC algorithm method was tested on the updated 54-Bus Nigerian 330 kV power systems grid. The proposed ABC algorithm was coded in Matlab R2019a and run on an Intel Core 2 Duo CPU 2.66 GHz processor with 4.0 GB of RAM. The stopping criterion was based on the maximum number of iterations. The based case OPF of the network was run, where it revealed that bus 5 is optimal target to deploy UPFC. Figure 5 is the Simulink model of the study network.
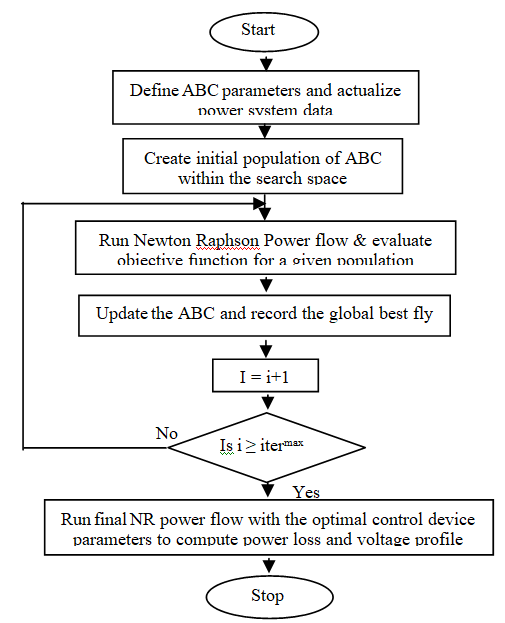
Figure 4: Flowchart of ABC Based UPFC Deployment Problem
Three distinctive operating scenarios were considered for the load flow analysis of the 30-bus and the 54-bus systems. These are as follows: Scenario 1: Under load condition (90%) with and without UPFC, Scenario 2: Normal load condition (100%) with and without UPFC and Scenario 3: Slightly load condition (110%) with and without UPFC.
Scenario 1: Under Load Condition (90% of the total demand)
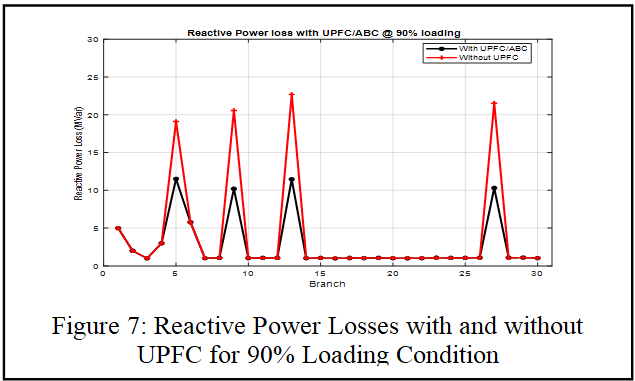
Under this scenario, 90% of the total load demand of the 330 kV Nigerian network was considered as the total demand attached to the network. Power flow analysis was performed to determine the initial steady-state condition of the network using Newton-Raphson method. Simulation results were then carried to validate the proposed method for the optimal deployment of UPFC using ABC algorithm. The results for the active and reactive power as well as the voltage magnitude before and after the optimal deployment were recorded. Figures 6 to 8 shows the simulation results for this case.
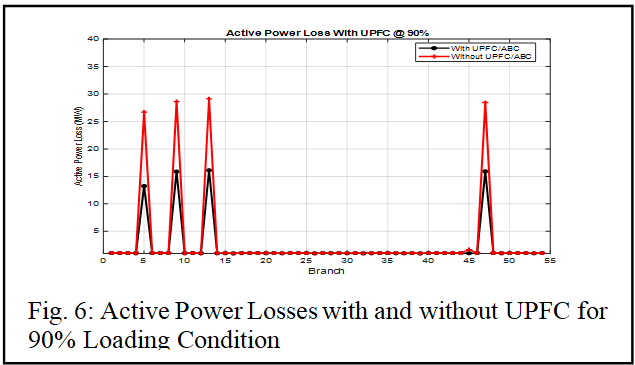
It can be observed from Figure 6 that, the total active power loss reduces from 27.8113MW to 14.3191MW before and after the optimal deployment of UPFC.
The reactive power loss obtained before the installation of the UPFC is 19.1056Mvar and after incorporating the UPFC it decreases to 11.8142Mvar. From Figure 8, it can be observed, majority of the bus voltages were moved closer to 1 pu in comparison with when UPFC was not deployed into the network.
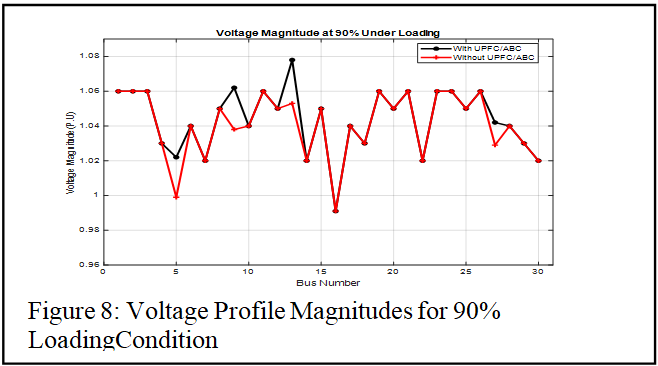
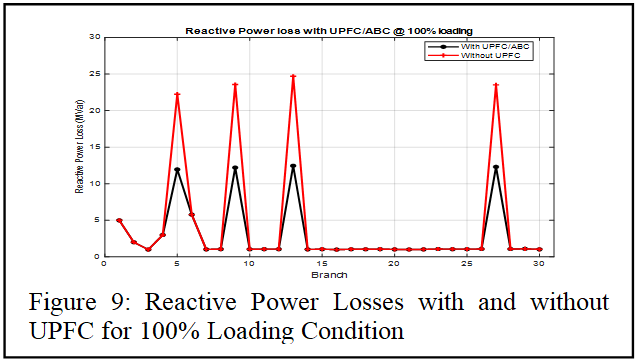
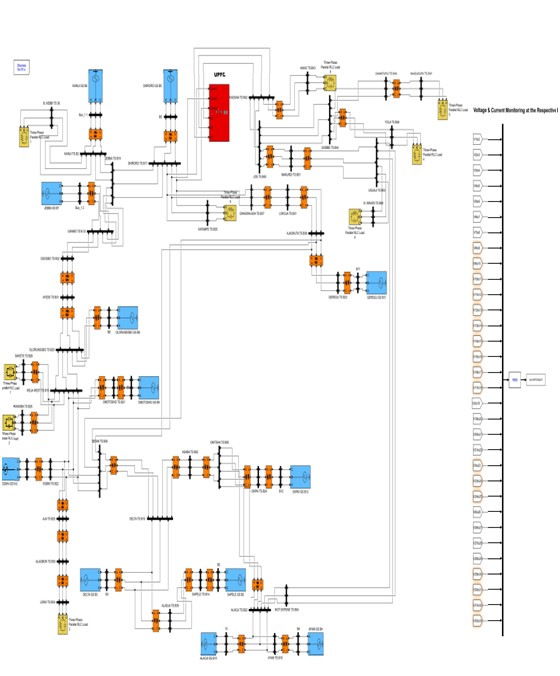
Figure 5: Simulink Model of 54- Bus Network Grid with UPFC Installed at Bus 5
Scenario-2: With Normal (100%) Load Condition
Power flow analysis was performed to evaluate the initial steady-state condition of the network using Newton-Raphson method. The simulation results for active and reactive power as well as the voltage profile with and without UPFC optimally deployed can be seen in Figures 9 to 11.Prior to UPFC installation, a total reactive power loss of 22.2447MVAr was obtained at Bus 5 as shown in Figure 9. After the optimal placement of UPFC of size 100MVAr at bus 5, it can be seen that the reactive power loss reduced from 22.2447 MVAr to 11.9532MVAr.
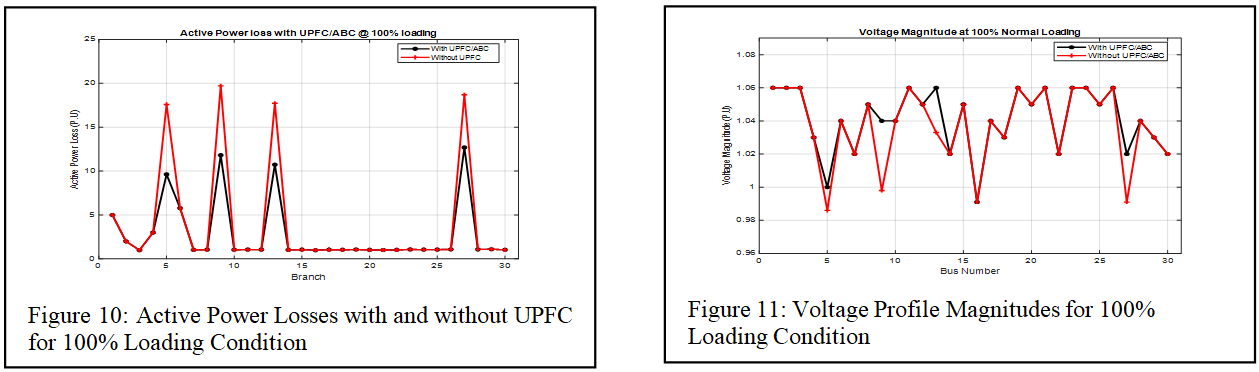
From Figure 15, it can be deduced that, the active power loss at branch 5 reduces from 18.2412 MW to 9.8317 MW after the deployment of UPFC at bus 5. Reduction in active power and before the deployment as seen in Figure 10 were also observed in other branches of the network. Figure 11 illustrates the bus voltage magnitudes for the 54-bus network system before and after the optimal deployment of UPFC at bus 5 for the normal (100%) loading condition. As can be seen, prior to the installation of the UPFC and the application of the ABC algorithm the voltage magnitude at bus 5 is 1.0 pu with the UPFC deployed. Adjustment in the voltage magnitude at some other buses were observed.
Scenario 3: With Slightly (110%) Load Condition
The power flow analysis was performed to evaluate the operating condition of the network using Newton-Raphson technique. Figures 12 to 14 shows the active and reactive power losses under slightly loading condition (110%). It is observed that, the total transmission power losses increased when compared to the base case due to increase in the power demand.
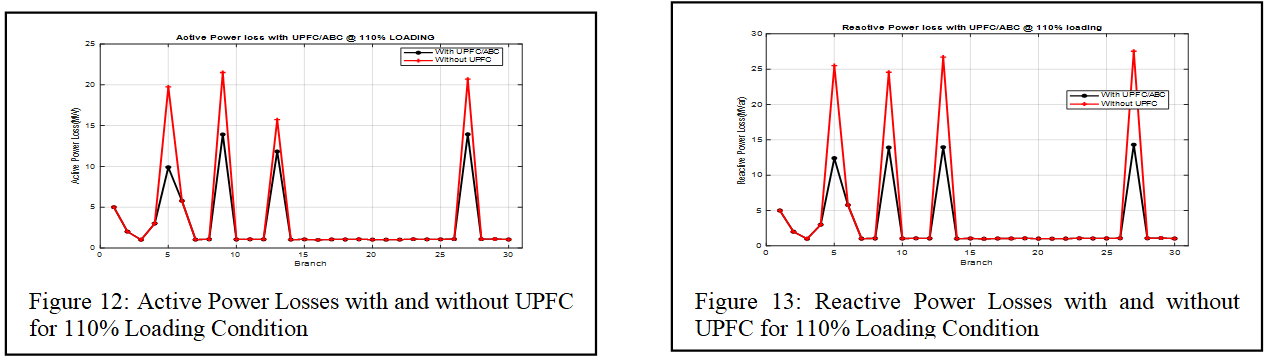
From Figure 12, it can be observed that, the active power loss obtained before and after the placement of UPFC via ABC at bus 5, in particular for branch 5 drops from is 19.7441MW to 9.8922MW. Other branches within the network experienced the reduction in active power losses. From Figure 13, it can be observed that, the reactive power loss obtained before and after the placement of UPFC via ABC at bus 5, in particular for branch 5 drops from is 25.4985 MVar to 12.4124 MVar. Other branches within the network experienced the reduction in reactive power losses.
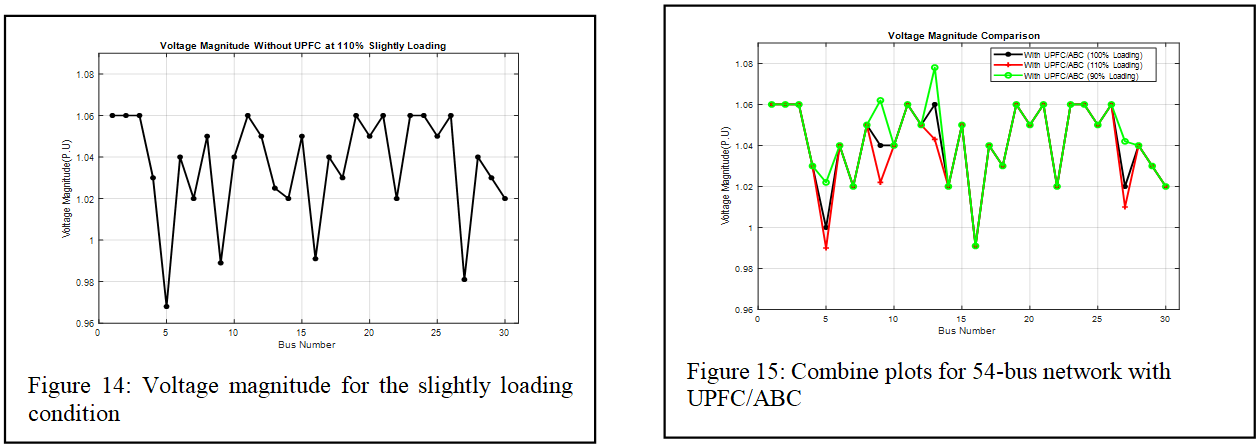
Figure 14 illustrates the bus voltage magnitudes for the 54-bus network system before and after the optimal deployment of UPFC at bus 5 for the normal (110%) loading condition. Figure 15 shows the comparative voltage profile for 90%, 100% and 110% loading conditions After the optimal deployment of UPFC at bus 5.As can be seen from Figures 14 1nd 15, prior to the installation of the UPFC and the application of the ABC algorithm the voltage magnitude at bus 5 increased from 0.97 pu to 0.985 pu as seen in Figure 15. Adjustment in the voltage magnitude at some other buses were observed.
Also, from Figure 15, it can be observed clearly that at bus 5, that the minimum bus voltage of 0.985 pu was obtained for the slightly 110% loading condition and 1.0 pu for the normal 100% loading condition, and 1.022 pu is obtained for the 90% loading. This can be concluded that, the lower the loading condition, the better voltage magnitude at the network buses. This clearly shows the effectiveness for optimally deploying UPFC using ABC on power system network.
Tables 5 and 6 shows the total active and reactive power loss for IEEE-30 Bus System and the updated 54- Bus Nigerian System.
Table 5: Total Active and Reactive Power loss for IEEE-30 Bus System
| Load condition | Active Power Loss (MW) | Reactive Power (MVar) | ||||
| Without UPFC | With UPFC | % Decrease | Without UPFC | With UPFC | % Decrease | |
| Under (90%) | 15.8113 | 9.3191 | 41.06 | 19.1056 | 11.5142 | 39.73 |
| Normal (100%) | 17.5992 | 9.6317 | 45.23 | 22.2447 | 11.9532 | 46.26 |
| Slightly (110%) | 19.7441 | 9.8922 | 49.9 | 25.4985 | 12.4124 | 51.32 |
Table 6: Total Active and Reactive Power loss for Updated 54- Bus Nigerian System
| Load condition | Active Power Loss (MW) | Reactive Power (MVar) | ||||
| Without UPFC | With UPFC | % Decrease | Without UPFC | With UPFC | % Decrease | |
| Under (90%) | 26.6944 | 15.2562 | 42.84 | 27.5333 | 17.7869 | 35.4 |
| Normal (100%) | 28.5574 | 15.756 | 44.83 | 30.5061 | 18.344 | 39.87 |
| Slightly (110%) | 31.3859 | 16.2136 | 48.34 | 32.776 | 18.6118 | 43.22 |
| Average | 28.8624 | 15.7419 | 45.34 | 30.2718 | 18.2476 | 39.5 |
From Table 6, it can be concluded that power loss increases with the percentage loading of the network, and the average percentage reduction for the active and reactive power loss for the update 54-bus 330 kV Nigerian network with Optimal deployment of UPFC are 45.34% and 39.50 % respectively. From Table 6 also, the 90% loading condition renders lower reactive power loss with a minimum of 17.7869 MVar, whereas 100% and 110% loadings render 18.3440MVar and 18.6118 MVar respectively. The average active and reactive power loss after the optimal deployment of UPFC at bus 5 were recorded as 15.7419 MW and 18.2479 MVar, which corresponds to the percentage reduction of 45.34 % and 39.50 % respectively.
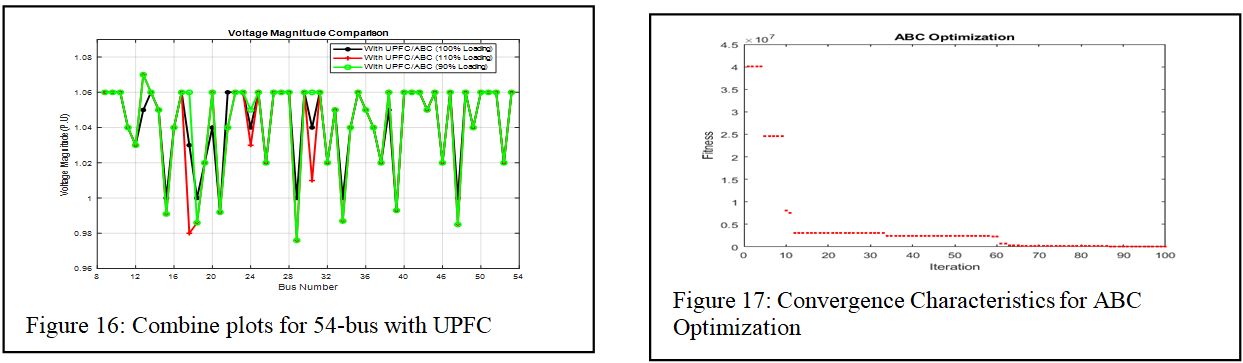
Figure 16 illustrates the voltage profile improvement for the 54-bus network rendered by the ABC optimization algorithms after UPFC deployment for different loading conditions.
From Figure 16, it is clearly seen that all bus voltages remain within the permissible limit of 0.9 pu to 1.1 pu, no violation was observed after the optimal deployment of UPFC. Figure 17 shows the overall convergence characteristics for ABC Optimization for the updated 54-bus 330 kV Nigerian network.As can be seen from Figure 17 it takes only 62 iterations for the simulation to reach the point of convergence for both the three scenarios. This signifies a stable and quick convergence with a global optimal solution for UPFC placement.
CONCLUSION
In this work, the ABC algorithm is successfully applied for solving the OPF problem. The ABC algorithm was based on the foraging behavior of honey bees for finding global solutions for optimization problems. The advantages of the proposed algorithm are robustness, fast calculation, flexibility, and few setting parameters. The proposed method was deployed into the updated 54-bus 330 kV Nigerian network. UPFC was successfully deployed in to the two networks at bus 5 each, and having a rating of 100 MVar. The simulation takes only 62 iterations for the simulation to reach the point of convergence for both the three scenarios. This signifies a stable and quick convergence with a global optimal solution for UPFC placement. From the simulation results, the following conclusions can be drawn:
- The power loss increases with the percentage loading of the network, and the average percentage reduction for the active and reactive power loss for the update 54-bus 330 kV Nigerian network with optimal deployment of UPFC are 45.34% and 39.50 % respectively.
- That all bus voltages remain within the permissible limit of 0.9 pu to 1.1 pu, no violation was observed after the optimal deployment of UPFC.
Therefore, the proposed ABC algorithm can be a favorable method for solving OPF problems in power systems.
REFERENCES
- Haruna, Y. S. Lawal, I. O., Aliyu, U. O. and Isa, A. I. (2021). “Application of an Improved Artificial BeeColony Algorithm for Unit Commitment of the Nigerian Power System.” GSJ: Volume 9, Issue 9, September 2021, Online: ISSN 2320-9186 globalscientificjournal.com.
- Chukwuka L Onita, Osazee, E. O.,Harmon, E. O. and Bright, Z. O. (2022 ). Voltage Stability Assessment of The Nigerian 330kv Transmission Network Using Artificial Neural Networks. IRE Journals | Volume 6 Issue 1 | ISSN: 2456-8880
- Padiyar, K. R. (2007). FACTS Controllers in Power Transmission and Distribution, New Age International Publishers.
- Lee, K. Y. and Park, Y. M. (1985). A unified approach to optimal real and reactive dispatch. IEEE Transactions on Power Apparatus and Systems. ;104(5):1147–1153.
- Yuryevich, J. and Wong, J. K. (1999). Evolutionary programming based optimal power flow algorithm. IEEE Transactions on Power Systems. ;14(4):1245–1250.
- Bakirtzis, A. G., Biskas, P. N., Zouma, C. E. and Petridis, V. (2002). Optimal power flow by enhanced genetic algorithm. IEEE Transactions on Power Systems. ;17(2):229–236.
- Karaboga, D. and Basturk, B. (2008). “Performance of Artificial Bee Colony (ABC) Algorithm”, Journal of Soft computing, Pages 687-697, 122.
- Suresh, D., Vaishnavai, P., NageswaraRao, B. and Ravi, K. (2018). “Artificial Bee Colony Algorithm: A Survey and Recent Applications.” International Journal of Pure and Applied Mathematics Volume 120 No. 6 2018, 313-321 ISSN: 1314-3395 (on-line version) url: http://www.acadpubl.eu/hub/ Special Issue
- Rao, R. S., Narasimham, S. V. L. and Ramalingaraju, M. (2008). Optimization of distribution network configuration for loss reduction using artificial bee colony algorithm. International Journal of Electrical Power and Energy Systems. ;1(2):116–122.
- Karaboga, D. and Akay, B. (2009). A comparative study of artificial bee colony algorithm. Applied Mathematics and Computation. ;214(1):108–132.
- Kadir, A. and Volkan, Y. (2018). “A New Method Based on Artificial Bee Colony Algorithm For The Yayın, B. (2018). Optimal Location of Shunt Connected Facts Devices.” Journal of Engineering Technology and Applied Sciences, 2018 e-ISSN: 2548-0391 Received 8 April 2018, Accepted 27 April 2018 Vol. 3, No. 1, 17-34 Published online 30 April 2018, Research Article doi: 10.30931/jetas.413552
- Vikas, G. and Khulsum, A. (2014). Simulation and Comparison of UPFC Using Matlab. National Conference on Synergetic Trends in engineering and Technology (STET-2014), International Journal of Engineering and Technical Research ISSN: 2321-0869, Special Issue
- Amarendra, A., Ravi, S. L. and Rayapudi, S. R. (2021). System security enhancement using hybrid HUA‐GPC approach under transmission line(s) and/or generator(s) outage conditions, International Journal of Numerical Modelling: Electronic Networks, Devices and Fields, 10.1002/jnm.2970, 35, 3, (2021)
- Frank, L. (2020). Optimization Techniques — Simulated Annealing: A popular method for optimizing model parameters. Towards Data Science
- 15. Bonyadi, M. R. and Michalewicz, Z. (2017). “Particle swarm optimization for single objective continuous space problems: a review”. Evolutionary Computation. 25 (1): 1–54. doi:10.1162/EVCO_r_00180. PMID 26953883. S2CID 8783143.
- Mohammad, M. R., Amin, E. B. and Ali, H. (2023). Probabilistic warm solutions-based multi-objective optimization algorithm, application in optimal design of water distribution networks, Sustainable Cities and Society, 10.1016/j.scs.2023.104424, 91, (104424), (2023).
- Liang, S., Jiao, T., Du, W. and Qu, S. (2021). An improved ant colony optimization algorithm based on context for tourism route planning. PLoS ONE 16(9): e0257317. https://doi.org/10.1371/journal.pone.0257317
- Piot N., Schweiger O., Meeus I., Yañez O., Straub L., Villamar-Bouza L., de Miranda J.R., et al. (2022). Honey bees and climate explain viral prevalence in wild bee communities on a continental scale. Rep. 2022;12:1904. doi: 10.1038/s41598-022-05603-2.
- Zhang, J. and Glezakou, V-A. (2019). The Artificial Bee Colony Algorithm for Global Optimization of Nanosized Clusters. ChemRxiv. Cambridge: Cambridge Open Engage; 2019; This content is a preprint and has not been peer-reviewed.
- Adaryani, M. R and Karami, A. (2013). Artificial bee colony algorithm for solving multi-objective optimal power flow problem. International Journal of Electrical Power & Energy Systems, Volume 53, December 2013, Pages 219-230
- Muhammad, I. B., Haruna, Y. S., Amoo, A. L.and Ibrahim, K. A (2021). Optimal Location and Sizing of Static Var Compensator on 330 kV Nigerian Power Network Using Artificial Bee Colony Algorithm. Nigerian Journal of Tropical Engineering (NJTE), ISSN: 15955397, Vol. 14(1), pp 291-301.
- Lawal, I. O., Aliyu, U. O., Haruna, Y. S. and Isa, A. L. (2021). Application of an Improved Artificial Bee Colony Algorithm for Unit Commitment of the Nigerian Power System. Global Scientific Journals. 9(9), 177-184. ISSN 2320-9186.
- Zuochen, R., Liyi, Z., Jinyan, T. and Ting, L. (2021). “Improved Artificial Bee Colony Algorithm Based on Cauchy OBL”. EEICE 2021 Journal of Physics: Conference Series 1920 (2021) 012108 IOP Publishing doi:10.1088/1742-6596/1920/1/012108.
- Okachi, S. E., Akpama, E. J., Pepple, E. C. and Acha, G. O. (2022). “Load flow analysis of 132KV Transmission System Using Artificial Bee Colony Algorithm”. International Journal of Computers http://www.iaras.org/iaras/journals/ijc
- Ndubuisi, H. I., Chinemezu, E. A. and Ibitayo, I. A. (2023). “Investigation of the impact of PSO, ABC, BFO and Cuckoo search optimization techniques on UPFC device for sustainable voltage stability margin improvement”. Journal of Electrical Systems and Inf Technol (2023) 10:27 https://doi.org/10.1186/s43067-023-00095-0 Journal of Electrical Systems and Information Technology