Determination of the Phenolic Content Levels in Freshly Prepared Juice.
- Kithure Joyce G.N.
- Abongo Deborah A
- Were David
- 68-77
- Jan 5, 2024
- Chemistry
Determination of the Phenolic Content Levels in Freshly Prepared Juice.
Kithure Joyce G.N.1, Abongo Deborah A2, Were David3
1,2,3Department of Chemistry, University of Nairobi, P.O Box 30197-00100, Nairobi, Kenya
DOI: https://doi.org/10.51584/IJRIAS.2023.81208
Received: 16 November 2023; Revised: 23 November 2023; Accepted: 27 November 2023; Published: 04 January 2024
ABSTRACT
The orange fruit is widely consumed in the world. They are used to manufacture orange juice which is commercially sold as bottled orange juice. The higher consumption of orange fruits and orange products is because it has an attractive taste, has no cholesterol, and contains potassium, carbohydrates, vitamins A and C as well as different classes of phenolic compounds that help in the protection of the human body system against free oxygen radicals. This study aimed to quantify the total phenolic acid content. The freshly prepared juice samples were obtained from three markets in Nairobi County (Ngara, Gikomba and Muthurwa). The total phenolic content (TPC) was done using the Folin-ciocalteu method. The total phenolic content of the fresh orange extract samples ranged from 129.75±0.39 mgGAE to 133.1±0.95 mgGAE, with Gikomba market having the highest levels and Ngara market had the lowest levels. It was discovered that the higher the total phenolic content the higher the percentage inhibition.
Keywords: Orange fruit, Orange juice, production, Nutritional content, Freshly prepared juice, Phenolic compounds, Nairobi county.
INTRODUCTION
Orange fruits, one of the citrus fruits originated from southern China and is now planted on a small and large scale in humid areas across the world. The common varieties of citrus fruits grown in Kenya include; Sweet oranges (Citrus sinensis), Limes (Citrus aurantifolia), Grapefruits (Citrus paradise), Lemons (Citrus lemon), and Mandarins (Citrus reticulate).
Sweet orange is known scientifically as Citrus sinensis. This is a fruit that has a small evergreen tree which grows to a height of 8-15ft [1].
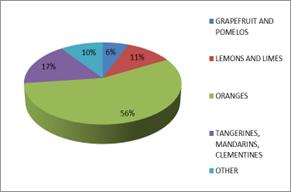
Fig 1: World Distribution of Citrus Fruits by 2010.
Source: [3] The orange fruit is delicious and very juicy which makes it one of the commonly grown fruit in the world which is estimated to be 120 million [2]. The orange fruit does well in areas that experience an average temperature of 18 with plenty of rainfall of about 60 millitres per month for the production of juice and also for its therapeutic value. Figure 1shows the percentage of orange fruit with other citrus fruits [3] From Fig 1., oranges compose 56% of citrus fruits worldwide followed by tangerines, mandarins and clementine (17%), lemons and limes (11%), grapefruit and pomelo (10%), and others (6%)
The orange fruit is known to possess anti-oxidant property brought about by the fact that it has vitamin C, flavonoids, phenolic compounds, and pectins [4]. The orange fruits offer a large percentage of vitamin C per day. Vitamin C is water-soluble and the most common antioxidant which has the ability to inhibit the production of radicals in the body and destruction to the body tissues. Vitamin C also plays a key role in keeping away cold, cough, and recurrent ear infections. Furthermore, Vitamin C aids the body’s immune system to function properly [5].
The consumption of orange fruits helps to guard against heart diseases by lowering the amount of homocysteine in the body. The vitamin C in the orange fruit, carotenoids, and the flavonoids are cardio protective. The orange fruit also contains limonene that can lower the levels of dietary fat. Furthermore, the orange fruit has been known to possess anti-carcinogenic property since it contains limonene which has the ability to lower the risk of several cancers in the body, for instance, cancer of the mouth, cancer of the skin, lung cancer, breast property depends on the antioxidant properties of the molecules and also the ability to control the functionality of cleansing hepatic enzymes [6].
The orange fruits have also the ability to reduce the chances of developing kidney stones. The consumption of a lot of orange juice per day increases the pH value of the urine and the elimination of citric acid which leads to a reduction in the formation of calcium oxalate stones [7]. The orange fruits are vital in the prevention of stomach ulcers. Ulcers are caused by the presence of helicobacter pylori; the frequent consumption of orange juice daily lowers chances of infection with the helicobacter pylori thereby stopping the growth of ulcers, likewise, the orange fruit plays a crucial role in keeping away typhoid, which is a major problem mainly affecting the developing countries [8].
The flavonoids in the orange are good in fighting the salmonella typhi liable for the development of typhoid. The orange fruit can also be used to reduce nervousness by the sweet orange oil which acts as an anxiolytic agent. They are also good at relieving fever, when the pulp is roasted it can be compressed for the treatment of skin cancer. Acnes can be treated by rubbing freshly prepared peels on the affected area. The peels of orange contain oil that has a toxic effect on fleas, fire ants, house flies because it has a large percentage of limonene. The orange peels are also used medicinally to kill fungi [9].
The bioflavonoids present in orange to be precise hesperidin and naringin have anti-diabetic activity. The potential to deal with diabetes is aided through the ant-peroxidation and the inhibition of the activity of the α-amylase enzyme that causes change of the complex carbohydrates to glucose; it increases the amount of hepatic glycogen, stimulates the secretion of insulin, and repairs the pancreatic β-cells which have secretory defects [10].
Orange has been used traditionally as a medicine to manage various ailments. This plant has been a source of flavonoids, terpenes, potassium, calcium, and various vitamins like B1, B2, B3, B5, A, B6, and C. It has been useful in the following cases; orange juice is very good in the removal of toxic substances in the body, it keeps the body hydrated, it has been used in the management of obesity [11].
Studies have shown that fruits, herbs, and vegetables contain phenolic compounds which are vital in scavenging oxygen free radicals in our body system. The free radicals may lead to the oxidation of lipids and DNA as well as the cause of various ailments which include rheumatoid arthritis, cancer, and various neurodegenerative and pulmonary diseases [12]. The powerful antioxidant ability of phenolic compounds from the oranges can help safeguard the body against the free radicals and hence they are important substances in obtaining and preserving human health [13].
Plants synthesize phenolic compounds as natural products which help them in dealing with physiological and ecological stresses, for example, plants have to protect themselves against insect attack, pathogens, harmful ultra-violet (UV) radiations, and wounding. All phenolic compounds have aromatic rings in their structures with either one or several hydroxyls (OH) groups. These compounds are classified into two broad classes, namely; simple phenols and polyphenols. The different colors of the plants for example, purple, and yellow, amongst others come about because of the flavonoids which are biosynthesized by the plants from phenylalanine as well as tyrosine [14]
The different classes of phenolic compounds depend on the extent of hydroxylation and the location of those groups on the ring. This leads to two classes that have distinct structures that are hydroxycinnamic derivatives, for example, p-coumaric, and the second class known as hydroxybenzoic derivatives, for example, Gallic [15]
There is another group of plant phenolic compound that is known as the cell wall phenolic. The compounds are unsolvable as well as exist in different forms within the cell modules. The cell wall phenolic can also be classified into two main classes, namely; hydroxycinnamic acids and lignins. These compounds are very important as the plant grows because they help in the protection of the plant against infection, harmful ultraviolet radiation, and wounding [16]
The process of determination and quantification of phenolic compounds in fresh orange and products has been an area of extensive research. There are several high-performance liquid chromatography (HPLC) methods that can be used to evaluate and quantify the number of compounds having phenol units in the orange fruit and orange processed products [17]
STATEMENT OF THE PROBLEM
This study focuses on the variation in total phenolic content of freshly squeezed orange juice from several markets in Nairobi County, including Ngara Market, Gikomba Market, and Muthurwa Market. This variation is a problem since it may affect the nutritional value and possible health advantages of orange juice that are offered to customers. In order to maintain consistent product quality and maximize the health advantages of the phenolic compounds in orange juice, it is crucial to understand the mechanisms causing this fluctuation.
MAIN OBJECTIVE
The main objective of this study was to quantify the total phenolic content in freshly prepared orange juice in Nairobi County.
Specific Objectives
The specific objectives were to:
- Determine the total phenolic content of freshly prepared juice from Ngara Market.
- Determine the total phenolic content of freshly prepared juice from Gikomba Market
- Determine the total phenolic content of freshly prepared juice from Muthurwa Markets
Justification of the Study
Fruit juice contains phenolic compounds. The compounds provide the body with natural antioxidants, which are capable of preventing the body against ailments, for example, diabetes; this has led to an increase in the intake of fruits [18]
The commercially processed orange juice go through various procedures such as, pasteurization and therefore, it is expected that these processes will make a difference in the total phenolic content from those of fresh orange juice [19]The current study is to provide more information to consumers on different about freshly prepared orange juice in terms of the total phenolic content. This finding contributes a springboard for my study on the total phenolic content in fresh orange juice in Nairobi County. If done for orange juice, for example, the results will form a basis for the study of the juice from other fruits in Nairobi County.
MATERIALS AND METHODS
Chemicals
The chemicals that were used in this study were of analytical grade and they were all locally acquired from Vision Scientific Laboratory Chemicals within Nairobi city. They included, gallic acid, Folin-ciocalteu, sodium carbonate, ascorbic acid, nitric acid, chromic acid, and distilled water.
Apparatus and Equipment
The apparatus and equipment that were used were; 100 ml volumetric flasks, 250 ml glass beakers, 20 ml pipettes, wash bottles, plastic basins, knife, filter funnels, 250 ml conical flasks, refrigerator, Perkin Elmer UV-Visible spectrophotometer, 0.45 µm pore filter membranes, sonicator, and analytical balance.
Cleaning of Glass and Plastic Containers
The glass apparatus that was used in the study were soaked for 24 hours in freshly prepared chromic acid solution. Thereafter, they were rinsed using distilled water, which was followed by soaking them again in distilled water for another 6 hours to remove any absorbed chromic ions. All the glassware was then dried in the oven after having rinsed with distilled water. The plastic apparatus were first cleaned with a detergent and then rinsed with distilled water and finally dried in the open rack.
Sample Collection and Transportation to the Laboratory
Triplicate orange fruit samples were each purchased from Ngara, Gikomba, and Muthurwa markets in Nairobi County. The samples were packed in self-sealing polythene bags labeled and stored in polyurethane cooler boxes and transported to the laboratory at the Department of Chemistry, Coffee Research Institute. In the laboratory, the fruits samples were thoroughly washed with running water from the tap and then rinsed using distilled deionized water and kept in the fridge at 4.2 awaiting extraction and analysis.
Sample Preparation
1) Extraction and clean-up of orange juice: The orange juice used for analysis was obtained using the modified procedure as described by [20]The orange fruits were first washed in running tap water and then rinsed using distilled water. The oranges were then sliced into halves using a sterilized stainless steel knife; seeds were removed and squeezed by hand into glass beakers to obtain the juice. The juice was then filtered through number one size filter papers to obtain clear juice and kept in the refrigerator at a temperature of 4.2 to avoid degradation awaiting analysis.
2) Preparation of Gallic Acid and Ascorbic Acid Stock Standard Solutions: The stock standard solutions used in the study were prepared by dissolving accurately weighed 300 mg of gallic acid and then transferred into 100 ml volumetric flask, 100 ml of methanol was added up to the mark. The mixture was ultrasonicated to obtain a homogeneous solution. This stock solution was labeled standard solution 1 (one) with a concentration of 3000 ppm. While 3000 ppm of the ascorbic acid stock standard was also prepared by accurately weighing 300 mg of the acid, transferring to 100 ml volumetric flask, and following procedures as was done with gallic acid. This stock ascorbic acid solution was labeled standard solution 2 (two).
3) Preparation of Gallic Acid and Ascorbic Acid Calibration Curves: Using the stock solutions of gallic acid and ascorbic acids solution prepared in section 3.6.2 above, various calibrating standard solutions of 5 ppm, 10 ppm, 20 ppm, 40 ppm, 60 ppm, 80 ppm, and 100 ppm were prepared from the stock solution using the equation 1.1
C1 V1= C2 V2
Equation 1
Where; C1 and V1 are respectively initial concentration and volume while C2 and V2 are respectively the final concentration and volume.
The calibration curves for Gallic and ascorbic acids were prepared by using 10 ml cuvette as sample vials and methanol as a blank sample and scanning the standards using UV spectrophotometer at ƛ max = 515 nm and 730 nm for Gallic and ascorbic acids respectively
4)Folin-Ciocalteu Assay: [21] Noted that for a very long time, phenolic compounds were used as natural antioxidants. This is because phenolic compounds are capable of releasing electrons and also have the ability to stabilize free radical intermediates in the prevention of oxidation of cellular and physiological level. Phenolic compounds and polyphenols have a higher percentage composition in various parts of the plant and therefore it is important to work out the number of phenols in fruit juices. In this study, the quantity of phenolic compounds in the orange juice samples was determined by the use of the Folin-ciocalteu assay [22]). The Folin-ciocalteu method was used because this is one of the oldest methods used to quantify phenols in plants and it’s also known to be sensitive since it requires a small amount of plant samples.
This protocol of assessing the total phenolic content of plant samples was first developed by [23] The protocol was used in the determination of an amino acid that contains a phenol group i.e. tyrosine in proteins. The protocol was further modified by [24]for the analysis of phenolic compounds. The assay is based on the redox reactions and it has been used for many years for the determination of the levels of phenolic compounds in the plant samples by making use of gallic acid as a reference.
The major reaction that takes place involves the reduction of phenols by a phosphomolybdic tungstic acid reagent. The phenolic compounds are oxidized in a basic medium forming the superoxide ion which then reacts with the molybdate to form molybdenum oxide which has absorption at 725 nm. The plant phenols are determined by the reduction of the Folin-Ciocalteu reagent. The process involves taking the suspected sample and adding distilled water to it and then mixing with the Folin-Ciocalteu reagent with 2- 40% ++
sodium carbonate. The reaction mixture is then incubated at room temperature for a period of 40 min and thereafter the absorbance is monitored at 725 nm. The control in this procedure is a mixture that contains the extracting solvent which is usually methanol.
The levels of phenolic compounds in the plant sample are estimated as gallic acid equivalents (GAE). The challenge with using Folin-Ciocalteu to determine the levels of phenolic compounds in plant samples is that apart from the phenols in the samples there are other non-phenolic compounds for example ascorbic acid, sugars, aromatic amines, organic acid, and proteins which also react with the phenol reagent leading to the overestimation of the phenolic compounds in the plant samples.
To prepare the Folin-ciocalteu reagent used in this study, 10 ml of the Folin-ciocalteu reagent from the stock solution was measured accurately using a 10 ml pipette and was transferred into a 100 ml volumetric flask. 90 ml of distilled water was then added to the mark and was shaken well to make a concentration of 0.2 N.
5) Prussian-Blue Assay: [25] developed the Prussian–blue assay for determining the total phenolic content. The method involves diluting 1 ml of the sample analyte with 50 ml of distilled water. The diluted sample is then added 3 ml of 0.5M ferric chloride mixed with 0.1N hydrochloric acid together with 3.0 ml of potassium ferricyanide. The mixture is then allowed to stand for about 15 minutes to allow for color development before the absorbance readings are taken at 725 nm using a UV-Vis spectrophotometer with gallic acid as standard reference.
[26]noted that the most common methods of determining the total phenolic content in plants are the Folin-ciocalteu assay and the Prussian-blue assay. The two methods mainly focus on changes in color which develops due to oxidation of the phenolic compounds by the specific reagents. For instance, in the Folin-ciocalteu assay, it is made up of phosphotungstic (H3PW12O40) and phosphomolybdic (H3PMO12O40) acids that are responsible for the oxidation of the phenolic compounds to tungsten ( W8O23) and molybdene (Mo8O23) which are blue in color. In the Prussian-Blue assay the method is pegged on the reduction of ferric ion (Fe3+) with is red in color to ferrous ion (Fe2+) which is blue by the phenolic compounds. The development of the blue color in both assays shows the amount of phenolic compounds which can be determined by the use of a UV-Vis spectrophotometer at specified wavelength [27]
Nur Huda et al (2015) observed that the Folin-ciocalteu assay is the best in determining the phenolic content in plants because it’s highly stable and reproducible when compared to the Prussian-Blue assay which is not stable because the extract forms undesirable precipitates with the reagent which keeps on increasing as the incubation time increases.
6) Preparation of the 20% Sodium Carbonate: To prepare 20% Sodium carbonate, 2.12 grams of sodium carbonate were accurately weighed using an analytical balance and transferred into a 100 ml glass beaker. 40 ml of distilled deionized water was then added and the mixture was thoroughly stirred using a glass rod to dissolve the sodium carbonate. The solution was then transferred to a 100 ml volumetric flask and 60 ml of distilled deionized water was then added to the mark to make 20% sodium carbonate.
Determination of Total Phenolic Compound Levels in Orange Samples from the Markets
The quantification of the total phenolic acid of orange juice samples from the Ngara, Gikomba, and Muthurwa Markets were done using the Folin-ciocalteu reagent. This was achieved by making use of the stock Gallic acid. The Gallic calibration curve was prepared by measuring the absorbance of solutions of 3, 6, 9, 12, 15, 18, 21, 24, and 30 ppm in methanol from the stock standard 1 (one) solution of the gallic acid solution prepared in table 1.
Table 1: Mean Absorbance of Gallic Acid Standard Solution.
| Concentration (ppm) | Absorbance (mean) ƛ max = 730 nm |
| 3 | 0.096 ± 0.001 |
| 6 | 0.204± 0.004 |
| 9 | 0.346± 0.002 |
| 12 | 0.436± 0.003 |
| 15 | 0.61± 0.005 |
| 18 | 0.74± 0.001 |
| 21 | 0.867± 0.001 |
| 24 | 1.01± 0.004 |
| 30 | 1.275± 0.003 |
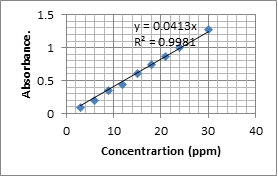
Fig 2: Gallic Acid Calibration Curve.
From each of the dilutions, 200 µl of the solution was mixed with 400 µl of distilled water and followed by the addition of 100 µl of Folin-ciocalteu reagent, and allowed to stand for 10 minutes. Thereafter, 1 ml of 20% sodium carbonate was added to the reaction mixture and their absorbance was recorded after one hour against methanol blank at 730 nm using a UV spectrophotometer to obtain a calibration curve. The same procedure was used to prepare the orange juice samples from Ngara, Gikomba, and Muthurwa Markets, for analysis and recording the absorbance for each sample. The calculation of the amount of the total phenolic in the orange samples was quantified as gallic acid equivalents (mg/gGAE). This was obtained by using the equation 1.2:
Total Phenolic Content (TPC)=cV/m Equation 1.2
Where, c = concentration from the standard calibration curve of Gallic acid, V= total volume of the extract, and m = mass of the extract.
Data analysis
The data in this study are presented as the mean standard deviation of the triplicate measurements. Also, the data was presented using bar graphs, the correlation between the total phenolic content and the percentage inhibition was carried out using the Pearson correlation coefficient and the linear regression between the total phenolic content and the percentage inhibition was done using Stata software version 14.2.
RESULTS AND DISCUSSION
Total Phenolic Contents (TPC) of Fresh Orange Juice Samples.
The TPC of the juice samples was determined using the Folin-Ciocalteu method. The method depends on the reduction of phenolic compounds in an alkaline medium. The calibration curve of gallic acid with R2 = 0.9929 was used to work out the TPC. TPC of the fresh juice ranged from 129.75±0.39 mgGAE to 133.10±0.95 mgGAE. The fresh orange juice samples were identified as S1, S2, and S3. The highest TPC value in the fresh orange juice was detected in sample S2 and the lowest was detected in sample S1 (Table 1.2 and Figure 1.3). Therefore, the TPC of the fresh orange juice were detected as follows, S2 ˃ S3 ˃ S1. The difference in the total phenolic content of the orange juice samples can be attributed to the difference in the climatic and geographical conditions from which the orange fruits used to process the juice were grown [28]
Table 2. Total Phenolic Content (TPC) of Fresh Orange Juice Samples.
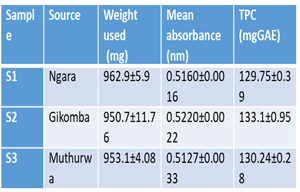
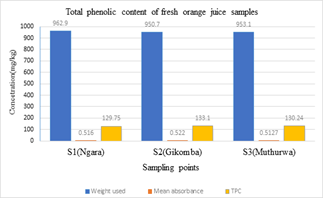
Fig 3: Graph Showing the Total Phenolic Content (TPC) of Fresh Orange Juice Samples
CONCLUSION
This study set out to determine how much total phenolic material was present in freshly squeezed orange juice from three marketplaces in Nairobi County: Ngara Market, Gikomba Market, and Muthurwa Market. According to the findings, there are differences in phenolic content between various marketplaces, which are probably caused by things like fruit quality and fruit processing procedures. We advocate for putting quality control measures in place, looking into the variables that cause variability, educating customers about the advantages of phenols, adjusting tactics to market preferences, and encouraging safe handling and storage in order to guarantee consistent quality. In Nairobi County, this study paves the way for boosting orange juice’s nutritional value and general quality by highlighting the significance of its phenolic content.
RECOMMENDATION
From the study, we can note that it’s good to take the fresh orange juice. This study gives very important information on the choice of various types of orange juice in order to maintain good health. In addition, the information provided in this study, allows consumers to have alternatives when it comes to choosing orange juice for consumption and also help the consumers to be aware of various composition of these juices thus avoiding misinformation especially on labels of juices. It’s recommended that studies have to be carried out in future to analyze the specific phenolic compounds and polyphenols in orange juice.
REFERENCES
- Etebu, E., & Nwauzoma, A. B. (2014). Classification of orange fruits. In Advances in Citrus Nutrition (pp. 25-30). Springer.
- Parle, M., & Chaturvedi, S. (2012). Global production and distribution of citrus fruits: An overview. Indian Journal of Natural Products and Resources, 3, 275-285.
- Mann, C. (1987). World distribution of citrus fruits by 2010. In Citrus Fruits: Production, Consumption and Health Benefits (pp. 45-57).
- Jae-Hee, P. (2014). Antioxidant properties of orange fruits. Food Chemistry, 64(4), 187-192.
- Sudha, G., & Reshman, S. (2017). Vitamin C and its role in immunity. International Journal of Health Sciences, 1(3), 25-32.
- Santa, M. (2017). Anti-carcinogenic properties of orange fruits. Journal of Cancer Prevention, 9(1), 15-21.
- Clarita, W. (2006). Orange juice and its potential in reducing kidney stone formation. Nutrition Journal, 5, 1-8.
- Giuseppina, M. (2017). Medicinal properties and uses of Citrus sinensis: A comprehensive review. Journal of Pharmacognosy and Phytochemistry, 6(5), 1769-1773.
- Maria, S. (2013). Medicinal uses of orange peels: A review. International Journal of Herbal Medicine, 1(3), 18-22.
- Franziska, M.(2018). Antidiabetic activity of Citrus sinensis: A comprehensive review. Journal of Traditional and Complementary Medicine, 8(3), 361-370.
- Carolina, M., & Thais, B. (2017). Traditional uses of Citrus sinensis in medicine: A review. Journal of Medicinal Plants Research, 11(14), 395-402.
- Lobo, V.(2010). Free radicals, antioxidants and functional foods: Impact on human health. Pharmacognosy Reviews, 4(8), 118.
- Ashwell, M., Stone, E. M., St Jeor, S. T., & Jordan, H. A. (2010). The powerful antioxidant ability of phenolic compounds from oranges: Safeguarding the body against free radicals. Journal of Health and Nutrition, 12(3), 45-52.
- Khoddami, A.(2013). Phenolic compounds in plants: Biosynthesis, classification, and antioxidant properties. Trends in Food Science & Technology, 30(1), 1-11.
- Milena, M., Mario, R., & Marostica, J. (2019). Phenolic compounds: Structure, classification and antioxidant properties. In Bioactive compounds, health benefits and potential applications (pp. 33-50).
- Oscar, F., & Monica, F. (2018). Cell wall phenolic compounds in citrus fruits: Structure, occurrence, and biological activity. Food Chemistry, 252, 358-366.
- Obafaye, R. O. (2015). Phenolic compounds in fresh orange and orange products: A comprehensive review. Journal of Food Science and Technology, 52(12), 8328-8339.
- Joanne, R., & Beate, W. (2012). Fruit juice and its phenolic compounds: A review. Critical Reviews in Food Science and Nutrition, 52(9), 875-890.
- Savatović, S., Tepić, A. N., Šumić, Z. M., & Nikolić, M. S. (2009). Antioxidant activity of polyphenol-enriched apple juice. Acta Periodica Technologica, 40, 95-102.
- Bates, R., Morris, J. R., & Crandall, P. G. (2001). Principles and practices of small and medium scale fruit juice processing. Retrieved from http://www.fao.org./3/a-y251e
- Lopez, A. (2003). Phenolic compounds and antioxidant capacity of brassica vegetables. Journal of Agricultural and Food Chemistry, 51(8), 2475-2482.
- Kujala, T. S. (2000). Phenolics and betacyanins in red beetroot (Beta vulgaris) root: Distribution and effect of cold storage on the content of total phenolics and three individual compounds. Journal of Agricultural and Food Chemistry, 48(11), 5338-5342.
- Folin, O., & Denis, W. (1927). On phosphotungstic-phosphomolybdic compounds as color reagents. Journal of Biological Chemistry, 73(2), 627-650.
- Singleton, V. L., & Rossi Jr, J. A. (1965). Colorimetry of total phenolics with phosphomolybdic-phosphotungstic acid reagents. American Journal of Enology and Viticulture, 16(3), 144-158.
- Gupta, V. K., & Verma, N. (2011). A review on the biosynthesis of metallic nanoparticles (gold and silver) using bio-components of microorganism: Scope for developing a commercial process. Bioresource Technology, 102(22), 9438-9450.
- Azlim, N. (2010). Antioxidant activities, phenolic and flavonoid contents in the leaves of different varieties of sweet potato (Ipomoea batatas). Australian Journal of Crop Science, 4(6), 458-464.
- Stratil, P., Kuban, V., & Fojtova, J. (2008). Comparison of phenolic content and total antioxidant activity in wines as determined by spectrophotometer methods. Czech Journal of Food Sciences, 26(4), 242-253.
- Zarei, M. (2010). Phenolic Compounds Characterization and Biological Activities of Citrus aurantium Bloom. Molecules, 15(3), 1909-1922.