Statistical Approach to Enhancing Performance of Logistic Regression Model: Application to HIV/AIDS Data
- Nathaniel Howard
- 230-245
- Jan 17, 2024
- Health
Statistical Approach to Enhancing Performance of Logistic Regression Model: Application to HIV/AIDS Data
Nathaniel Howard
Department of Statistics, University of Cape Coast, Cape Coast, Ghana
DOI: https://doi.org/10.51584/IJRIAS.2023.81221
Received: 06 December 2023; Revised: 19 December 2023; Accepted: 25 December 2023; Published: 16 January 2024
ABSTRACT
This paper considered a robust method for modeling and predicting HIV/AIDS status of patients using logistic regression model enhanced with principal component analysis (PCA) and K-medians. In particular, the study developed a computational method for disease classification; and then identified key haematological predictors of HIV/AIDS status. Based on quantitative research design, the utility of the methods is exemplified using real HIV/AIDS data obtained from a polyclinic in the Greater Accra region of Ghana. The data consists of one hundred and fifty (150) patients, eighty (80) of whom are known to have tested positive for HIV/AIDS. The study findings revealed that enhancement in predictive accuracy for a logistic regression is possible by means of incorporating PCA and K-Medians with robust centers. Model 5 was found to be the best predictor of HIV/AIDS status of a patient. It is an integration of both robust principal component analysis and K-Medians clustering into a binary logistic regression model. Its predictive accuracy is over 93%, and with 98% probability per the ROC criterion. The study thus recommends the incorporation of both RPCA and K-Medians with robust centers into binary logistic regression model to enhance its predictive performance.
Keywords: Haematological Parameters, Robust, Logistic Regression, HIV/AIDS
INTRODUCTION
AIDS is a systemic HIV infection that causes significant impairment and increasing destruction to cellular and humoral immune responses (Munyazesa et al., 2012). The presence of haematological abnormalities, aside from immunological consequences of HIV illness (Rudnicka & Schwartz, 2009), is a powerful independent predictor of morbidity and mortality among HIV-infected persons (Anastos et al., 2004). Kusfa et al. (2017) stated in their study that HIV infection has a considerable impact on patients’ haematological and immunological parameters, resulting in decreased quality of life, increased fatality cases and exacerbated morbidity. The introduction of antiretroviral medication, on the other hand, has significantly improved the clinical and haematological outcomes of HIV-infected individuals over the years, making it a more manageable disease. Despite these findings, there have been reports of drug-induced haematological derangement associated with antiretroviral therapy (Bhardwaj et al., 2020).
Various researchers have described clinical and haematological manifestations of both HIV-infected and HIV-uninfected persons in a variety of researches (Evans & Scadden, 2000; Munyazesa et al., 2012; Bayu et al., 2017; Ezeamama et al., 2018). Though many studies have established the clinical and haematological symptoms of HIV/AIDS infection, few have attempted to develop a model to predict HIV/AIDS status of patients based on their haematological characteristics. Some studies (Adjei et al., 2008; Laar et al., 2014; Afari & Blay, 2018; Iddrisu et al., 2019; Sambah et al., 2019) on the subject matter have traditionally focused on the prevalence and risk factors linked with HIV/AIDS infection, as well as the profiles of HIV affected households. Researches have failed to focus on investigating the clinical manifestation in the haematological parameters. Despite the huge importance of disease modeling in healthcare, there have been few attempts at modeling HIV/AIDS data. The purpose of this study is to developed an efficient and reliable model for classifying HIV/AIDS infection status of patients based on haematological indicators in order to enhance healthcare. The research questions which guided the study include: (1) Does an integration of PCA into a baseline binary logistic regression model improve model’s predictive accuracy? (2) Does integration of both PCA and K-Means into a baseline binary logistic regression model improve model’s predictive accuracy? (3) Does an integration of a robust PCA (or RPCA) into a baseline binary regression model improve model’s predictive accuracy? and (4) Does integration of both RPCA and K-Medians into a baseline binary regression model improve model’s predictive accuracy?
Five computational methods will be applied to study data. These methods include a baseline binary logistic regression model (BLRM), BLRM integrated with PCA, BLRM integrated with both PCA and K-Means, BLRM integrated with RPCA and BLRM integrated with both RPCA and K-Medians. PCA being a dimensions reducing method will be employed to transform the original set of p predictors into a new set of k uncorrelated variables, while retaining much of the variation in the original dataset. K-Means (or K-Medians) clustering which uses the mean (or the median) to construct similarity matrices will be used to organize the haematological parameters into clusters with similar characteristics.
METHODOLOGY
This section presents the background to the methods that have been employed in this paper.
2.1 The HIV/AIDS Infection Model
Consider the response variable yi∈{0, 1} indicating whether a patient is HIV/AIDS positive or negative. This response variable yi∈{0, 1} is associated with p haematological parameters or predictors, (x1i, x2i, ⋯ ,xpi) and unknown coefficient β=(β0, β1, β2, ⋯ ,βp). Here, an attempt is being made to develop a model to predict the HIV/AIDS status of patients using their haematological characteristics. This will add to existing methods of predicting HIV/AIDS status of patients and help medical practitioners to advice/prescribe appropriate medications.
For i=1, 2, ⋯, m, each yi follows an independent Bernoulli distribution with the success probability parameter θ Thus,
p(Y=yi)=θyi (1-θ)1-yi (1)
We can model the success probability parameter using the canonical link given as:
log(θ/(1-θ))=w (2)
where w is a linear regression model of the form
w=β0+β1 x1i+β2 x2i+⋯+βp xpi, (3)
and x=(x1i, x2i, ⋯ ,xpi) is the set of predictor variables with weights β=(β0, β1, β2, ⋯ ,βp). Since the HIV/AIDS data for this study contains twelve covariates, Equation (3) reduces to:
w=β0+β1 x1i+β2 x2i+⋯+β12 x12i (4)
Therefore, by combining Equations (2) and (4) the HIV/AIDS infection model becomes
log(θ/(1-θ))=w=β0+β1 x1i+β2 x2i+⋯+β12 x12i. (5)
That is,
log(θ/(1-θ))=β0+β1 x1i+β2 x2i+⋯+β12 x12i (6)
From Equations (6), we can deduce that
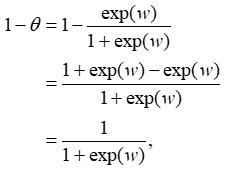
θ/(1-θ)=exp(w).
This implies that
θ=(exp( w))/(1+exp( w))⥂ (7)
Or equivalently,
θ=(exp(β0+β1x1i+β2x2i+⋯+β12x12i))/(1+exp(β0+β1x1i+β2 x2i+⋯+β12 x12i)). (8)
Thus, Equation (8) is the HIV/AIDS infection model. The parameter θ is the probability that a patient would be HIV/AIDS infected under variable Y. It is also called the “success probability”. xpi is the observed value of the pth (p=1, 2, ⋯, 12) haematological variable for patient i; and β0, β1, β2, ⋯, β12 are the parameter estimates associated with the haematological variables. It can be deduced from Equation (7) that
 (9)
(9)
where 1-θ is the probability that a patient will be HIV/AIDS uninfected under variable Y. Consequently, we can express the likelihood function of the HIV/AIDS model as
![]() (10)
(10)
The log-likelihood function is given by
![]() (11)
(11)
The maximum likelihood estimator (MLE) of the log-likelihood function is calculated by solving Equation (12); which is the derivative of l(y|β) with respect to β equated to zero. That is,
![]() (12)
(12)
2.2 Parameter inference for HIV/AIDS Infection model
Numerical estimation of the (p+1) parameters of the logistic regression model using the MLE approach can be extremely challenging. As a result, this study used the Fisher scoring method rather than the MLE approach to estimate the parameters of the HIV/AIDS infection model. The following is a summary of the algorithm for the Fisher scoring method.
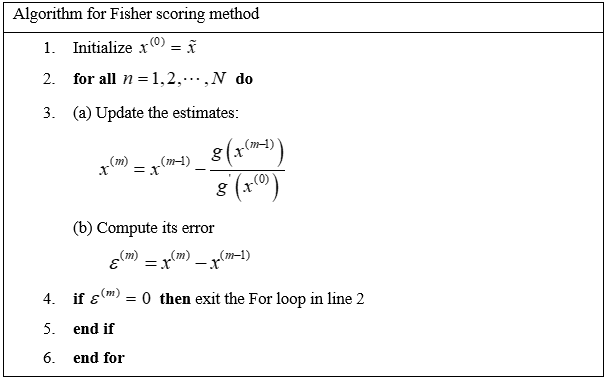
The convergent criterion for the Fisher scoring method is at point 4 of the algorithm. That is if the error of the function in the algorithm is 0, then we are at the convergent point. Based on that we can obtain the maximum likelihood estimates of the logistic classifier. Otherwise, the algorithm continues to iterate until a convergence criterion is met.
2.3 Application of Principal Component Analysis (PCA)
Consider a dataset with response y associated with p-dimensional predictor variables. Our aim is to transform the set of predictors X into a new sample set YPC with a smaller dimension k(k<p) , uncorrelated variables while retaining as much of the variation in the original dataset as possible. Thus, YPC is the principal component of X.
YPC=PC(X) (13)
The following steps were followed to implement the principal components:
- Organize the dataset With X having a set of n vectors (x1,x2,⋯,xn), where each element is an instance of the study dataset.
- We compute the median using the equation
![]() (14)
(14)
- Compute the variance using:
![]() (15)
(15)
- Compute the variance-covariance matrix using:
![]() (16)
(16)
- Determine Eigenvalues and Eigenvectors
The eigenvectors will determine the new feature space directions, while the eigenvalues will determine their magnitude. Let A be a square matrix (variance-covariance matrix), x a vector and λ a scalar that satisfies
Ax=λx. (17)
Then λ is called the eigenvalue associated with eigenvector x of A.
(A-λ)x=0. (18)
We already know that x is a non-zero, and so the only way Equation (18) can be zero is if
det( A-λI)=0. (19)
Equation (19) yields the eigenvalues. Consequently, solving for x in (A-λΙ)x=0 gives the corresponding eigenvectors associated with each λ.
- After determining the eigen space from the covariance matrix, the eigenvectors are ordered by eigenvalue, highest to lowest. This removes less significant components, leaving just the major components that provide a good approximation of the original data.
In the next stage of the study algorithm design, the new principal components were employed as input for the logistic regression model as well as an input for the K-Medians clustering.
2.4 Application of K-Medians Clustering
The purpose of K-Medians clustering is to organize a set of objects so that objects in the same group (or cluster) are more comparable (in some sense) to those in other groups. K-Medians clustering divides n observations into K clusters. To determine the centroid of each cluster, it computes the median. In order to apply the K-Medians clustering, the following steps are followed:
- Initialize k=2 since the target variable is a dichotomous outcome variable (HIV/AIDS-positive or HIV/AIDS-negative).
- For each input data determine the cluster center (median) that is nearest using Equation (20).
![]() (20)
(20)
- Re-compute the median using the median of each individual feature
- Repeat (b) and (c) until the convergence criterion is satisfied.
The final results from the K-Median clusters is cleaned up by deleting wrongly clustered data before deciding where to find our new dataset for classification.
2.5 Performance metrics
It is essential to measure the performance of a classification model. In this study, the performance of the models was measured using confusion matrix for binary classes. This is because the HIV/AIDS data consists two distinct categories – HIV/AIDS-positive and HIV/AIDS-negative patients. A confusion matrix, according to Singh et al, 2021, is a table used to define the performance of a classification system. It visualizes and summarizes a classification algorithm’s performance. Table 1 depicts an example of a confusion matrix for binary class data.
Table 1: Confusion matrix for binary class data
| Actual value | Predicted value | |
| Negative | Positive | |
| Negative | TN | FP |
| Positive | FN | TP |
In Table 1, the acronyms denote the following:
- TN means true negative
- FP means false positive
- FN means false negative
- TP means true positive
In general, some quantitative evaluation metrics are associated with a binary confusion matrix. These include accuracy, sensitivity, specificity, balanced accuracy among others. For the purpose of this study, the focus is on accuracy. Accuracy is defined as the number of samples that are correctly classified out of all the samples in the test set. That is, how many samples are correctly classified out of both negative and positive classes combined. For example, if the confusion matrix associated with a binary logistic regression model is Table 1; then the accuracy of this model is given as
![]()
Another tool that can be used to assess the performance of a binary logistic regression model as a classifier is the Receiver Operating Characteristics (ROC) for the model. The ROC curve is a graphical representation of the performance of a classifier. The Area Under the Curve (AUC) expresses the probability with which a model can distinguish between positive classes and negative classes. Thus, AUC take values between 0 and 1. If the AUC is 1, then the model has a perfect measure of separability; meaning that the model predicts 0s as 0s and 1s as 1s. On the other hand, if the AUC is 0; then the model has the worst measure of separability; meaning that the model predicts 0s as 1s and 1s as 0s. The closer the AUC is to 1, the better the model is at predicting 0s as 0s and 1s as 1s. In this paper, the closer the AUC is to 1, the better the model is at distinguishing between HIV/AIDS-positive patients and HIV/AIDS- negative patients.
2.6 Implementation of Methods
The R statistical software was used to implement the methods in the paper. The robust PCA was implemented by utilizing the prcomp package in R whereas the K-Medians clustering algorithm was implemented using the KMediansR package in R. The parameter estimation for the binary logistic regression model was implemented using the glm package in R.
2.7 Data Description
The data used in this study is secondary, and was obtained from medical records of a polyclinic in the Greater Accra region of Ghana. It spanned from January 2010 to December 2020, and involved one hundred and fifty patients and twelve variables. Eighty of the patients were known to have tested positive for HIV/AIDS; whereas the remaining seventy had tested negative. Tested positive or negative indicates that the patient is HIV/AIDS infected or uninfected, respectively. The response variable in this study is the HIV/AIDS-infection status of each patient. The HIV/AIDS-infection status is dichotomous in nature: infected or uninfected. The twelve covariates of patients patronizing HIV/AIDS services at the study hospital in Ghana are as follows:
| • White blood cell (WBC) | • Reticulocyte |
| • Red blood cell (RBC) | • Mean corpuscular volume (MCV) |
| • Number of lymphocytes | • Mean corpuscular haemoglobin (MCH) |
| • Neutrophil | • Erythrocyte Sedimentation rate (ESR) |
| • Hematocrit | • Platelete (PLT) |
| • Haemoglobin (HGB) | • Mean corpuscular haemoglobin concentration (MCHC) |
The data also include patients’ demographic characteristics such as gender, age, marital status, religion, occupation, and educational levels.
RESULTS AND DISCUSSIONS
In this section, various models are generated and assessed for their classification performance. In particular, a baseline binary logistic regression model is generated using the covariates in the study data and then assessed. Following this baseline binary logistic regression model, different models are generated by integrating PCA/RPCA and K-Means/K-Medians clustering into the baseline model and then assessed.
The study established that the baseline logistic regression model, Model 1, predicated HIV/AIDS status with an accuracy of 84%. Model 2 is an integration of PCA into the binary logistic regression model. It predicated HIV/AIDS status with an accuracy of 93%, an improvement of 9% from Model 1. Model 3 is an integration of both PCA and K-Means into the binary logistic regression model. It improved the HIV/AIDS prediction accuracy by a further 3% to 96%. Model 4 is an integration of RPCA into the binary logistic model. It predicts HIV/AIDS with an accuracy of 89%, an improvement of 5% from Model 1. Model 5 was found to be the best predictor of HIV/AIDS status of a patient. It is an integration of both RPCA and K-Medians clustering into a binary logistic regression model. Its predictive accuracy is over 93%.
3.1 Model 1: Logistic regression model for the HIV/AIDS data
Model 1 is obtained by fitting a binary logistic regression model to the HIV/AIDS study data. The confusion matrix associated with Model 1 is shown in Table 2.
Table 2: Confusion matrix for Model 1
| Actual value | Predicted value | ||
| HIV negative | HIV positive | Total | |
| HIV negative | 20 | 1 | 21 |
| HIV positive | 6 | 18 | 24 |
| Total | 26 | 19 | 45 |
A total of 45 predictions are made by Model 1. It classified 18 out of 24 HIV/AIDS-positive cases correctly, and 6 wrongly (or as false negative). On the other hand, Model 1 classified 20 out of a total of 21 HIV/AIDS-negative cases correctly, and only 1 wrongly (or as false positive).
Table 3: Performance accuracy for Model 1
| Metric | Value |
| Accuracy | 0.844 |
From Table 3, we observe that Model 1 classifies correctly over 84% of the time. That is, the probability with which Model 1 accurately predicts whether a patient’s status is HIV/AIDS-positive or HIV/AIDS-negative is approximately 84%.
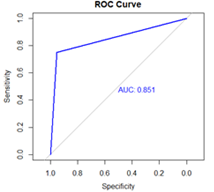
Figure 1: Receiver operating characteristics (ROC) curve for Model 1.
Figure 1 presents the ROC curve, which is a graphical representation of the performance of a classifier. The area under the ROC curve (AUC) for Model 1 is 0.851. Thus, Model 1 distinguishes between HIV/AIDS-positive cases and HIV/AIDS-negative cases with about 85% probability.
3.2 Model 2: Integration of PCA into binary logistic regression model for the HIV/AIDS data
In an attempt to improve on Model 1, PCA was integrated into the binary logistic regression model to obtain Model 2. Table 4 is the confusion matrix associated with Model 2.
Table 4: Confusion matrix for Model 2
| Actual value | Predicted value | ||
| HIV negative | HIV positive | Total | |
| HIV negative | 18 | 3 | 21 |
| HIV positive | 0 | 24 | 24 |
| Total | 18 | 27 | 45 |
A total of 45 predictions are made by Model 2. It classified all 24 HIV/AIDS-positive cases correctly. However, for the 21 HIV/AIDS-negative cases it classified 18 correctly and 3 wrongly (or as false positive).
Table 5: Performance accuracy for Model 2
| Metric | Value |
| Accuracy | 0.933 |
From Table 5, we observe that the probability that Model 2 accurately predicts whether a patient’s status is HIV/AIDS-positive or HIV/AIDS-negative is over 93%. It can be inferred that the prediction accuracy (93%) of Model 2 is 9% more than the prediction accuracy (84%) of Model 1. This improvement in prediction accuracy may be attributable to the integration of PCA into the binary logistic regression.
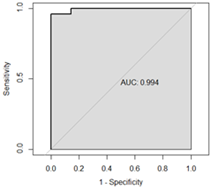
Figure 2: The ROC curve for Model 2
Figure 2 shows the ROC curve for Model 2 with AUC value 0.994. That is, Model 2 distinguishes between HIV/AIDS-positive cases and HIV/AIDS-negative cases with over 99% probability. This suggests that the intoduction of PCA for reducing the dimensionality of the haematological parameters may have improved the ROC curve and increased the AUC. This is in support of the performance accuracy criterion that Model 2 is a better classifier compared to Model 1.
3.3 Model 3: Integration of both PCA and K-Means into binary logistic regression model for the HIV/AIDS data
In this section, the possibility of further improving Models 1 and 2 was explored. Both PCA and K-Means clustering were integrated into the binary logistic regression model to obtain Model 3. Table 6 is the confusion matrix associated with Model 3.
Table 6: Confusion matrix for Model 3
| Actual value | Predicted value | ||
| HIV negative | HIV positive | Total | |
| HIV negative | 19 | 0 | 19 |
| HIV positive | 2 | 24 | 26 |
| Total | 21 | 24 | 45 |
A total of 45 predictions were made by Model 3. It classified 24 out of 26 HIV/AIDS-positive cases correctly, and 2 wrongly as false negative. Out of 19 actual HIV/AIDS-negative cases, Model 3 predicted all 19 correctly.
Table 7: Performance accuracy for Model 3
| Metric | Value |
| Accuracy | 0.956 |
Table 7 shows that the performance accuracy for Model 3 is 0.956. This means that the probability of Model 3 accurately predicting whether a patient’s status is HIV-positive or HIV-negative is approximately 96%. This is an increase of 3 percentage points over the prediction accuracy of Model 2. This improvement in prediction accuracy may be attributed to the integration of both PCA and K-Means into the binary logistic regression model.
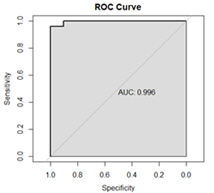
Figure 3: The ROC curve for Model 3
Figure 3 presents the ROC curve for Model 3 with AUC value of 0.996. This means that Model 3 distinguishes between HIV/AIDS-positive cases and HIV/AIDS-negative cases with approximately 100% probability. It is, therefore, clear that Model 3 classifies HIV/AIDS cases better than both Models 1 and 2. The results seem to suggest that introduction of both PCA and K-Means for reducing dimensionality and clustering of the haematological parameters can improve the predictive accuracy of the binary logistic regression model for HIV/AIDS status of patients.
Figure 4 contains boxplots for each one of the twelve (12) heamatologolical parameters used in this study against HIV/AIDS status. The boxplots show the presence of outlying observations within the predictor-space of the HIVAIDS data. These outlying observations can distort the validity of analysis and model outcomes. To control for the effect of outliers, median is rather used as the center of the data to compute the variance-covariance matrices used in the PCA. Thus, K-Medians clustering was subsequently used rather than K-Means clustering.
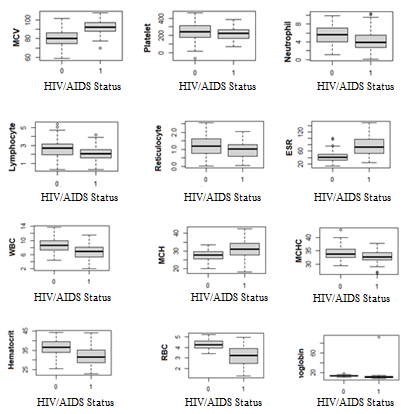
Figure 4: Box plots of heamatologolical parameters against HIV/AIDS status
3.4 Model 4: Integration of RPCA into binary logistic regression model for the HIV/AIDS data
In Model 4, a robust PCA (or RPCA) was integrated into binary logistic regression to model the study data. Table 8 is the confusion matrix associated with Model 4.
Table 8: Confusion matrix for Model 4
| Actual value | Predicted value | ||
| HIV negative | HIV positive | Total | |
| HIV negative | 20 | 4 | 24 |
| HIV positive | 1 | 20 | 21 |
| Total | 21 | 24 | 45 |
Of a total 45 HIV/AIDS status predictions made, Model 4 classified 20 out of 24 HIV/AIDS-negative cases correctly, and the remaining 4 wrongly as false positive. On the other hand, of the total 21 HIV/AIDS-positive cases; Model 4 correctly predicted 20 as true positive and only 1 as false negative.
Table 9: Performance accuracy for Model 4
| Metric | Value |
| Accuracy | 0.889 |
Table 9 shows that the prediction accuracy for Model 4 is 88.9%. In other words, the probability that Model 4 will accurately predict whether a patient’s status is HIV/AIDS-positive or HIV/AIDS-negative is nearly 89%. It is observed that the prediction accuracy (89%) for Model 4 is 5% more than the prediction accuracy of 84% for Model 1. However, it is less compared with Model 2 (0.933) and Model 3 (0.956). At this stage, Model 4 is preferred because the integration of RPCA had taken care of any outlier effect.
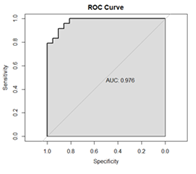
Figure 5: The ROC curve for Model 4
Figure 5 shows the ROC curve for Model 4 together with AUC value of 0.976. Although the AUC value (0.976) for Model 4 is further away from 1 compared with those for Model 2 (0.994) and Model 3 (0.996), we would still prefer Model 4 because of its ability handle outlying effect.
3.5 Model 5: Integration of Both RPCA and K-Median into binary logistic regression model for the HIV/AIDS data
In Model 5, both RPCA and K-Medians clustering were integrated into the binary logistic regression to model the study data. Table 10 is the confusion matrix associated with Model 5.
Table 10: Confusion matrix for Model 5
| Actual value | Predicted value | ||
| HIV negative | HIV positive | Total | |
| HIV negative | 19 | 2 | 21 |
| HIV positive | 1 | 23 | 24 |
| Total | 20 | 25 | 45 |
A total of 45 predictions were made by the classifier. Out of these cases, Model 5 correctly predicted 19 actual negative cases as HIV/AIDS-negative, but incorrectly predicted 2 actual negative cases as HIV/AIDS-positive. On the other hand, it correctly predicted 23 actual positive cases as HIV/AIDS-positive, but incorrectly predicted 1 actual positive case as HIV/AIDS-negative case.
Table 11: Performance accuracy for Model 5
| Metric | Value |
| Accuracy | 0.933 |
Table 11 shows that the prediction accuracy for Model 5 is 0.933. This implies that Model 5 predicts with over 93% accuracy whether an individual is HIV/AIDS-positive or HIV/AIDS-negative. This is an improvement of about 4% from Model 4. This increment may be attributed to the further integration of K-Medians clustering into Model 4.
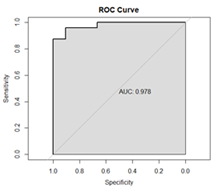
Figure 6: The ROC curve for Model 5
Figure 6 shows the ROC curve for Model 5 with AUC value 0.978. This suggests that the intoduction of RPCA for reducing dimensions and K-Medians clustering for the haematological parameters could improve the predictive accuracy of binary logistic regrssion model for HIV/AIDS status of patients.
3.6 Comparison of Models
Table 12 is a summary of the computational methods studied in this paper together with the performance metrics used.
Table 12: Summary of computational methods and performance metrics
| Model | Description | Accuracy | AUC |
| 1 | BLRM | 0.844 | 0.851 |
| 2 | PCA + BLRM | 0.933 | 0.994 |
| 3 | PCA + K-Means + BLRM | 0.956 | 0.996 |
| 4 | RPCA + BLRM | 0.889 | 0.976 |
| 5 | RPCA + K-Medians + BLRM | 0.933 | 0.978 |
In this paper, the efficiency five computational methods on an HIV/AIDS dataset known for its problems in terms of noisy observations and outliers was tested. These computational methods include a baseline binary logistic regression model (BLRM), BLRM integrated with PCA, BLRM integrated with both PCA and K-Means, BLRM integrated with RPCA and finally BLRM integrated with both RPCA and K-Medians. The performance accuracies of the five models are then compared. The BLRM (or Model 1) had an accuracy of 0.844 and AUC value of 0.851. Although these performance measures are reasonable good starting points, we sort to find ways to improve on the model performance.
An integration of PCA as a pre-processing step in the analysis enhanced model performance substantially. The accuracy of the BLRM integrated with PCA (or Model 2) was found to be 0.933 with AUC equal to 0.994. The improvement in the performance of Model 2 compared with Model 1 may be attributed to the lowering of dimensionality in the HIV/AIDS data using PCA. PCA may have helped to capture critical features while minimizing noise, resulting in a more accurate model. Further addition of K-Means clustering of the haematological parameters after PCA increased model accuracy further more. The accuracy of the BLRM integrated with both PCA and K-Means clustering (Model 3) is 0.956 with AUC equal to 0.996. These findings suggest that clustering of parameters contributes to data separation and allows the model to make better informed conclusions.
To deal with outlier effects in the data, a robust PCA (or RPCA) was integrated into the BLRM; and this resulted in significant improvements in the model. The accuracy of the BLRM integrated with RPCA (Model 4) is 0.889 with AUC equal to 0.976. The capacity of RPCA to detect and mitigate against outlier effects may have led to more reliable and stable logistic regression model results. Further addition of K-Medians clustering of the haematological parameters after RPCA provided a balance between outlier treatment and clustering. The accuracy of the BLRM integrated with both RPCA and K-Medians clustering (Model 5) is 0.933 with AUC equal to 0.978. These findings suggest that by combining RPCA and K-Medians clustering of the haematological parameters contribute to data separation and allows the model to make better informed conclusions.
It is observed that, in general, integration of PCA, RPCA, K-Means, K-Medians or their combinations into BLRM enhances accuracy of the classifier. In particular, it could be seen from Table 12 that Model 3 (or BLRM integrated with both PCA and K-Means) has higher accuracy and AUC values compared with Model 5 (or BLRM integrated with both RPCA and K-Median). The aim of this paper is to improve the accuracy of the logistic classifier in a more robust way. The traditional PCA uses the mean to construct variance-covariance matrices just like the K-Means clustering uses the mean to construct similarity matrices. Since evidence suggests the presence of outliers in some of the haematological parameters, and the median is regarded as more robust to outliers than the mean; this paper selected Model 5 as the best model. That is, The BLRM integrated with both RPCA and K-Medians is selected as the best model.
CONCLUSION AND RECOMMENDATION
In this section, conclusions from the study and recommendations presented.
4.1 Conclusion
In this paper, additional statistical methods were integrated into a baseline binary logistic regression model with the view of enhancing its ability to accurately predict HIV/AIDS status of patients. The additional statistical methods included PCA and RPCA – both dimension reducing techniques, and K-Means and K-Medians – both clustering techniques. It is established that enhancement in the predictive accuracy of the baseline binary logistic regression model is possible by the integration of principal component analysis or K-Means clustering or K-Medians clustering or combinations of dimensions reducing techniques and clustering methods. In the process, five predictive models (Model 1 to Model 5) were built and the predictive accuracy of each model was measured. The ROC curve criterion was also used to assess the classification performance of the models built. After a careful assessment of the built models coupled with the focus of this paper, the following conclusions are drawn.
- Model 1 predicts HIV/AIDS status of patients with an accuracy of 84%.
- Model 2 predicts the HIV/AIDS status of patients with 93% accuracy. This suggests that an integration of PCA improves HIV/AIDS prediction accuracy by 9% from 84%.
- Model 3 predicts HIV/AIDS status of patients with 96% accuracy. This suggests that additional integration of K-Means to a model already containing binary logistic regression and PCA improves HIV/AIDS prediction accuracy by 3% from 93%. It also suggests that integration of both PCA and K-Means to a binary logistic regression model improves HIV/AIDS prediction accuracy by 12% from 84%.
- Model 4 predicts HIV/AIDS status of patients with 89% accuracy, suggesting that an integration of RPCA improves HIV/AIDS prediction accuracy by 5% from Model 1.
- Model 5 is adjudged the best model even though its predictive accuracy of 93% is less than the 96% predictive accuracy for Model 3. Model 5 is integrated with RPCA which has the capacity to detect and mitigate against outliers which have been shown to be present in some of the haematological parameters. Further integration of K-Medians clustering of the haematological parameters provides a balance between outlier treatment and clustering.
This study has built an innovative model for predicting HIV/AIDS status based on haematological parameters, and will therefore help to address an important healthcare matter. This paper will contribute to early detection and appropriate management of HIV/AIDS.
4.2 Recommendation
The traditional K-Means clustering uses the mean in computing the similarity matrix. However, the mean is vulnerable to extreme values or outliers. In order to control for outliers in the classes, this paper adopted the median which is a more robust to outliers as the center in computing the similarity matrix. The paper recommends integration of both principal component analysis and K-medians clustering with robust centers into binary logistic regression models to enhance their predictive performance.
4.3 Limitations and Suggestions for Future Studies
This paper applied real HIV/AIDS dataset from a single polyclinic in Ghana. This may limit the generalization of the research findings to broader populations. Again, the study focused on a particular set of predictors within the haematological space, potentially overlooking other relevant variables. It is suggested that future researches address these limitations by incorporating diverse and larger datasets, and explore a more comprehensive range of predictors. Furthermore, the scope of this study was confined to binary classification tasks. Extensions of the analyses to multiclass scenarios and/or considerations of different machine learning algorithms could provide better understanding of the predictive capabilities of the various methods. Exploration of the robustness of the developed models across various healthcare contexts or demographic groups would contribute to the applicability of the findings.
REFERENCES
- Adjei, A. A., Armah, H. B., Gbagbo, F., Ampofo, W. K., Boamah, I., Adu-Gyamfi, C., & Mensah, G. (2008). Correlates of HIV, HBV, HCV and syphilis infections among prison inmates and officers in Ghana: A national multicenter study. BMC infectious diseases, 8(1), 1-12.
- Afari, S., & Blay, E. (2018). Prevalence of haematological and serum biochemical abnormal-lities in hiv infected patients in Ghana, before and after antiretroviral therapy. J Virol AIDS 5:039.
- Anastos, K., Shi, Q., French, A. L., Levine, A., Greenblatt, R. M., Williams, C., & Hoover, D. R. (2004). Total lymphocyte count, hemoglobin, and delayed-type hypersensitivity as predictors of death and AIDS illness in HIV-1-infected women receiving highly active antiretroviral therapy. JAIDS Journal of Acquired Immune Deficiency Syndromes, 35(4), 383-392.
- Bayu, B., Tariku, A., Bulti, A. B., Habitu, Y. A., Derso, T., & Teshome, D. F. (2017). Determinants of virological failure among patients on highly active antiretroviral therapy in University of Gondar Referral Hospital, Northwest Ethiopia: a case–control study. Hiv/aids (Auckland, NZ), 9, 153.
- Bhardwaj, S., Almaeen, A., Wani, F. A., & Thirunavukkarasu, A. (2020). Hematologic derangements in HIV/AIDS patients and their relationship with the CD4 counts: a cross-sectional study. International journal of clinical and experimental pathology, 13(4), 756.
- Evans, R. H., & Scadden, D. T. (2000). Haematological aspects of HIV infection. Best Practice & Research Clinical Haematology, 13(2), 215-230.
- Ezeamama, A. E., Guwatudde, D., Sikorskii, A., Kabagambe, E. K., Spelts, R., Vahey, G., & Fawzi, W. W. (2018). Impaired hematologic status in relation to clinical outcomes among HIV-infected adults from Uganda: a prospective cohort study. Nutrients, 10(4), 475.
- Iddrisu, A. K., Opoku-Ameyaw, K., Bukari, F. K., Mahama, B., & Akooti, J. J. A. (2019). HIV testing decision and determining factors in Ghana. World Journal of AIDS, 9(2), 85-104.
- Kusfa, I. U., Abubakar, A. A., Muktar, H. M., Ibrahim, I. N., Awwalu, S., Balogun, M. S., & Ahmadu, I. (2017). Comparative analysis of some hematological and immunological parameters of HIV-positive patients at a tertiary HIV treatment center in Zaria, Nigeria. Sub-Saharan African Journal of Medicine, 4(1), 15.
- Laar, A., Fiaveh, D., Laar, M., Boatemaa, S., Abugri, J., El-Adas, A., & Quakyi, I. (2014). Profiles of HIV-affected households in Ghana.
- Munyazesa, E., Emile, I., Mutimura, E., Hoover, D. R., Shi, Q., McGinn, A. P., … & Anastos, K. (2012). Assessment of haematological parameters in HIV-infected and uninfected Rwandan women: a cross-sectional study. BMJ open, 2(6), e001600.
- Rudnicka, D., & Schwartz, O. (2009). Intrusive HIV-1-infected cells. Nature immunology, 10(9), 933-934.
- Sambah, F., Hagan Jr, J. E., Mintah, J. K., Hormenu, T., Ahinkorah, B. O., & Schack, T. (2019). Determinants of HIV Testing and Counseling Utilization among Trainee Nurses and Midwives in Central Region of Ghana. Clinical Research in Psychology, 2(1), 1-10.
- Singh, P., Singh, N., Singh, K. K., & Singh, A. (2021). Diagnosing of disease using machine learning. In Machine learning and the internet of medical things in healthcare (pp. 89-111). Academic Press.
APPENDIX
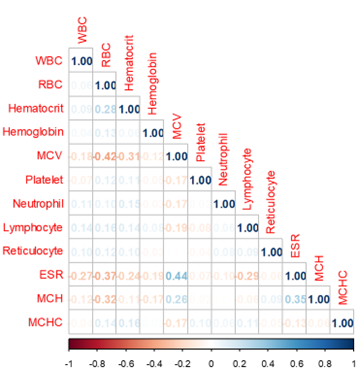
Figure A1: Correlation matrix for the haematological parameters. Generally, there are weak correlations among the haematological parameters.