Geophysical Investigation of the Subsurface Structural Competency Around College of Computing and Communication Studies, Bowen University, Iwo, Osun State, South West Nigeria
- T. Kolawole
- O.O. Ajani
- A.A. Adeniji
- F.O. Aweda
- T.A. Adagunodo
- 57-68
- Mar 28, 2024
- Mass Communication
Geophysical Investigation of the Subsurface Structural Competency Around College of Computing and Communication Studies, Bowen University, Iwo, Osun State, South West Nigeria
T. Kolawole*1, 2, O.O. Ajani1, A.A. Adeniji1, F.O. Aweda1, T.A. Adagunodo3
1Physics Programme, Bowen University,
Iwo, Osun State, Nigeria
2Department of SLT, The Polytechnic Ibadan,
Ibadan, Oyo State, Nigeria
3Department of Physics, Covenant University,
Ota, Ogun State, Nigeria
*Corresponding Author
DOI: https://doi.org/10.51584/IJRIAS.2024.90306
Received: 01 February 2024; Revised: 13 February 2024; Accepted: 20 February 2024; Published: 28 March 2024
ABSTRACT
Mapping of the subsurface structures within the environment is highly essential in engineering site characterization. The subsurface structure around the college of computing and communication studies, Bowen University Nigeria was studied using the very low frequency electromagnetic (VLF-EM) and the geo-electrical resistivity method. This was aimed with a view to investigate the weak and competent geological zones. In this study, five traverses were generated for both the VLF-EM and geoelectrical resistivity method, using the VLF-EM 16 equipment and OHMMEGA-Terrameter respectively. The results of the VLF-EM revealed the presence of positive and negative anomalies responses. The positive anomalies indicate the weak zones, which may be caused by geological structures such as faults/fractures, and contacts between rocks and the negative anomalies indicate the competent zones, which may be due to hard rock/laterite. The geo-electrical resistivity results revealed the vertical and lateral inverted resistivity values of the subsurface structure. The result revealed four layers such as top soil, weathered layer, fractured and fresh basement. From both the interpreted results, the weak/fractured zones mapped in the basement are points of interest in this research. The results of the investigation revealed that the probable cause(s) of the structural failures within the study area are evidence of geological features mapped as fracture and clayey formation that is present in the study area. Therefore, in order to evade future structural problems and minimize capitals used in restoring distressed structures in the University, a geophysicist services should be engaged for pre-foundation studies, which will act as a guide before and during construction.
Keywords: Geophysical investigation, Fracture, Conductive zone, Bedrock mapping, Very low frequency, Environmental studies
INTRODUCTION
Investigation of the subsurface weak and competent basement for structural stability is very fundamental in civil engineering site investigation. It aids in determining the appropriate depth of the building’s foundation as well as concerns linked with subsurface development. In addition, [1] reported that geophysical subsurface studies provide quick and cost-effective ways for acquiring detailed subsurface geological information. Moreover, geophysical methods may provide massive data and image of the subsurface without physically disturbing the subsoil. Also [2] reported that there is a need to perform conductive/fractured investigative surveys in Nigeria today since the rates at which structures fail are terrifying and have gotten more serious. According to [3], following the collapse of buildings in Nigeria, extensive geophysical and geotechnical investigations give knowledge that offers suitable solutions for future prevention. Moreover, [4] revealed that subsurface investigation is an important stage in obtaining bedrock stability responses for strategy and execution of viable civil engineering activities. Furthermore, the site selection for the location and installation of the engineering foundation must be based on competent geological materials because structural instability and other types of failure frequently set in immediately after the project is built. According to [5], engineering site investigations, which include geophysical techniques, are very effective in characterizing a site’s subsurface geology. According to [6] the geophysical technique allows for the early identification of geotechnical risk characteristics and adjusts for the impacts of subsurface spatial heterogeneity, which can restrict soil-structure contact and trigger structural failure. Similarly, [7] reports that geophysical methods and interpretation are commonly used for exploring the structural level of competence because this technique has been revealed to be the only solution for this heinous occurrence because this technique will map the subsurface variability encountered in determining the true essence of the proposed construction site. Furthermore, [2] the discussed that the structural stability and resistance to horizontal stress cannot be overstated, as the high incidence of structural collapse has continued to increase throughout the world, and using a geophysical method has been observed to be the only solution for this terrible incidence. In this regard, the very low frequency electromagnetic (VLF-EM) and geo-electrical resistivity method, among other geophysical methods, has been revealed to be an important tool in geoengineering research to check the competence of subsurface structures, [8; 9] offered extensive descriptions of the theory behind the methods. This approach has been most often utilized for efficient mapping of near-surface geological formations such as fractured zones, sheared contacts and faults. According to [10; 11] the enhanced conductivity of fractured zones can be detected by VLF and geo-electrical resistivity method, since they are quick method best suited for the identification of conducting zones with steep boundaries [12; 13; 14; 15; 16] and the method is thus well suited to locate steeply dipping fracture zones and other structures in bedrock as reported by [17]. Therefore, the VLF-EM and geo-electrical resistivity method was used in characterizing the subsurface geological nature within the study area to identify subsurface geological structures such as weak/fractured zones that could pose engineering challenges to future structural developments. Thus, subsurface data would offer evidence on the size, and the natures of the proposed structure and help in characterizing the study area into weak and competent zones.
Study Area Geology and Location
Bowen University Iwo is situated in the southwest region of Nigeria, with latitude 7°50′ to 8°00′N and longitude 4°00′ to 5°00′E. The research region is situated in a tropical climate with sporadic wet and dry seasons. [18] stated that the temperature is quite elevated throughout the day and fluctuates by season. On a very cold day, the average dial temperature is approximately 20 °C, whereas, on a very hot day, it is around 35 °C. The rainy season is the coolest period of the year. However, the rainy season goes from April to early October. In addition, the dry season goes from late October to early April. Consequently, the average amount of rainfall is between 1016 mm and 1524 mm over the period of the rainy season. A dusty wind blows from the Sahara Desert during the period of the dry season as reported by [18]. According to [19] the research location is in a landscape of old hard rocks covered by the Precambrian basement complex of Southwestern Nigeria as shown in Figure 1.
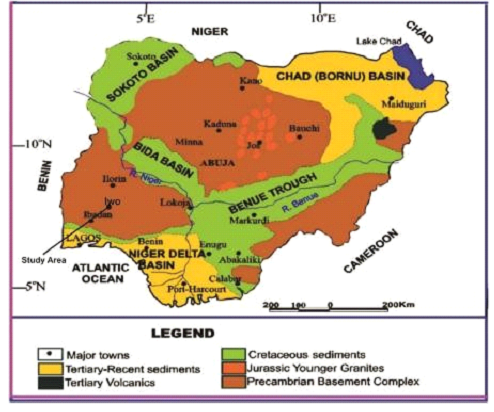
Figure 1: [19] Map of Nigeria showing the Geology of the study area
MATERIALS AND METHOD
The Geonics VLF-EM 16 and the OHMMEGA-Terrameter were used for the field investigation. In this study, five traverses of VLF-EM and dipole-dipole measurements were generated, as shown in Figure 2.
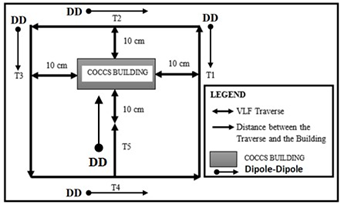
Figure 2: The Layout of the Study area
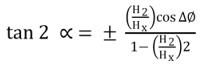
The VLF data were displayed as profiles and 2D sections using the KHFILT program (version 1.0), as described by [20; 21]. VLF-EM data was interpreted qualitative and quantitatively. The electromagnetic approach, according to [22; 23] assesses the bulk conductivity of the subsurface resources underneath, and between the transmitter and reception coil instruments. The theoretical fundamentals of VLF can be found in literature according to [24; 25; 26; 27; 28]. Thus, [29] reported that the magnetic field vertical and horizontal components are measured, actual and anomalous values are estimated, such that.
 (1)
(1)
However, ∝ denote the dip angles, H2 and Hx denotes the amplitudes and ![]() denote the Phase difference
denote the Phase difference
The geo-electrical resistivity data were displays as pseudo plots and interpreted qualitatively. The dipole-dipole measurement was used to determine the subsurface formation and the theoretical fundamental for dipole-dipole measurement as described by [30] is given below:
![]() (2)
(2)
Where ρa is the apparent resistivity, V is the voltage, I is the current
RESULTS AND DISCUSSION
The VLF-EM results from Figure 3 to 7 shows the percentage profiles of the raw real component and Q–factor values, plotted against the stations at a regular spacing. It was suggested by [10] that geological structures such as the faults, fractured and the geological contact or distressed basement are indicated by the positive peak zones. The peak positive of the anomaly changes vividly in the subsurface through the research are, inferring that the subsurface materials have varying weak and competent variations. Consequently, the Karous Hjelt and Fraser Filter software according to [20] was used to reveal the 2D corresponding pseudo-section models of the VLF-EM profiles over the five traverses. As regards to this, colour codes were used to represent the anomalous targets. Thus, [20] reported that the weak/fractured zone is shown with the colour code red.
Traverse 1: Figure (3a) shows the anomalies with varying degree of seven positive peak Q-factor components mapped as joints, fractures, fault or contact at distance 0-80 m on the filtered real and revealed a well pronounced three positive peaks at distance 20-25 m, 35-42 m and 55-60 m. These are zones of attention in fracture and fault finding in basement. Figure (3b) shows the corresponding K-H pseudo-section on the profile. The weak/fractured zones are evenly distributed along the profile. The 2D inverted model also reveals competent zones which are suspected to be lateritic/hardpan/basement formation.
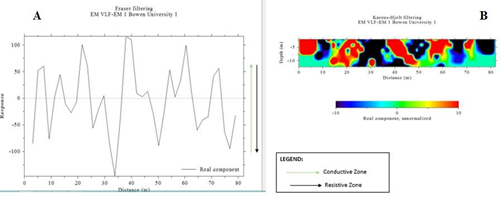
Figure 3: (a) VLF-EM Profiles, (b) K-H Pseudo-section along Traverse 1
Traverse 2: Figure (4a) shows the anomalies with varying degree of seven positive peak Q-factor components mapped as joints, fractures, fault or contact at distance 0-80 m on the filtered real and revealed a well pronounced two positive peaks at distance 35-40 m and 55-63 m. Figure (4b) revealed the corresponding K-H pseudo-section on the profile 2. The weak/fractured zones are evenly distributed along the profile. The inverted model confirms the peak as an anomalous weak/fractured zone between 10-13 m, and 65-70 m. Also, the inverted model obviously reveals a competent zone at 12-22 m, 35-45 m and 55-65 m respectively, which is typical of lateritic/basement formation.
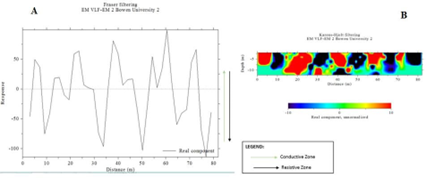
Figure 4: (a) VLF-EM Profiles, (b) K-H Pseudo-section along Traverse 2
Traverse 3: Figure (5a) shows the anomalies with varying degree of seven positive peak Q-factor components mapped as joints, fractures, fault or contact at distance 0-80 m on the filtered real and revealed a well pronounced three positive peaks at distance 15-20 m, 55-60 m and 65-70 m. Figure (5b) revealed the corresponding K-H pseudo-section on the profile 3. The conductivity zones are evenly distributed along the profile, since different features of varying degree of conductivity were delineated. The inverted model, on the other hand, clearly shows a resistive zone at 10-20 m, 25-30 m, and 50-55 m, which is indicative of lateritic/basement development.
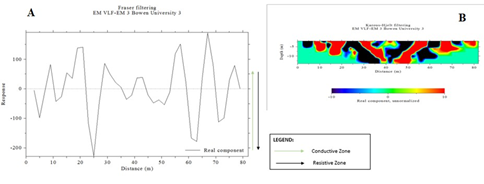
Figure 5: (a) VLF-EM Profiles, (b) K-H Pseudo-section along Traverse 3
Traverse 4: Figure (6a) shows the anomalies with varying degree of five positive peak Q-factor components mapped as joints, fractures, fault or contact at distance 0-80 m on the filtered real and revealed a well pronounced four positive peaks at distance 10-15 m, 15-20 m, 26-32 m and 55-64 m. Figure (6b) revealed the corresponding K-H pseudo-section on the profile. The weak/fractured zones are evenly distributed along the profile. The inverted model shows that the anomaly that manifests at 5-7 m, 20 m, 35-60 m and 70-80 m is an anomalous weak/fractured zone, while however; the model reveals a competent zone between 10-20 m, 35-40 m and 55-70 m.
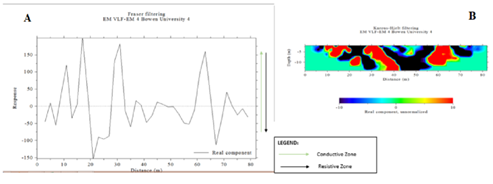
Figure 6: (a) VLF-EM Profiles, (b) K-H Pseudo-section along Traverse 4
Traverse 5: Figure (7a) shows the anomalies with varying degree of nine positive peak Q-factor components mapped as joints, fractures, fault or contact at distance 0-80 m on the filtered real and revealed a well pronounced two positive peaks at distance 15-22 m and 55-62 m. Figure (7b) revealed the corresponding K-H pseudo-section on the profile. The weak/fractured zones are evenly distributed along the profile. The inverted model shows that the anomalies are reliable weak/fractured zone 0-10 m, 18-20 m and 30-35 m respectively. Hence, the model further reveals patches of the competent zone along the transverse of 8-10 m and 45-50 m, respectively.
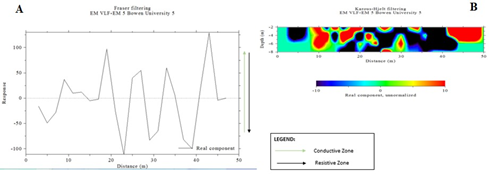
Figure 7: (a) VLF-EM Profiles, (b) K-H Pseudo-section along Traverse 5
The geo-electrical resistivity results from Figure 8-12 revealed the vertical and lateral variations of the subsurface. It reveals four subsurface layers such as the topsoil, weathered layer, fractured and fresh basement. The pseudo plots reveal the nature of the weak zones within the study area. Figure 8 is the 2D resistivity structures along traverse 1 within the study area. The near surface exhibits lateral resistivity fluctuation, indicating that the materials within it are heterogeneous, resulting in horizontal homogeneities, with resistivity value ranging 73-3023 Ωm. A low resistivity ranging from 31-611 Ωm is found about 0-25 m. Also, the basement is shallow at distance 60-80 m, which revealed the eastward dipping of the basement. The closely spaced contours’ altered gradient indicates faulting or fracture, which is obvious around 60-65 m.
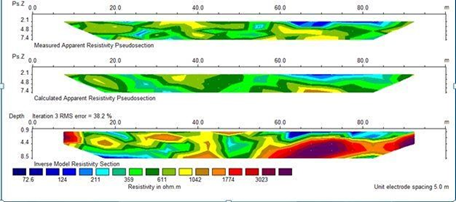
Figure 8:2 D resistivity inversion beneath 1(a) observed resistivity data, (b) Computed resistivity distribution and (c) inverted resistivity structure
Figure 9 shows 2 D resistivity structure along traverse 2 within the study area. However, the near surface show lateral variations in resistivity distribution which implies that the near surface material of the study area are not homogenous, leading to lateral in homogeneities, with the resistivity value ranging from 59-1986 Ωm. It revealed low resistivity values between 59-440 Ωm that is evident between distances 40-80 m. Hence, shallow basements are observed at depth of 0-8.5 m on both flanks from 55-60 m and reappear at 70-80 m. The closely spaced contours which suggest fracturing/faulting/lineament structure are evident between 0-30 m and 65.
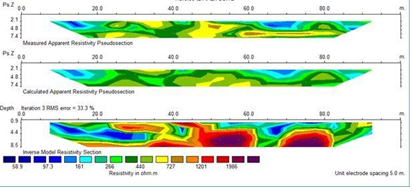
Figure 9:2 D resistivity inversion beneath 2(a) observed resistivity data, (b) Computed resistivity distribution and (c) inverted resistivity structure.
Figure 10 shows 2D resistivity structure along traverse 3 within the study area. However, the near surface show lateral variations in resistivity distribution which implies that the near surface materials of the study area are not homogenous, leading to lateral in homogeneities, with the resistivity value ranging from 8.4-2907 Ωm. It shows a low resistivity values from 84-637 Ωm which is evident between 0-80m. Hence, shallow basements at the both lines are evident, and the closely spaced contours from gradient change evidence at 0-80 m indicate fracturing/fault and or lineament structure.
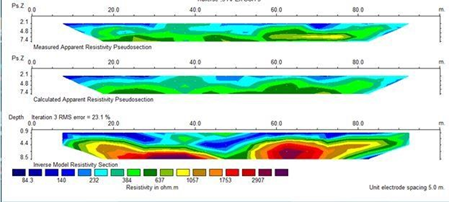
Figure 10:2 D resistivity inversion beneath 3(a) observed resistivity data, (b) Computed resistivity distribution and (c) inverted resistivity structure
Figure 11 shows 2D resistivity structure along traverse 4 within the study area. However, the near surface show lateral variations in resistivity distribution which implies that the near surface materials of the study area are not homogenous, leading to lateral inhomogeneity, with the resistivity value ranging from 9-2720 Ωm. It revealed low resistivity values ranging from 9-279 Ωm which is shown between 20-70 m. Hence, the shallow basements at both flanks are observed at the depth of 7.5-8.5 m and the closely spaced contours from gradient change evidence at 0-85 m indicate fracturing/fault and or lineament structure.
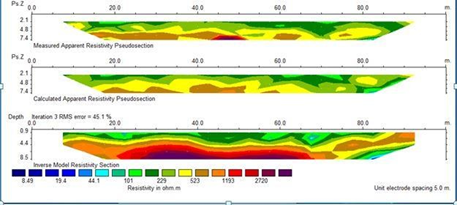
Figure 11:2 D resistivity inversion beneath 4(a) observed resistivity data, (b) Computed resistivity distribution and (c) inverted resistivity structure
Figure 12 shows 2D resistivity structure along traverse 5 within the study area. However, the near surface show lateral variations in resistivity distribution which implies the near surface materials are not homogenous, leading to lateral inhomogeneity, with the resistivity values ranging between 71-1711 Ωm. It reveals low resistivity values ranging from 71-439 Ωm which is evident at the distance range of 0-40 m and re-appear at 55-85 m. Hence, shallow basements at the depth of 4.4-8.5 m on both flanks are observed and the closely spaced contours from gradient change evidence at 0-85 m indicate fracturing/fault and lineament structure
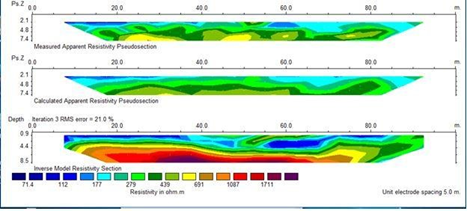
Figure 12:2 D resistivity inversion beneath 5(a) observed resistivity data, (b) Computed resistivity distribution and (c) inverted resistivity structure
SUMMARY OF THE RESULTS
Adequate geophysical survey was carried out within the study area; in doing this, two geophysical methods employing the dipole–dipole measurement and very low frequency electromagnetic method. The subsurface mapping findings indicated the presence of weak/fractured zones which are suggested to be the occurrence of geological structures such as fractures, faults and crack while the competent zone is suggested to be the occurrence of lateritic/basement formation. However, areas with weak/fractured zones are not good for engineering activities, since it will influence the type of foundation and the building that will be erected on the locations in the near or far future.
Consequently, the 2D geo-electrical resistivity map and VLF-EM pseudo-section delineated zones with presence of clayey formations. The dipole-dipole geophysical measurements were taken along the VLF-EM orientation. According to the sections, the clay layer creates the majority of the basement depressions in the region. The depression may be the consequence of groundwater’s preferred channeling and storage, which has caused feldspar and amphibolite-rich areas of the fresh basement to weather. [31] emphasized that silty-clay materials in a construction site are a major geotechnical problem in construction. According to [32] the fact is that swelling and shrinking of bedrock induced by conductive/fractured subsurface formations are only partially recoverable, and the adverse influences on infrastructures are also irreversible.
However, before construction, it is important to identify and research the possible difficulties that may be created by fractured bedrock so as to avoid costly corrective measures after possible construction. Also, when weak/fractured basement are identified, [33] highlighted the need for an artificial basement, which will help the foundation withstand any dynamic movement of the subsurface associated with structural failure, possibly resulting in death or property damage, since the foundation of structures is typically believed to be totally stable in structural analysis [34-38]. Therefore, the combination of the geophysical method should be employed in foundation studies, since it will help in a comprehensive investigation, particularly in virgin regions of the study area, before commencing the construction process.
CONCLUSIONS
The geophysical information obtained using the VLF-EM and geo-electrical resistivity method revealed the subsurface characteristics of the studied area, such as the weak/fractured zones. In addition it was evident that some part of the existing building around the study area is experiencing some structural failures such as cracks, which is not safe for the building stability. Furthermore, several anomalous zones were characterized by the methods, and it is determined from the complete interpretation that building collapses are caused by three factors: inadequate clay materials, near-surface structures such as fractures/or faults, and horizontal inhomogeneity. Therefore, the research concluded that the VLF-EM and dipole-dipole resistivity measurement is helpful and favourable for analyzing inadequate clay materials and near-surface features such as weak/fracture zones in engineering geophysical studies. The result of this research work should be used as a guide to any further engineering investigation within the study area. Thus, it is imperative to carry out detailed geophysical and also geotechnical study to further investigate the environments, especially in the virgin and the adjoining areas of the study area.
ACKNOWLEDGEMENTS
Bowen University is acknowledged for allowing us the time to conduct the research.
REFERENCE
- Telford, W.M., Geldart, L.P., Sheriff, R.E., D. A. and Keys, D.A. (1976). Applied Geophysics. Cambridge University pre (2nd Edition). Pp. 670.
- Adagunodo, T.A., Sunmonu, L.A., Adeniji, A. A. (2015). Effect of Dynamic Pattern of the Saprolitic Zone and its Basement on Building Stability: a Case Study of a High-Rise Building in Ogbomoso.Journal of Applied Physical Science International, 3(3): 106-115.
- Kurea, T.A.N., Daniela, I.H., Afuwaia, C.G., Adoyia, E. J. and Bellob, I.A. (2019). The Delineation of Groundwater and Geotechnical Parameters within Marmara Area of Chikun Local Government of Kaduna State. Nigeria Journal of the Nigerian Society of Physical Sciences: 1-5
- Oluwafemi, O. and Oladunjoye, M. A. (2019). Integration of surface electrical and electromagnetic prospecting methods for mapping overburden structures in Akungba-Akoko, Southwestern Nigeria. International Journal of Science and Technology, 2(1): 122-147.
- Khalil, M.A., Abbas, A.M., Santos, F.A.M., Mesbah, H.S. A. and Massoud, U. (2010). VLFEM study for archaeological investigation of the Labyrinth mortuary temple complex at Hawara area, Egypt. Near Surface Geophysics, 8 (3): 203-212.
- Chandran, D. and Anbazhagan, P. (2020). 2D non-linear site response analysis of shallow bedrock sites using integrated subsurface profiles. Annals of Geophysics, 63(4): 1-23.
- Sunmonu, L.A., Adagunodo, T.A., Adeniji, A. A. and Ajani, O.O. (2018). Geoimaging of subsurface fabric in Awgbagba, Southwestern Nigeria using geomagnetic and geoelectrical techniques. Malaysian Journal of Fundamental and Applied Sciences, 14(2): 312-324
- Loke M. H and Barker R. D. (1996). Practical techniques for 3D resistivity surveys and data inversion Geophys. Prospect, 44: 499-523
- J. Phillips and W. E. Richards. (1975). A study of the effectiveness of the VLF method for the location of narrow mineralized zones.Geo-exploration, 13: 215-226.
- Sundararajan, N., Babu, V.R., Prasad, N. S., Srinivas, Y. (2006). VLFPROS—A Matlab code for processing of VLF-EM data. Computers and Geosciences, 32: 1806-1813.
- Ammar A.I. and Kruse S.E. (2016). Resistivity soundings and VLF profiles for siting groundwater wells in a fractured basement aquifer in the Arabian Shield, Saudi Arabia. Journal of African Earth Sciences, 116: 56-67
- Soupios, P. M, Papazachos, C. B, Vargemezis, G. and Fikos, I. (2005). Application of modern seismic methods for geotechnical site characterization. Proc. Int. Workshop in Geoenvironment and Geotechnics: 163-70
- Tabbagh, A., Benderitter, Y., Andrieux, P., Decriaud, J.P., Guerin, R. (1991). VLF resistivity mapping and verticalisation of the electric field, Geophys. Prospect., 39: 1083-1097.
- Sharma, S. P. and Kaikkonen, P. (1998). Two-dimensional non-linear inversion of VLF-R data using simulated annealing. Geophysics. J. Int., 133: 649-668.
- Oskooi, B. and Pedersen, L. B. (2005). Comparison between VLF and RMT methods. A combined tool for mapping conductivity changes in the sedimentary cover. Journal of Applied Geophysics, 57: 227-241.
- Kayode, J.S., Adelusi, A.O., Nawawi, M.N. M., Bawallah, M. and Olowolafe, T.S. (2016). Geo-electrical investigation of near surface conductive structures suitable for groundwater accumulation in a resistive crystalline basement environment: A case study of Isuada, Southwestern Nigeria. Journal of African Earth Sciences, 119: 289-302.
- ABEM, A. B. (1990). ABEM Instructional Manual. ABEM AB, Bromma, Sweden, 47
- Akinloye, M.K., Fadipe, D. D. and Adabanija, M. A. (2002). A Radiometric mapping of the Ladoke Akintola University Compus, Ogbomoso Southwestern Nigeria. Science Focus, 1: 55-61.
- Obaje, N. G. (2009). Geology and mineral resources of Nigeria. Lecture notes in earth sciences, 120: 221.
- Karous, M. and Hjelt, S.E. (1983). Linear–Filtering of VLF dip-angle measurements, Geophysics. Prosp., 31: 782-894.
- Pirttijarvi, M. (2004). KH filt program. A geophysical software for Karous-Hjelt and Fraser Filtering on Geophysical VLF (very low frequency) Data: Geophysical Division, Department of Geosciences, University of Oulu. Finland.
- McNeill, J. D. (1990). Use of electromagnetic Methods for Groundwater studies. In ward, S.H. (Ed). Geotechnical and Environmental Geophysics. Review and turorial, Society of exploration Geophysicists Investigation, 1(5): 107-112
- Onu, N. N. and Ibe, K. M. (1998). Geophysical investigation for groundwater in Idah Lower Benue Trough, Nigeria. Nigeria Journal of Mining and Geology, 34(1): 45-53.
- McNeill, J. D. and Labson, V. F. (1991). Geological mapping using VLF radio fields. In: Nabighian, M.C. (Ed.)”, Geotechnical and Environmental Geophysics, Review and Tutorial, vol. 1. Society of Exploration, Tulsa, 191-218.
- Sharma, S. P. and Baranwal, V.C. (2005). Delineation of groundwater bearing fracture zones in a hard rock area integrating Very Low Frequency Electromagnetic and resistivity data. Journal of Applied Geophysics, 57: 155-166.
- Saydam, A. S. (1981). Very Low Frequency Electromagnetic Interpretation using tilt angle and ellipticity measurements. Geophysics, 46: 1594-1605.
- Bosch, F. P. and Müller, I. (2001). Continuous gradient VLF measurements: a new possibility for high resolution mapping of Karst structures. Technical report EAGE. First Break, 19: 343-350.
- Sharma, P. V. (1997). Environmental and Engineering Geophysics. Cambridge: Cambridge University Press.
- Sinha, A. K. (1990). Interpretation of ground VLF-EM data in terms of vertical conductor models. Geo-exploration, 26: 213-231
- Bakhtiar, Q. A. (2010). Note on Introduction to Electrical Resistivity. University of Sulaimni, Iraq
- Holtz, R. D. and Kovacs, W.D. (1981). An Introduction to Geotechnical Engineering”, Englewood Cliffs, NJ: Prentice Hall. Pp. 733
- Ajani, O.O., Adetoyinbo, A.A., Adeniji, A. A. and Omoliki, A.J. (2019). Geophysical Characterization of Abandoned Dumpsite Soil Properties for Pre-Foundation Delineation at Bowen University Campus, Iwo. Nigeria. Journal of Applied Sciences and Environmental Management, 23(1): 127-134.
- Farhadi, N., Saffari, H. and Torkzadeh, P. (2018). Evaluation of Seismic Behavior of Steel Moment Resisting Frames Considering Nonlinear Soil-structure Interaction.International Journal of Engineering (IJE), IJE Transactions A: Basics, 31(7): 1020-1027
- Sunmonu, L.A., Alagbe, O.A., Mabunmi, S.A., Adeniji, A.A., Olasunkanmi, N. K. (2013).
- Geophysical Investigation into the Cause(s) of Structural Failure within BACOSA and Faculty of Science Buildings, Bowen University Temporary Site, Iwo. Advances in Physics Theories and Applications, 25: 1-17.
- Adagunodo T.A., Adeniji A.A., Erinle A.V., Akinwumi S.A., Adewoyin O.O., Joel E.S., Kayode O.T. (2017). Geophysical Investigation into the Integrity of a Reclaimed Open Dumpsite for Civil Engineering Purpose. Interciencia Journal, 42(11): 324 – 339.
- Oyeyemi K.D., Olofinnade O.M., Aizebeokhai A.P., Ede A.N., Oladundoye M.A., Sanuade O.A., Adagunodo T.A., Joshua O., Nduka D.O. (2021). Geoenvironmental evaluation and chatacterization of near-surface subsoil for sustainable building construction: an integrated approach. In: Ksibi M. et al. (eds) Recent Advances in Environmental Science from the Euro-Mediterranean and Sorrounding Regions (2nd Edition). EMCEI 2019. Environmental Science and Engineering. https://doi.org/10.1007/978-3-030-51210-1_54
- Adagunodo T.A., Sunmonu L.A., Oladejo O.P., Olanrewaju A.M. (2019). Characterization of Soil Stability to withstand Erection of High-Rise Structure using Electrical Resistivity Tomography. In: Kallel A. et al. (eds.). Recent Advances in Geo-Environmental Engineering, Geomechanics and Geotechnics, and Geohazards. Advances in Science, Technology and Innovation (IEREK Interdisciplinary Series for Sustainable Development). https://doi.org/10.1007/978-3-030-01665-4_38 © Springer Nature Switzerland AG 2019. Print ISBN 978-3-030-01664-7, Online ISBN 978-3-030-01665-4.
- Oyeyemi K.D., Aizebeokhai A.P., Adagunodo T.A., Olofinnade O.M., Sanuade O.A., Olaojo A.A. (2017). Subsoil Characterization using Geoelectrical and Geotechnical Investigations: Implications for foundation Studies. International Journal of Civil Engineering and Technology, 8(10): 302 – 314.