
A Comparative Study of Some Heavy Metals in Fish and Sediments of Ikpoba River, Benin City, Nigeria
- Akinjagunla Akinmoladun
- Emmanuel Temiotan Ogbomida
- Miracle Okpaise Augustine
- Selina Ilunakan Omonmhenle
- 232-248
- Mar 31, 2025
- Chemistry
A Comparative Study of Some Heavy Metals in Fish and Sediments of Ikpoba River, Benin City, Nigeria
Akinjagunla Akinmoladun1*, Emmanuel Temiotan Ogbomida2, Miracle Okpaise Augustine3, Selina Ilunakan Omonmhenle4
1,2Ecotoxicology And Environmental Forensic Unit, National Centre for Energy and Environment, Energy Commission of Nigeria, University of Benin, Benin City, Edo State, Nigeria.
3,4Department Of Chemistry, Faculty of Physical Sciences, University of Benin, Benin City, Edo State, Nigeria.
*Corresponding Author
DOI: https://doi.org/10.51584/IJRIAS.2025.10030017
Received: 15 February 2025; Accepted: 26 February 2025; Published: 31 March 2025
ABSTRACT
A research on heavy metals in fish and sediment samples collected from Ikpoba River, Benin City, Nigeria, was analyzed and compared during the months of June and November, 2023. Heavy metals accumulations in fish is a concern as they absorbed essential and non-essential metals, storing them in their muscles, gills and liver. Atomic Absorption Spectrophotometer (AAS) analysis showed the presence of all ten selected heavy metals (Iron (Fe), Chromium (Cr), Manganese (Mn), Zinc (Zn), Lead (Pb), Copper (Cu), Arsenic (As), Cobalt (Co), Nickel (Ni), and Cadmium (Cd)) in both the fish species Coptodon zilli and sediment samples. However, sediment samples showed higher concentrations of heavy metals compared to the fish. Sediments exhibited higher levels of iron (Fe) and nickel (Ni) in June, and lower levels of cadmium (Cd) and lead (Pb) in November. The order of heavy metal concentration in sediments was as follows: June: Fe>Ni >Zn >Cr >Co >Mn>Pb> As >Cu >Cd; November: Fe >Ni >Cr >Co >Zn >Cd >As > Mg >Cu >Pb. Analysis of heavy metals in gill, liver, and muscle revealed that iron (Fe) had the highest concentration of heavy metals in the muscle, gill, and liver for both months, while copper (Cu) had the lowest concentration in these tissues, except for muscle, June, and liver, November. This analysis exceeded the maximum limits set by the World Health Organization (WHO), Food and Agricultural Organization (FAO) and National Environmental Standard and Regulation Enforcement Agency (NESREA) in both sediment and fish samples during June and November, except for Zinc (Zn) and Copper (Cu) in fish samples. Contaminated fish could cause potential damages to human. Therefore, precautionary measures and continuous monitoring of Ikpoba River is necessary.
Keywords: Comparative study, Heavy metals, Sediment, Coptodon zilli, Ikpoba River.
INTRODUCTION
Heavy metals are metals or metalloid having specific gravity greater than or equal to 5.0g/cm3 and atomic masses higher than 20 (Gunatilake, 2016; Al Qodah et al., 2017; Li et al., 2019). Heavy metals have garnered significant attention from both scientific communities and the general public due to their enduring presence, harmful effects, tendency to accumulate in organisms, and contribution to pollution (Fuentes et al., 2020; Cui et al., 2021; Gu et al., 2022). Moreover, biological aspects like species traits and trophic interactions impact their effects (Verkleji, 2009). While certain heavy metals play essential roles in organisms, being vital to enzymes and oxidation-reduction reactions (WHO/FAO/IAEA, 2010), others lack recognized biological functions and are considered non-essential (Tchounwou et al., 2008), including elements like aluminum, lead, and mercury. Heavy metals, including metalloids like arsenic, present toxicity risks even at low exposure levels (Duffus, 2010). In regions like Nigeria, rapid industrial, agricultural, and urban expansion has resulted in the untreated release of sewage into estuarine rivers, exacerbating the problem (Gu et al., 2022; Lu et al., 2022; Trottet et al., 2022). Natural processes like weathering and volcanic activity also contribute significantly (Fergusson, 2015). The persistently high concentration of heavy metals in these sediments serves as a record of both natural and human-induced sources of pollution (Cheng et al., 2021). Not only do these metals harm benthic environments, but they also pose health risks to humans through their transmission and amplification in food chains (Gu et al., 2022). The escalating buildup of heavy metals in our environment, particularly in coastal areas, poses a significant health hazard due to their toxicity, tendency to accumulate over time, and resistance to degradation. Consequently, there is growing awareness of the dangers posed by heavy metals, prompting governments to monitor and regulate toxic pollutant levels to protect public health (Ayandiran et al., 2009). Contamination pathways include corrosion, atmospheric deposition, and soil erosion (Nriagu, 2016). Mechanisms such as precipitation, sorption, and dissolution influence the destiny of heavy metals in aquatic surroundings (Abdel-Ghani and Elchaghaby, 2007), with sediment serving as the primary pathway of absorption and ultimate storage for heavy metal pollution, significantly impacting fish contamination (Gu et al., 2022). Heavy metal toxicity can adversely affect vital organs and may lead to chronic diseases such as cancer (Jarup, 2003). Given that fish constitute a significant component of the human diet, particularly in regions where they are economically accessible and rich in protein, the consumption of farmed fish may introduce harmful heavy metals into the human body, posing considerable health risks. To tackle these issues, the present study seeks to evaluate the levels of cadmium, chromium, copper, arsenic, iron, manganese, lead, cobalt, nickel and zinc found in the sediment, and fish within a fish farming hub located at Ikpoba River.
Statement of Problem
In Nigeria, several river systems face contamination from heavy metals, which originate from various sources such as municipal and domestic sewage, industrial discharges, mining operations, and agricultural drainage. Additionally, excessive use of fertilizers as well as pesticides exacerbates water quality degradation. Given the widespread availability and affordability of fish in the market across the country, they serve as a staple food for many Nigerians. However, fishes, being an essential component in the aquatic food chain, are highly susceptible to metal pollution. Consequently, they are considered key bioindicators for assessing metal pollution levels in aquatic environments. Fish can accumulate heavy metals from their food, sediment, and other aquatic organisms, posing risks to both public water supplies and consumers. Since heavy metals persist in the environment without natural breakdown, they bioaccumulate in higher-level consumers, leading to serious health problems and increased mortality rates.
Significance of Study
When the exact concentrations of metallic pollutants in fish and sediment are accurately identified, it becomes possible to alleviate their adverse impacts. The results of this investigation will enhance our comprehension of the concentrations of specific metals (such as Fe, Ni, Zn, Mg, Cu, Pb, As, Cd, Co, and Cr) in both fish tissue and sediment collected from Ikpoba River. This sets a foundation for subsequent research endeavors aimed at refining the data for policy making, proactive interventions, and initiatives ensuring human safety and environmental sustainability.
MATERIALS AND METHOD
Materials and Reagents
The apparatuses used in the research experiment include:
- Atomic Absorption Spectrophotometer (AAS)
- Laboratory oven
- Weighing balance
- Watch glass
- Teflon Crucible
Also, the reagents used are as follows:
- Hydrogen Trioxonitrate (v) acid (HNO3 65% suprapure),
- Hydrogen Chloride (HCl, 99%, Sigma aldrich),
- Distilled water
All chemicals utilized in the research were sourced from Merck and were of analytical grade.
Fish sample collection and identification
A number of Redbelly Tilapia (Coptodon zilli) were obtained with the assistance of local fishermen. Twenty-seven (27) Coptodon zilli fish samples were captured with gill-nets during June and November 2023, then promptly transported alive in ice chests to the laboratory. There, they were identified using FAO species distribution sheets, and their genders were distinguished through visual examination of gonads and the presence or absence of papillae.
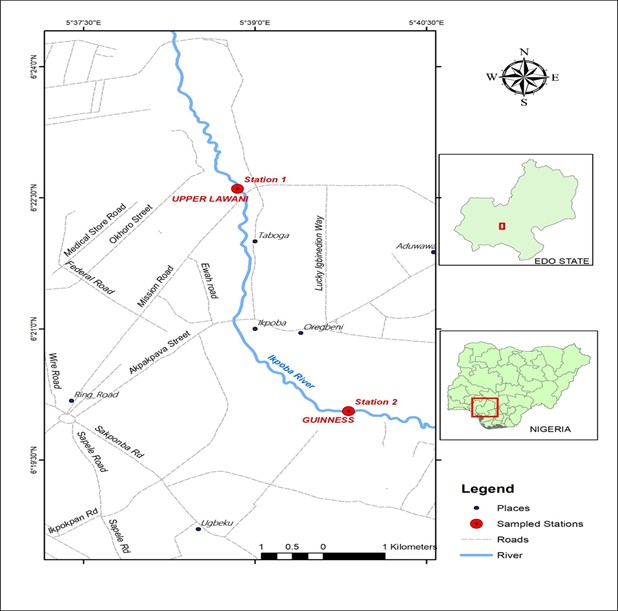
Figure 2.1: A map of Benin City showing sample location
Weighing and Dissection of Fish Samples
The fish specimens collected from Ikpoba River were measured using a digital weighing scale, and the measurements were meticulously recorded to the nearest gram. After weighing, the samples were carefully dissected using appropriate tools to isolate the muscle, gills, and liver from the head, viscera, and bones, following the procedure outlined by Nnaji et al. (2007).
Digestion of Fish Samples/Determination of Selected Heavy Metals
The fish specimens were subjected to digestion according to the established protocol detailed by Olaifa et al. (2004). Samples of the fish, encompassing the gill, liver, and muscle, were finely pulverized, with 5g of resultant powder deposited into each 10mL Teflon crucible. Following this, a combination of concentrated HCl and HNO3 (aqua-regia) in a 3:1 proportion was introduced into the crucibles containing the samples. These crucibles were then covered with watch glasses to facilitate the settling of the initial reaction. Subsequently, the samples were heated in a laboratory oven (NewLife DHG-9023A) at 30℃ for duration of 2 hours until the solution became clear and digestion was accomplished. Upon cooling to 25℃, 10mL of distilled water was introduced to each sample, and the resultant solution was filtered through Whatmann No.1 filter paper into 250mL volumetric flasks, followed by dilution with distilled water. The digests obtained were then analyzed for ten metallic elements using an Atomic Absorption Spectrophotometer (Brant AAS 320N). (Cd), (Cr), (Cu), (Co), (As), (Zn), (Fe), (Mn), (Ni), and (Pb) were identified and assessed utilizing an air-acetylene flame with an auto sampler. Each metallic element was subjected to triplicate analysis monthly to ensure precision, with the standard addition method utilized for correcting any matrix effects. Calibration of the instrument was conducted using standard solutions prepared from commercially available materials.
Sediment Sample Collection
Sediment samples were obtained in the months of June and November using plastic nylon seals from the sampling point. About 100g of sediment samples were collected from the Ikpoba River and stored in a thermo-cooler containing ice on board in the boat (transport ferry) to pressure the samples.
Heavy Metals Analyses in Sediment
Sediment sample collected from Ikpoba River was transported to the laboratory and then spread on a tray and air dried for 3 days. After air drying, the sediment sample was ground into smaller particles using mortar and pestle. It was sieved (0.45µm) and then digested according to the method of Adebayo (2017).
Statistical Analysis
Statistical computations and analyses were carried out utilizing Microsoft Excel. Specifically, descriptive statistics such as the mean, standard deviation, minimum, and maximum values were utilized to analyze the presence of heavy metals in the liver, gill, muscle, and sediment. These statistical measures offered important insights into the central tendency, variability, and range of heavy metal concentrations measured. Through the use of Excel’s built-in functions and formulas, we accurately computed these descriptive statistics. The outcomes aided in comprehending the distribution and attributes of the heavy metal data, facilitating the assessment of their levels and variability across the examined samples. These findings were critical for evaluating potential environmental impacts and guiding subsequent analyses and interpretations.
A correlation analysis was executed to investigate the connection between the fish’s morphometric parameters. Correlation analysis, a statistical method, was employed to ascertain the strength and direction of relationships between multiple variables. The objective was to detect any significant associations or dependencies among the morphometric parameters of the fish species under scrutiny. This analysis was conducted using both Excel and R. The results of the correlation analysis enabled us to evaluate the connections between the morphometric parameters, offering valuable insights into the physical characteristics of the fish. For generating the correlation matrix, I utilized the corplot and ggplot2 packages in R. These packages are widely adopted in data analysis and visualization endeavors. The corplot package facilitated efficient computation and visualization of correlation coefficients between variables, while ggplot2 provided versatile and visually appealing plotting capabilities. By harnessing the functionalities of these R packages, we gained understanding into the relationships among the variables under examination. The resulting correlation matrix played a pivotal role in our data analysis process, aiding in the identification of patterns and dependencies within the dataset.
RESULTS AND DISCUSSION
Results
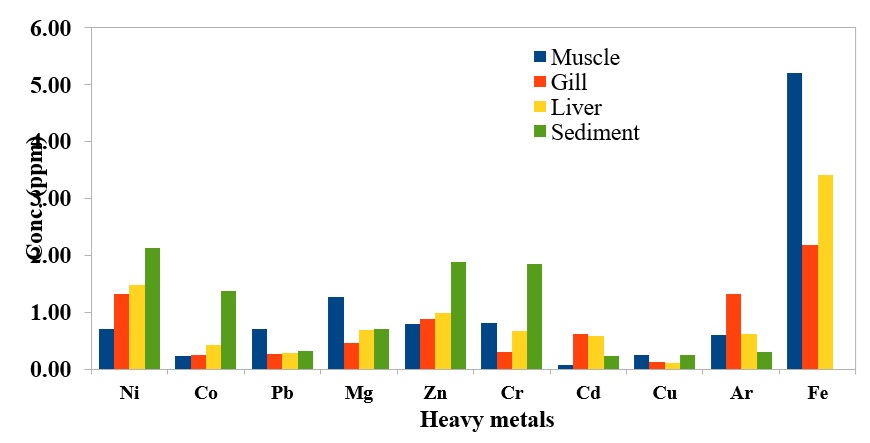
Fig. 3.1: June (Fe in Sediment: 120.4ppm)
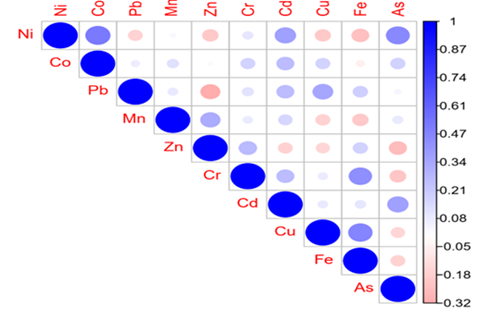
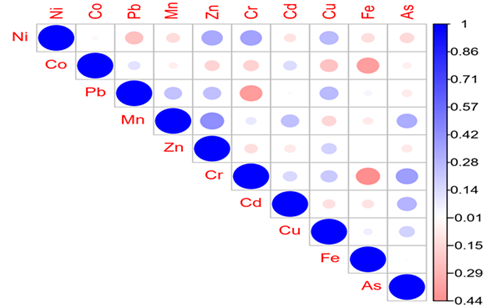
Fig. 3.3: June: Muscle Fig.3.4: June: Liver
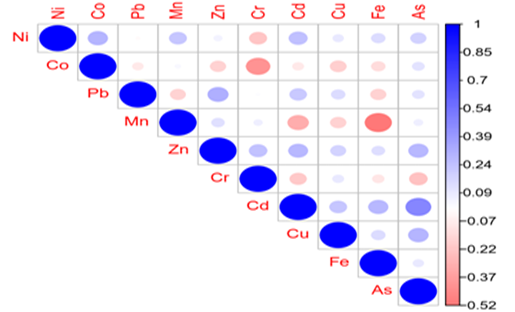
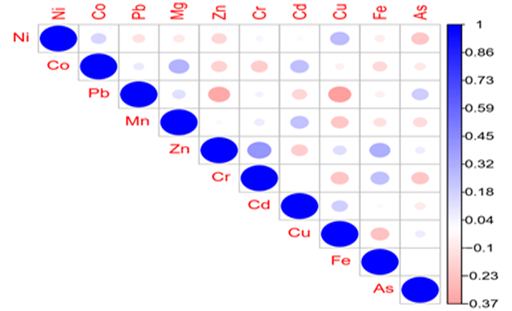
Fig. 3.5: June: Gills Fig. 3.6: June: Sediment
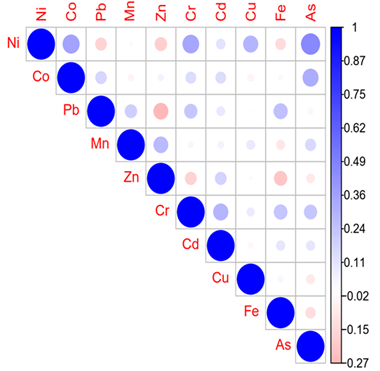
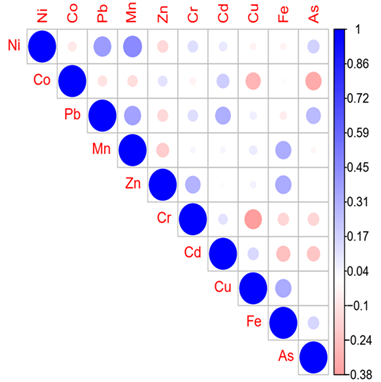
Fig.3.7: November: Muscle Fig.3.8: November: Liver
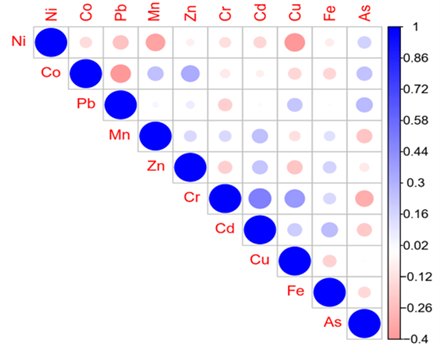
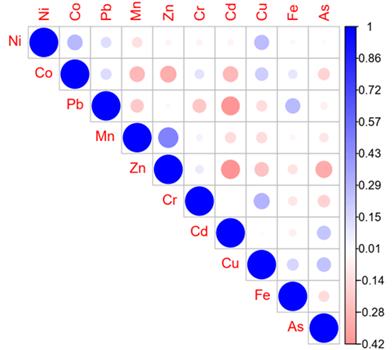
Fig.3.9: November: Gills Fig.3.10: November: Sediment
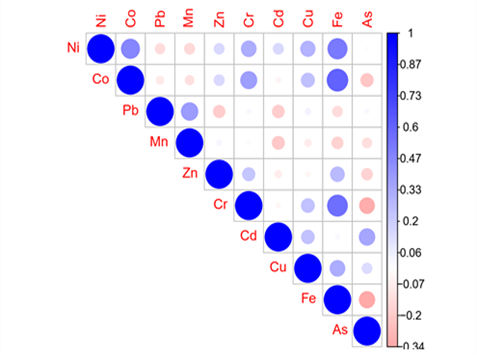
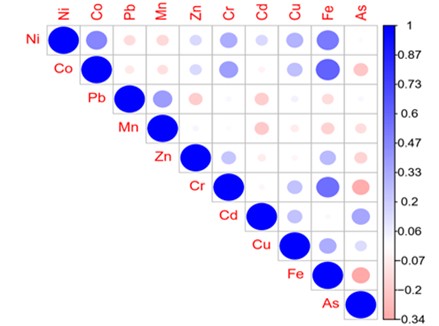
Fig.3.11: All Metals. Fig.3.12: Result of Morphometric correlation
Table 3.1: Concentration of 10 selected heavy
Table 3.1 concentration of 10 selected heavy metals (ppm) in the muscles, liver, gills and sediment (JUNE)
| Metals | Mean±SD | 1st Quart | 3rd Quart | Min | Max | |
| Muscle | Ni | 0.70±0.25 |
0.55 |
0.88 | 0.09 | 1.13 |
| Co | 0.23±0.08 | 0.16 | 0.30 | 0.03 | 0.36 | |
| Pb | 0.71±0.12 | 0.64 | 0.82 | 0.49 | 0.99 | |
| Mn | 1.26±0.64 | 0.69 | 1.89 | 0.03 | 2.15 | |
| Zn | 0.80±0.57 | 0.19 | 1.23 | 0.04 | 1.78 | |
| Cr | 0.81±0.32 | 0.64 | 1.00 | 0.23 | 1.43 | |
| Cd | 0.08±0.03 | 0.06 | 0.10 | 0.03 | 0.14 | |
| Cu | 0.25±0.00 | 0.24 | 0.25 | 0.23 | 0.25 | |
| Fe | 5.20±1.41 | 3.96 | 6.16 | 3.30 | 7.85 | |
| As | 0.61±0.06 | 0.57 | 0.64 | 0.50 | 0.73 | |
| Gills | Ni | 1.33±0.85 | 0.72 | 1.81 | 0.16 | 3.32 |
| Co | 0.25±0.16 | 0.13 | 0.39 | 0.00 | 0.66 | |
| Pb | 0.26±0.1 | 0.21 | 0.32 | 0.13 | 0.49 | |
| Mn | 0.46±0.3 | 0.24 | 0.68 | 0.06 | 1.27 | |
| Zn | 0.88±0.47 | 0.55 | 1.19 | 0.06 | 1.71 | |
| Cr | 0.30±0.03 | 0.28 | 0.31 | 0.23 | 0.35 | |
| Cd | 0.62±0.08 | 0.56 | 0.66 | 0.48 | 0.79 | |
| Cu | 0.13±0.02 | 0.12 | 0.14 | 0.09 | 0.17 | |
| Fe | 2.19±0.54 | 1.71 | 2.46 | 1.31 | 3.43 | |
| As | 1.32±0.07 | 1.29 | 1.36 | 1.16 | 1.45 | |
|
Liver |
Ni | 1.47±0.40 | 1.19 | 1.67 | 0.50 | 2.28 |
| Co | 0.42±0.05 | 0.40 | 0.45 | 0.31 | 0.49 | |
| Pb | 0.29±0.04 | 0.27 | 0.31 | 0.19 | 0.35 | |
| Mn | 0.69±0.31 | 0.54 | 0.89 | 0.24 | 1.28 | |
| Zn | 0.98±0.65 | 0.42 | 1.40 | 0.03 | 2.37 | |
| Cr | 0.67±0.59 | 0.12 | 1.30 | 0.02 | 1.67 | |
| Cd | 0.58±0.01 | 0.57 | 0.59 | 0.56 | 0.61 | |
| Cu | 0.11±0.03 | 0.08 | 0.13 | 0.06 | 0.17 | |
| Fe | 3.41±0.75 | 2.98 | 3.95 | 1.42 | 4.80 | |
| As | 0.62±0.11 | 0.55 | 0.69 | 0.39 | 0.82 | |
|
Sediment |
Ni | 2.13±0.45 | 1.92 | 2.26 | 1.06 | 3.02 |
| Co | 1.37±0.86 | 0.83 | 1.91 | 0.05 | 3.13 | |
| Pb | 0.32±0.21 | 0.16 | 0.48 | 0.01 | 0.79 | |
| Mn | 0.71±0.51 | 0.40 | 1.11 | 0.04 | 1.65 | |
| Zn | 1.88±0.8 | 1.28 | 2.36 | 0.78 | 4.17 | |
| Cr | 1.84±0.95 | 1.38 | 2.23 | 0.04 | 4.19 | |
| Cd | 0.22±0.16 | 0.13 | 0.35 | 0.00 | 0.60 | |
| Cu | 0.25±0.10 | 0.18 | 0.31 | 0.02 | 0.42 | |
| Fe | 120.42±11.3 | 111.90 | 129.04 | 101.53 | 143.50 | |
| As | 0.31±0.12 | 0.22 | 0.38 | 0.06 | 0.52 |
Table 3.2: Concentration of 10 selected heavy metals (ppm) in muscle, liver, gills and sediment (NOVEMBER)
| Metals | Mean±SD | 1st Quart | 3rd uart | Min | Max | |
| Muscle | Ni | 0.90±0.21 | 0.78 | 1.05 | 0.39 | 1.25 |
| Co | 0.42±0.24 | 0.18 | 0.63 | 0.09 | 0.84 | |
| Pb | 1.01±0.65 | 0.49 | 1.57 | 0.17 | 2.68 | |
| Mn | 1.50±0.78 | 0.79 | 2.25 | 0.02 | 2.57 | |
| Zn | 0.79±0.53 | 0.28 | 1.20 | 0.04 | 1.66 | |
| Cr | 1.04±0.77 | 0.50 | 1.53 | 0.10 | 2.90 | |
| Cd | 0.20±0.15 | 0.11 | 0.29 | 0.02 | 0.50 | |
| Cu | 0.18±0.09 | 0.11 | 0.26 | 0.02 | 0.35 | |
| Fe | 5.76±2.11 | 4.18 | 7.42 | 2.13 | 9.85 | |
| As | 0.68±0.49 | 0.24 | 0.98 | 0.00 | 1.59 | |
| Gills | Ni | 1.54±0.35 | 1.23 | 1.78 | 1.06 | 2.19 |
| Co | 0.47±0.3 | 0.24 | 0.62 | 0.03 | 1.15 | |
| Pb | 0.51±0.33 | 0.27 | 0.70 | 0.06 | 1.29 | |
| Mn | 0.74±0.48 | 0.37 | 0.94 | 0.07 | 1.87 | |
| Zn | 1.00±0.82 | 0.36 | 1.34 | 0.09 | 2.80 | |
| Cr | 0.55±0.44 | 0.20 | 0.81 | 0.02 | 1.62 | |
| Cd | 1.09±0.63 | 0.61 | 1.50 | 0.09 | 2.23 | |
| Cu | 0.47±0.31 | 0.26 | 0.69 | 0.12 | 1.38 | |
| Fe | 3.32±2.49 | 1.60 | 4.67 | 0.35 | 9.43 | |
| As | 1.81±0.95 | 1.10 | 2.64 | 0.47 | 4.20 | |
|
Liver |
Ni | 1.78±1.04 | 0.85 | 2.31 | 0.10 | 4.16 |
| Co | 0.81±0.61 | 0.28 | 1.08 | 0.03 | 2.41 | |
| Pb | 0.60±0.48 | 0.24 | 0.98 | 0.03 | 1.79 | |
| Mn | 0.99±0.83 | 0.19 | 1.87 | 0.03 | 2.38 | |
| Zn | 1.15±0.59 | 0.67 | 1.53 | 0.15 | 2.37 | |
| Cr | 0.94±0.79 | 0.35 | 1.31 | 0.06 | 2.66 | |
| Cd | 0.16±0.12 | 0.07 | 0.24 | 0.00 | 0.42 | |
| Cu | 0.39±0.3 | 0.13 | 0.65 | 0.00 | 0.90 | |
| Fe | 4.18±1.85 | 2.75 | 5.10 | 0.58 | 8.04 | |
| As | 0.92±0.56 | 0.63 | 1.27 | 0.00 | 2.20 | |
|
Sediment |
Ni | 2.63±1.22 | 1.71 | 3.57 | 0.59 | 5.19 |
| Co | 1.54±1.1 | 0.62 | 2.49 | 0.06 | 3.89 | |
| Pb | 0.49±0.24 | 0.28 | 0.63 | 0.07 | 0.93 | |
| Mn | 0.62±0.42 | 0.36 | 0.78 | 0.04 | 1.76 | |
| Zn | 0.98±0.6 | 0.53 | 1.36 | 0.07 | 2.61 | |
| Cr | 2.12±1.46 | 1.13 | 3.26 | 0.24 | 4.81 | |
| Cd | 0.70±0.53 | 0.35 | 1.00 | 0.01 | 2.07 | |
| Cu | 0.57±0.31 | 0.33 | 0.77 | 0.07 | 1.17 | |
| Fe | 142.95±32.17 | 128.25 | 152.34 | 67.02 | 206.21 | |
| As | 0.66±0.41 | 0.39 | 0.90 | 0.03 | 1.50 |
Table 3.3: Heavy metals correlation
| Ni | Co | Pb | Mn | Zn | Cr | Cd | Cu | Fe | As | |
| Ni | 1 | |||||||||
| Co | 0.47 | 1 | ||||||||
| Pb | -0.13 | -0.08 | 1 | |||||||
| Mn | -0.15 | -0.11 | 0.39 | 1 | ||||||
| Zn | 0.14 | 0.15 | -0.19 | 0.04 | 1 | |||||
| Cr | 0.31 | 0.37 | 0.03 | 0.02 | 0.22 | 1 | ||||
| Cd | 0.15 | -0.04 | -0.2 | -0.21 | -0.07 | -0.03 | 1 | |||
| Cu | 0.29 | 0.25 | 0.05 | -0.07 | -0.03 | 0.24 | 0.23 | 1 | ||
| Fe | 0.52 | 0.6 | -0.14 | -0.18 | 0.27 | 0.56 | 0.02 | 0.23 | 1 | |
| As | -0.02 | -0.22 | 0.03 | -0.12 | -0.17 | -0.31 | 0.34 | 0.02 | -0.34 | 1 |
Permissible limits (ppm) for Heavy metals
Table 3.5: Experimental dimensions of fish sample (Coptodon zilli)
| Head length | Head height | Head width | Eye diameter | Mouth width | Mouth height | Upper jaw length | Lower jaw length | Anal length |
| H.l | H.h | H.w | E.d | M.w | M.h | U.j.l | L.j.l | A.l |
| 4.50 | 5.70 | 3.40 | 1.40 | 1.30 | 2.50 | 1.30 | 1.20 | 0.50 |
| 3.30 | 4.30 | 3.00 | 0.80 | 1.00 | 1.50 | 0.90 | 0.90 | 0.40 |
| 2.90 | 4.00 | 2.70 | 0.60 | 0.80 | 1.30 | 0.60 | 0.70 | 0.30 |
| 2.30 | 3.50 | 2.10 | 0.30 | 0.50 | 0.60 | 0.40 | 0.50 | 0.10 |
| 1.90 | 3.00 | 1.50 | 0.10 | 0.20 | 0.10 | 0.20 | 0.20 | 0.10 |
| 4.05 | 5.13 | 3.06 | 1.26 | 1.17 | 2.25 | 1.17 | 1.08 | 0.45 |
| 2.97 | 3.87 | 2.70 | 0.72 | 0.90 | 1.35 | 0.81 | 0.81 | 0.36 |
| 2.61 | 3.60 | 2.43 | 0.54 | 0.72 | 1.17 | 0.54 | 0.63 | 0.27 |
| 2.07 | 3.15 | 1.89 | 0.27 | 0.45 | 0.54 | 0.36 | 0.45 | 0.09 |
| 1.71 | 2.70 | 1.35 | 0.09 | 0.18 | 0.09 | 0.18 | 0.18 | 0.09 |
| 3.65 | 4.62 | 2.75 | 1.13 | 1.05 | 2.03 | 1.05 | 0.97 | 0.41 |
| 2.67 | 3.48 | 2.43 | 0.65 | 0.81 | 1.22 | 0.73 | 0.73 | 0.32 |
| 2.35 | 3.24 | 2.19 | 0.49 | 0.65 | 1.05 | 0.49 | 0.57 | 0.24 |
| 1.86 | 2.84 | 1.70 | 0.24 | 0.41 | 0.49 | 0.32 | 0.41 | 0.08 |
| 1.54 | 2.43 | 1.22 | 0.08 | 0.16 | 0.08 | 0.16 | 0.16 | 0.08 |
| 3.28 | 4.16 | 2.48 | 1.02 | 0.95 | 1.82 | 0.95 | 0.87 | 0.36 |
| 2.41 | 3.13 | 2.19 | 0.58 | 0.73 | 1.09 | 0.66 | 0.66 | 0.29 |
| 2.11 | 2.92 | 1.97 | 0.44 | 0.58 | 0.95 | 0.44 | 0.51 | 0.22 |
| 1.68 | 2.55 | 1.53 | 0.22 | 0.36 | 0.44 | 0.29 | 0.36 | 0.07 |
| 1.39 | 2.19 | 1.09 | 0.07 | 0.15 | 0.07 | 0.15 | 0.15 | 0.07 |
| 2.95 | 3.74 | 2.23 | 0.92 | 0.85 | 1.64 | 0.85 | 0.79 | 0.33 |
| 2.17 | 2.82 | 1.97 | 0.52 | 0.66 | 0.98 | 0.59 | 0.59 | 0.26 |
| 1.90 | 2.62 | 1.77 | 0.39 | 0.52 | 0.85 | 0.39 | 0.46 | 0.20 |
| 1.51 | 2.30 | 1.38 | 0.20 | 0.33 | 0.39 | 0.26 | 0.33 | 0.07 |
| 1.25 | 1.97 | 0.98 | 0.07 | 0.13 | 0.07 | 0.13 | 0.13 | 0.07 |
| 3.65 | 4.62 | 2.75 | 1.13 | 1.05 | 2.03 | 1.05 | 0.97 | 0.41 |
Table 3.6: Result of matrices morphometric correlation
| B.w | T.l | S.l | G.l | B.d | Max.h | Max.w | H.l | H.h | H.w | E.d | M.w | M.h | U.j.l | L.j.l | A.l | |
| B.w | 1.00 | |||||||||||||||
| T.l | 0.90 | 1.00 | ||||||||||||||
| S.l | 0.91 | 0.98 | 1.00 | |||||||||||||
| G.l | 0.94 | 0.99 | 0.99 | 1.00 | ||||||||||||
| B.d | 0.92 | 0.99 | 0.96 | 0.98 | 1.00 | |||||||||||
| Max.h | 0.95 | 0.99 | 0.99 | 1.00 | 0.98 | 1.00 | ||||||||||
| Max.w | 0.85 | 0.96 | 0.90 | 0.93 | 0.98 | 0.93 | 1.00 | |||||||||
| H.l | 0.91 | 1.00 | 0.98 | 0.99 | 0.99 | 0.99 | 0.96 | 1.00 | ||||||||
| H.h | 0.89 | 0.99 | 1.00 | 0.99 | 0.96 | 0.99 | 0.92 | 0.99 | 1.00 | |||||||
| H.w | 0.76 | 0.96 | 0.93 | 0.92 | 0.94 | 0.91 | 0.95 | 0.96 | 0.95 | 1.00 | ||||||
| E.d | 0.93 | 0.97 | 0.93 | 0.96 | 0.99 | 0.96 | 0.98 | 0.97 | 0.93 | 0.91 | 1.00 | |||||
| M.w | 0.83 | 0.96 | 0.91 | 0.93 | 0.97 | 0.93 | 1.00 | 0.96 | 0.92 | 0.97 | 0.97 | 1.00 | ||||
| M.h | 0.90 | 0.97 | 0.92 | 0.94 | 0.98 | 0.95 | 0.99 | 0.96 | 0.92 | 0.93 | 0.99 | 0.99 | 1.00 | |||
| U.j.l | 0.90 | 0.97 | 0.93 | 0.96 | 0.99 | 0.95 | 0.99 | 0.97 | 0.93 | 0.93 | 0.99 | 0.98 | 0.98 | 1.00 | ||
| L.j.l | 0.85 | 0.97 | 0.93 | 0.94 | 0.98 | 0.94 | 0.99 | 0.97 | 0.93 | 0.97 | 0.98 | 1.00 | 0.99 | 0.99 | 1.00 | |
| A.l | 0.81 | 0.95 | 0.86 | 0.91 | 0.96 | 0.89 | 0.98 | 0.94 | 0.89 | 0.93 | 0.96 | 0.97 | 0.96 | 0.97 | 0.96 | 1.00 |
Key:
| Abbreviation | Full meaning |
| B.W | Body weight |
| T.L | Total length |
| S.L | Standard length |
| G.L | Girth length |
| B.D | Body depth |
| Max.H | Max. height |
| Max.W | Max. width |
| H.L | Head length |
| H.H | Head height |
| H.W | Head width |
| E.D | Eye diameter |
| M.W | Mouth width |
| M.H | Mouth height |
| U.J.L | Upper jaw length |
| L.J.L | Lower jaw length |
| A.L | Anal length |
Table 3.7: Morphometrics of fish sample (Coptodon zilli)
| B.W | T.L | S.L | G.L | B.D | Max. H | Max. W | H.L | H.H | H.W | E.D | M.W | M.H | U.J.L | L.J.L | A.L |
| 89.00 | 16.50 | 12.70 | 15.00 | 7.00 | 6.50 | 1.10 | 4.50 | 5.70 | 3.40 | 1.40 | 1.30 | 2.50 | 1.30 | 1.20 | 0.50 |
| 32.00 | 12.20 | 9.00 | 10.50 | 4.80 | 4.20 | 0.80 | 3.30 | 4.30 | 3.00 | 0.80 | 1.00 | 1.50 | 0.90 | 0.90 | 0.40 |
| 28.00 | 10.80 | 8.60 | 9.00 | 3.90 | 3.90 | 0.60 | 2.90 | 4.00 | 2.70 | 0.60 | 0.80 | 1.30 | 0.60 | 0.70 | 0.30 |
| 22.00 | 8.30 | 7.80 | 7.80 | 2.70 | 3.30 | 0.30 | 2.30 | 3.50 | 2.10 | 0.30 | 0.50 | 0.60 | 0.40 | 0.50 | 0.10 |
| 18.00 | 7.00 | 6.30 | 6.80 | 2.10 | 2.70 | 0.10 | 1.90 | 3.00 | 1.50 | 0.10 | 0.20 | 0.10 | 0.20 | 0.20 | 0.10 |
| 80.10 | 14.85 | 11.43 | 13.50 | 6.30 | 5.85 | 0.99 | 4.05 | 5.13 | 3.06 | 1.26 | 1.17 | 2.25 | 1.17 | 1.08 | 0.45 |
| 28.80 | 10.98 | 8.10 | 9.45 | 4.32 | 3.78 | 0.72 | 2.97 | 3.87 | 2.70 | 0.72 | 0.90 | 1.35 | 0.81 | 0.81 | 0.36 |
| 25.20 | 9.72 | 7.74 | 8.10 | 3.51 | 3.51 | 0.54 | 2.61 | 3.60 | 2.43 | 0.54 | 0.72 | 1.17 | 0.54 | 0.63 | 0.27 |
| 19.80 | 7.47 | 7.02 | 7.02 | 2.43 | 2.97 | 0.27 | 2.07 | 3.15 | 1.89 | 0.27 | 0.45 | 0.54 | 0.36 | 0.45 | 0.09 |
| 16.20 | 6.30 | 5.67 | 6.12 | 1.89 | 2.43 | 0.09 | 1.71 | 2.70 | 1.35 | 0.09 | 0.18 | 0.09 | 0.18 | 0.18 | 0.09 |
| 72.09 | 13.37 | 10.29 | 12.15 | 5.67 | 5.27 | 0.89 | 3.65 | 4.62 | 2.75 | 1.13 | 1.05 | 2.03 | 1.05 | 0.97 | 0.41 |
| 25.92 | 9.88 | 7.29 | 8.51 | 3.89 | 3.40 | 0.65 | 2.67 | 3.48 | 2.43 | 0.65 | 0.81 | 1.22 | 0.73 | 0.73 | 0.32 |
| 22.68 | 8.75 | 6.97 | 7.29 | 3.16 | 3.16 | 0.49 | 2.35 | 3.24 | 2.19 | 0.49 | 0.65 | 1.05 | 0.49 | 0.57 | 0.24 |
| 17.82 | 6.72 | 6.32 | 6.32 | 2.19 | 2.67 | 0.24 | 1.86 | 2.84 | 1.70 | 0.24 | 0.41 | 0.49 | 0.32 | 0.41 | 0.08 |
| 14.58 | 5.67 | 5.10 | 5.51 | 1.70 | 2.19 | 0.08 | 1.54 | 2.43 | 1.22 | 0.08 | 0.16 | 0.08 | 0.16 | 0.16 | 0.08 |
| 64.88 | 12.03 | 9.26 | 10.94 | 5.10 | 4.74 | 0.80 | 3.28 | 4.16 | 2.48 | 1.02 | 0.95 | 1.82 | 0.95 | 0.87 | 0.36 |
| 23.33 | 8.89 | 6.56 | 7.65 | 3.50 | 3.06 | 0.58 | 2.41 | 3.13 | 2.19 | 0.58 | 0.73 | 1.09 | 0.66 | 0.66 | 0.29 |
| 20.41 | 7.87 | 6.27 | 6.56 | 2.84 | 2.84 | 0.44 | 2.11 | 2.92 | 1.97 | 0.44 | 0.58 | 0.95 | 0.44 | 0.51 | 0.22 |
| 16.04 | 6.05 | 5.69 | 5.69 | 1.97 | 2.41 | 0.22 | 1.68 | 2.55 | 1.53 | 0.22 | 0.36 | 0.44 | 0.29 | 0.36 | 0.07 |
| 13.12 | 5.10 | 4.59 | 4.96 | 1.53 | 1.97 | 0.07 | 1.39 | 2.19 | 1.09 | 0.07 | 0.15 | 0.07 | 0.15 | 0.15 | 0.07 |
| 58.39 | 10.83 | 8.33 | 9.84 | 4.59 | 4.26 | 0.72 | 2.95 | 3.74 | 2.23 | 0.92 | 0.85 | 1.64 | 0.85 | 0.79 | 0.33 |
| 21.00 | 8.00 | 5.90 | 6.89 | 3.15 | 2.76 | 0.52 | 2.17 | 2.82 | 1.97 | 0.52 | 0.66 | 0.98 | 0.59 | 0.59 | 0.26 |
| 18.37 | 7.09 | 5.64 | 5.90 | 2.56 | 2.56 | 0.39 | 1.90 | 2.62 | 1.77 | 0.39 | 0.52 | 0.85 | 0.39 | 0.46 | 0.20 |
| 14.43 | 5.45 | 5.12 | 5.12 | 1.77 | 2.17 | 0.20 | 1.51 | 2.30 | 1.38 | 0.20 | 0.33 | 0.39 | 0.26 | 0.33 | 0.07 |
| 11.81 | 4.59 | 4.13 | 4.46 | 1.38 | 1.77 | 0.07 | 1.25 | 1.97 | 0.98 | 0.07 | 0.13 | 0.07 | 0.13 | 0.13 | 0.07 |
DISCUSSION
This investigation found that all 10 chosen heavy metals examined were present in both the fish (Coptodon zilli) and sediment of the Ikpoba River. Nonetheless, the sediment contained a higher accumulation of heavy metals compared to the fish samples, a phenomenon observed by various researchers in this field, including Ambedkar et al, (2012); Adejare et al, (2011); Aderinola et al, (2009); Asaolu et al, (2004); Obire et al, (2003); Adeyeye et al, (1996, 1994); Bowler et al. (1979) among others. The elevated concentrations of heavy metals in sediment samples compared to fish samples may be attributed to pollutants discharged into the aquatic environment, which are absorbed into the sediments rather than remaining in the aqueous phase. The sediments exhibited high levels of Iron (Fe) and Nickel (Ni) and low levels of Cadmium (Cd) and Lead (Pb) in June and November, respectively. The heavy metal concentration trend in June was Fe > Ni > Zn > Cr > Co > Mn > Pb > As > Cu > Cd, consistent with data from the Godavari River and its tributaries by Hussain et al. (2017). In November, the trend was Fe > Ni > Cr > Co > Zn > Cd > As > Mg > Cu > Pb. Except for Zn and Mn, the concentration of heavy metals in November’s sediments was higher than in June’s, with respective values of (1.88±0.80 vs 0.98±0.6) and (0.71±0.51 vs 0.6±0.4). The high concentration of Fe, Ni, Co, Zn, and Cr in the sediment may be due to human activities such as untreated sewage discharge, pollution, and the use of metals and industrial materials containing metals, along with the sediment’s ability to act as a sink. In water bodies, heavy metals bind to sediment through processes like adsorption and co-precipitation by iron and manganese hydroxides and oxides, adsorption in mineral clays, precipitation with organic matter, hydrolytic reactions of ions and dissolved complexes, and other natural mechanisms related to sediment physicochemical characteristics (Bruder et al., 2002; Sutherland and Tack, 2002). River sediments serve as integrators and concentrators of metals (Garcia et al., 2004). The concentrations of metals in the fish from the study location exceeded safe limits set by the Food and Agriculture Organization (FAO) and the World Health Organization (WHO) for fish, except for Zinc (Zn) and Copper (Cu), respectively.
Table 3.1 & Table 3.2 showed heavy metals concentration for the two months in the gills, liver and muscle of Coptodon zilli. The trend is as follows:
MUSCLE
June: Fe >Mn> Cr > Zn >Pb> Ni > As > Cu > Co > Cd.
November: Fe >Mn>Cr >Pb> Ni > Zn > As > Co > Cd > Cu.
GILLS
June: Fe > Ni > As > Zn > Cd >Mn> Cr >Pb> Co > Cu.
November: Fe > As > Ni > Cd > Zn >Mn> Cr >Pb> Co > Cu.
LIVER
June: Fe > Ni > Zn >Mn> Cr > As > Cd > Co >Pb> Cu.
November: Fe > Ni > Zn >Mn> Cr > As > Co >Pb> Cu > Cd.
The results obtained from the analysis of heavy metals in the gills, liver and muscle showed that Iron (Fe) had the highest concentration in the muscle, gills and liver for the two months (June and November) and Copper (Cu) had the lowest concentration in the muscle, gills and liver for the two months except in muscle for the month of June and in liver for the month of November. The level of heavy metals concentration in the muscle of the fish in the month of June is similar to the data obtained from a Godavari River and tributaries by Hussian et al., (2017). The highest content of iron (Fe) in the sediment and fish may be due to clayed material and discharge of untreated effluents from the Guinness Brewery Company close to Ikpoba River. Also, the result may be due to run-offs and geological formations of the sample locations (Aremu et al., 2008). All 10 selected heavy metals examined were found to exceed the maximum limits: (p<0.05), (p<0.01) and (p<0.03) set by WHO and FAO in both in the sediment and in the fish, except Zn and Cu with (p<5.00) and (p<1.50), (1.88± 0.8) and (0.25± 0.10) and fish (0.98± 0.65) (0.11± 0.03) respectively. Table 3.3 showed the analysis of heavy metals in the sediments and matrices correlation between the heavy metals concentration in Ikpoba River in the month of June and November 2023. The deduction from the table was as follows:
- A perfect positive correlation exists between all the heavy metals
- Insignificant correlation exists between all the heavy metals except for As and Fe
- Weak negative correlation exists only between the Fe and Cr
- Weak positive correlation exists between Ni, Pb, Co, and Cd
- A moderate positive correlation exists between Ni, Co, and Cr.
Table 3.5 shows the morphometric correlation among the dimensions of the fish
1. A perfect positive correlation exists between the following:
- Head Length (HL) and Total Length (TL)
- Head Height (HH) and Standard Length (SL)
- Mouth Width (MW) and Max. Width (Max.H)
- Lower Jaw Length (LJL) and Mouth Width (M.W)
- Height (Max.H) and Girth Length (GL).
2. There is no existence of perfect weak and strong negative correlation.
3. Strong positive correlation exists in all dimensions of the fish except in the Anal length (AL).
From Tab.3.1 and 3.2, the trend of heavy metals in the fish organs and in the sediment is as follows:
JUNE
Fe: Sediment > Muscle > Liver > Gills
Ni: Sediment > Liver > Gills > Muscle
Zn: Sediment > Liver > Gills > muscle
Cr: Sediment > Muscle > Liver > Gills
Co: Sediment > Liver > Gills > Muscle
Mn: Muscle > Sediment > Liver > Gills
As: Gills > Liver > Muscle > Sediment
Pb: Muscle > Sediment > Liver > Gills
Cd: Gills > Liver > Sediment > Muscle
Cu: Sediment > _ Muscle > Gills > Liver
NOVEMBER
Fe: Sediment > Muscle > Liver > Gill
Ni: Sediment > Liver > Gills > Muscle
Zn: Sediment > Liver > Gills > Muscle
Cr: Sediment > Muscle > Liver > Gill
Pb: Muscle > Sediment > Liver > Gill
Cu: Sediment > Gills > Liver > Muscle
Cd: Sediment > Gills > Muscle > Liver
Co: Sediment > Liver > Gills > Muscle
Mn: Muscle > Liver > Gills > Sediment
As: Gills > Liver > Muscle > Sediment
All examined metals followed the same trend in both months of study except Manganese (Mn), Cadmium (Cd) and Copper (Cu)
CONCLUSION
The result of this study showed that all ten heavy metals analyzed in both fish and sediments were present and their concentrations were all above the permissible limits set by WHO/FAO and NESREA, except Cu and Zn. Therefore, precautionary measures and continuous monitoring of Ikpoba River is necessary.
REFERENCES
- Abdel-Ghani N. T, Elchaghaby G.A., (2007). Influence of operating conditions on the removal of Cu, Zn, Cd and Pb ions from wastewater by adsorption. International journal of Environmental Science and Technology.4:451–456.
- Adebayo, I.A., (2017). Determination of heavy metals in water, fish and sediment from Ureje water reservoir. Journal of Environmental and Analytical Toxicology, 7(4), pp. 1-4.
- Adejare, L.I., Balogun, K.J. and Shelle, R.O, (2011). Hydro-chemistry and levels of some heavy metals in samples ofIbeshe, Lagos lagoon complex, Nigeria. Journal of Ameri-can Science, 7(1): 625-63.
- Aderinola, O.J., Clarke, E.O., Olarinmoye, O.M., Kusemiju,V. and Anatekhai, M.A. (2009). Heavy metals in surfacewaters, sediments and periwinkles of Lagos lagoon. American-Eurasian J. Agric. & Environmental Sci., 5(5): 609-617.
- Adeyeye, E.I. (1994). Determination of trace heavy metalsinillishaafricana, Fish and associated water and soil sediments from some fish ponds. International Journal of Envi-ronmental Studies. 45: 231-240.
- Adeyeye, E.I. (1996). Determination of trace/heavy metalsin fish associated water and soil sediments from some freshwater ponds. Bangladesh Journal of Environmental Monitoring and Analysis 1(1): 27-33.
- Al-Qodah, Z., yahya, M.A., Al-Shannaag, M., (2017). On the performance of bio adsorption processes for heavy metal ions removal by low-cost agricultural and natural by- product bioadsorbent: a review. Desalin. Water Treat. 85, 339-357.
- Ambedkar, G. and Muniyan, M. (2012). Analysis of heavy metals in water, sediments and selected freshwater fish collected from Gadilam River, Tamilnadu. India. International Journal of Toxicology and Applied Pharmacology 2(2): 25-30.
- Aremu M.O, Sangari D.U., Musa B.Z., Chaanda M.S., (2008). Assessment of groundwater and stream quality for trace metals physiochemical contaminants in Toto Local Government Area of Nasarawa State, Nigeria. Int. J. Chem Sci, 1(1): 8-19.
- Asaolu, S.S, and Olaofe, O. (2004). Bio-magnification factors of some heavy and essential metal in sediments, fishand crayfish from Ondo State Coastal Region. Biological Science Research 6:13-39.
- Ayandiran, T.A., Fawole, o.o., Adewoye, S.O., and Ogundiran, M.A., (2009). Bioconcentration of metals in the body muscle and gut of Clarias gariepinus exposed to sublethal concentrations of soap and detergent effluent. Journal of cell and Animal Biology, 3(8), pp.113-118.
- Bowler H.J, (1979). Heavy metals in the sediment of foundry cover cold spring, New York Environment Science of Technology. B. 683-687.
- Bruder-Hubscher, V., Lagarde, F., Leroy, M.J.F., Coughanowr, C., Enguehard, F., (2002). Application of a sequential extraction procedure to study the release of element from municipal solid waste incineration bottom ash. Analytical Chimica Acta, 451, 285-295
- Cheng, Y., Mai, L., Lu, X.W., Li, Z., Guo, Y., Chen, D., Wamg, F., (2021). Occurrence and abundance of poly- and perfluoroalkyl substance (PFASs) on microplastics (MPs) in Peearl River estuary (PRE) region: Spartial and temporal variations. Environ. Pollut. 281, 117025.
- Cui, L., Wang, X.N., Li, J., Gao, X.Y., Zhang, J.W., and Liu, Z.T., (2021). Ecological and health risk assessments and water quality criterial of heavy metal in the Haihe River. Pollut. 290, 117971.
- Duffus J.H., (2010): Heavy metals-a meaningless term. Pure Appl Chem 74(5): 793-807
- Fergusson J.E., (eds.) (2015): The Heavy Elements: Chemistry, Environmental Impact and Health Effects. Pergamon Press. Oxford.
- Fuentes, J.E., Mehkha, P., Zhangi, K., (2020). The Heavy Elements: Chemistry, Environmental Impact, and Health Effects. New Zealand Pergamon Press, 431.
- Garcia, R.L., Soto, C.M.S., Jara, M.M.E., and Gomez, A.A., (2004). Francciones geoqui ‘micas de Cd, Cu, y P ben sedimentos costeros superficiales de zonas ostri’colas del estado desonora, mexico. Rev. Int. Contam. AMBIENT., 20(4), 159-167.
- Gu, A.A., Cordli, B.K.C., Khan, C., (2022). Economic analysis of heavy metals pollution on soil,river and rice production in Nigeria. J. Emer. Tre. Econo. Manag. Sci. 6(8), 363-366.
- Gunatilake, S.K., (2016). Removal of Cr (III) ions from wastewater using sawdust and rick husk Biochar Pyrolyzed at low Temperature. Int. J. Innov. Educ. Res 4(4) 44-54.
- Hussia , Hussian I., Arif M., and Gupta N., (2017). Studies on heavy metal concentration in Godavari river basin. Appl water sci 7: 4539-4548.
- Järup, L. (2003). Hazards of heavy metal contamination. Br Med Bull. 68(1): 167– 182.
- Li, C., Zhou, K., Qin, W., Tian, C., Qi, M., Yan, X., Han, W., (2019). A review on heavy metals contamination in soil: effects source, and remediation techniques. Soil Sedi. Cont. Int. J. 28(4), 380-394.
- Lu, S., Lin, C.Y., Lei, K., Xin, M., Gu, X., Lian, M.S., Wamg, B.D., Liu, X.T., Ouyang, W., He, M.C., (2022). Profiling of the spatiotemporal Distribution, risks, and prioritization of antibiotics in the waters of Laizhou Bay, northern China. J. Hazard. Matter. 424, 127487.
- National Environmental Standard and Regulation Enforcement Agency (2007), World Health Organization/FAO; (2015).
- Nnaji, J.C., Uzairus, A. Harrison, M.F., and Balarabe, M., (2007). Heavy metals in muscles of Oreochromisniloticus and Bagrusbayad of River Galma, Zaira, Nigeria. Biological and Environmental Sciences Journal for the Tropics, 4, 181-189.
- Nriagu J.O., (2016). A global assessment of natural sources of atmospheric trace metals. Nature 338: 47-49.
- Olaifa, F.E., Olaifa, A.K., and Nwude, T. E., (2004). Lethal and sub-Lethal effect of copper to the African catfish (Clariasgariepinus) juvenile. African journal of biomedical Research, 7, 65-70.
- Obire, O., Tamuno D.C., and Wemedo, S.A. (2003). Physi-co-chemical quality of Elechi Creek in Port-Harcourt, Nige-ria. Journal of Applied Science and Environmental Man-agement. Vol. 7(1): 43-50.
- Tchounwou P, Newsome C, Williams J, Glass K (2011). Copper-induced cytotoxicity and transcriptional activation of stress genes in human liver carcinoma cells. Metal Ions Biol Med10: 285-290.
- Trottet, A., George, C., Drillet, G., Lauro F.M., (2022). Aquaculture in coastal urbanized areas: a comparative review of the challenges posed by harmful algal blooms. Crit. Rev. Environ. Sci. Technol. 52, 2888-2929.
- Verkleji JAS (2009). The effects of heavy metals stress on higher plants and their use as biomonitorsIn: Plant as Bioindicators: Indicators of Heavy Metals in the Terrestrial Environment (Ed: B. Markert), VCH, New York. 415-424
- WHO/FAO/IAEA (2010). Trace Elements in Human Nutrition and Health. World Health Organization. Geneva, Switzerland.