
A Comprehensive Nutritional and Compositional Investigation of Instant Mango and Orange Soft Drink Powders in Dhaka City, Bangladesh
- Abida Sultana
- Uzzal Saha
- Saif Al Shahab
- Md. Mazharul Islam
- 294-304
- May 16, 2024
- Chemistry
A Comprehensive Nutritional and Compositional Investigation of Instant Mango and Orange Soft Drink Powders in Dhaka City, Bangladesh
Abida Sultana*, Uzzal Saha, Saif Al Shahab and Md. Mazharul Islam
Department of Chemistry, University of Dhaka, Dhaka-1000, Bangladesh
DOI: https://doi.org/10.51584/IJRIAS.2024.904021
Received: 28 March 2024; Revised: 07 March 2024; Accepted: 12 April 2024; Published: 16 May 2024
ABSTRACT
The research focuses on flavored drink powders, particularly mango and orange flavors, popular in Dhaka, Bangladesh. These powders undergo various processes to extend shelf life, taste and attractiveness, including drying and adding preservatives, colorants, sweeteners and other additives directly involved to human health issues. The objective is to conduct a detailed analysis of sensory qualities, nutritional profiles, and market trends of commercial mango and orange drink powders in Dhaka. Various analytical techniques, such as UV-Visible spectrophotometry and phenol sulfuric acid test, were employed to measure soluble dietary fiber, ascorbic acid, sodium benzoate, Yellow 6, and total carbohydrates. The mango-flavored drink powder had moisture content 7.31-18.09%, with lower levels compared to orange (8.33-23.67%). Mango exhibited ash content 0.41-0.78%, while orange had significantly higher levels 0.86%-1.19%. Both flavors fell within the acidic pH range, with mango 3.14-4.95 and orange 3.36-4.72. Mango flavor showed higher levels of ascorbic acid, sodium benzoate, Yellow 6, and total carbohydrates compared to orange. The study provides insights into the significant variations between mango and orange drink powders and valuable information to optimize formulations and meet regulatory standards in the production of flavored drink powders.
Keywords: Physicochemical parameters, Preservatives, Synthetic colorants, Total carbohydrates, UV-Visible spectrophotometer.
INTRODUCTION
Beverages are playing significant role in our lives for centuries, offering respite from the scorching heat, quenching our thirst, and delighting our taste buds (Arora et al., 2019). Fruit-based drink powders have gained considerable popularity in recent years (Sadowska et al., 2021). Fresh fruits don’t survive very long and various processes like drying, chemical treatments, and specialized packaging procedures, are used to increase its shelf life (Parmar et al., 2023). Products made from dried juice are mostly utilized as room temperature-storable (Fernandes et al., 2023). In Dhaka, the capital city of Bangladesh, consumers are presented with a wide array of options when it comes to fruit drink powders. Mango and orange are two of the most iconic fruit flavors in Bangladesh.
A powdered beverage mix is a type of processed food product; it is usually a dry powder that is blended with water to create a drink that tastes like fruit juice (Çopur et al., 2019). Natural mango and orange powder, sweetener, colorant, thickener, acidifying agent, anticaking agent, flavor enhancer, and other ingredients make up the majority of the instant drink powder (Arora et al., 2019; Badsha et al., 2020; Seyinde et al., 2019). Mango and orange-flavored beverages are quite popular in the summer since they immediately rehydrate the body and refresh instantly (Akther et al, 2020). Thus, the development of a non-caking, liquid, and easily mixed powder or flakes of mango is imperative (Parmar et al., 2023, Jumbale et al., 2023).
To evaluate the comprehensive nutritional and compositional investigation of soft drink powders, its moisture and ash content, pH, sweetener, preservatives and colorants should be investigated (Badsha et al., 2020). Moisture level of instant soft drink powder is crucial for preserving product quality and prolonging its shelf life since it stops the product from clumping from too much moisture and from the hygroscopic effects (Ueda et al., 2023; Majiding et al., 2023). It also helps with food safety standards compliance, cost control and packaging optimization (Drago et al., 2020). Product’s purity and the existence of inorganic mineral impurities require quantifying the ash level of instant soft drink powder. In accordance with food safety regulations, it aids in ensuring product quality (Alam et al., 2020). In order to ensure that the beverage has the appropriate taste and safety, it is important to measure the pH (Aadil et al., 2019). Quantifying the amount of soluble dietary fiber in instant soft drink powder is crucial for adhering to dietary standards with 25-35 gram per day (FDA, 2008; Lattimer et al., 2010) and providing information on nutritional labels (Ioniță-Mîndrican et al., 2022). It also makes the product more appealing to consumers who are health-conscious and look for dietary fiber as part of their nutritional intake (Brandl et al., 2022). For the purpose of accurate vitamin content claims on the product and nutritional labeling, ascorbic acid must be quantified. This assessment ensures that the product satisfies the required nutritional criteria and assists customers in making educated dietary decisions (Santana et al., 2020; Panczyk et al., 2023). The preservative sodium benzoate helps to keep germs from growing and prolongs the shelf life (Pongsetkul et al., 2021). Maintaining the product’s quality over time and ensuring its safety are important, especially when it comes to powdered form where moisture content might fluctuate (Zambrano et al., 2019; Akolawole et al., 2022; Piper, 2018). Food coloring Yellow 6 is added to instant soft drink powder to improve its appearance and give the finished beverage a particular hue (Lawal et al., 2021; Silva et al., 2022). To accurately label nutritional information and assist customers in making educated dietary decisions, it is imperative to ascertain the total carbohydrate amount of instant soft drink powder. It is also essential for regulating the finished beverage’s taste and texture to make sure the desired sweetness and flavor (Obilana et al., 2018; Majiding et al., 2021).
Our objective is to provide an in-depth analysis of the sensory qualities, nutritional profiles, and market trends related to these popular drink powders. As the consumption of powdered mango drinks and orange drinks are quite too high in Bangladesh, it is necessary to have a study about the compositions of those commercial powder drinks. This research focuses on the quantitative analysis of the moisture content, ash content and pH, soluble dietary fiber, preservatives, synthetic colorant and total carbohydrate by UV-Visible spectrophotometric technique in the mango and orange powder drinks commercially available in Dhaka city, Bangladesh.
MATERIALS AND METHODS
Chemicals and reagents: Analytical reagent and solvents such as sulfuric acid (98%) phenol, methanol (99.5%) and ethanol (99.8%) used for the determination of soluble dietary fiber, were purchased from Merck, Germany were. Sodium Benzoate (99.15% purity) and Ascorbic acid (99.34% purity) standard used to quantify the ascorbic acid content in the powdered drinks, was collected from Eskayef pharmaceuticals limited. Yellow 6 used to make calibration curves for the determination of synthetic colorant in the samples, was purchased from Merck, Germany. Standards were stored in a freezer at -20 °C. Extra pure D-glucose used to determine the total carbohydrate content, was purchased from Aldrich Chemical Co. Ltd and stored at 0 °C in a refrigerator.
Sample Collection: Powdered mango drink and orange drink samples were collected from online platform (Chaldal.com) and local markets of Dhaka city during the period of November to December, 2021. This time period was chosen in Bangladesh perspective because it corresponds to the onset of the dry season and festive occasions, influencing consumer preferences and increasing demand for powdered drinks, while also providing insights into market dynamics and regulatory compliance during heightened commercial activity. The Mango drink samples were labeled as M1 (Taste me), M2 (Hashi khusi), M3 (Ezze Mango), M4(Ezze Mango), M5 (ISPI), M6(Kool-C), M7 (Sajeeb), M8 (Fruit Funda) and M9 (Fruitex), respectively. The Orange drink powder samples were labeled as O1 (Top C), O2 (Tang), O3 (Orange plus), O4 (Taste me), O5 (ISPI), O6 (Hasi Khushi), O7 (Foster Clarks), O8 (Kool C), and O9 (Kishwan Fruitex) accordingly and transferred to the laboratory for analysis. These brands were chosen for detailed analysis based on criteria such as market popularity, availability, diversity in sensory qualities, nutritional profiles, and representation of both established and emerging brands in the mango and orange drink powder market in Dhaka, Bangladesh. Some photographs of the collected samples are shown in the figure 1.
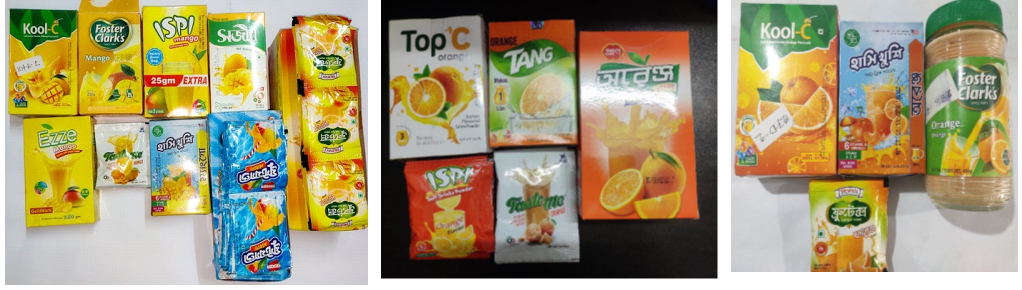
Figure 1: Collected samples of powdered mango drink and orange drink
Determination of moisture and ash: Using the Association of Official Analytical Chemists (AOAC), the proximate composition such was examined (Badsha et al., 2020; AOAC, 2016). In the crucible, 4 g of powder sample was weighted. Then it was weighted again after being baked in an oven at 105 °C for 4 hours. The moisture content was calculated from the diference. The sample was placed in the crucible and was heated in a muffle furnace at 600-700 °C for 6 hours. It was weighed after cooling and the result was calculated in g/100 g sample.
Determination of pH value: 1.0 g of samples was taken in a 25 mL volumetric flask and water was added up to the mark. pH of each of the solution was measured by a pH meter which was calibrated using two different standard buffers (pH 7.0 and 5.0).
Determination of Soluble Dietary Fiber (SDF): The extractions of SDF from the samples were performed using the acid extraction method (Buljeta et al., 2023). Powdered sample (10 g) was put in a flask, and 200 ml of distilled water was added. The pH was adjusted to 2.0 with H2SO4 and stirred on a water bath at 90 °C for 4 h and filtered. The filtrate was concentrated and CH3CH2OH was added to a final concentration of 70% and precipitate. The ethanol precipitation process continued for 1.0 h, and the SDF was to be collected by centrifugation and dried at room temperature (Shaddel and Rajabi-Moghaddam, 2024).
Determination of ascorbic acid: 100 mg of ascorbic acid was weighed, transferred to a 100 ml volumetric flask, and the volume was marked up to the indicated line using methanol: water (50:50 v/v) to obtain 1000 mgL-1. Serial dilution from this stock solution gave 3, 6, 9, 12, 15 and 18 mgL-1 ascorbic acid solutions. Absorbance was measured at 258 nm as shown in figure 2 (a).
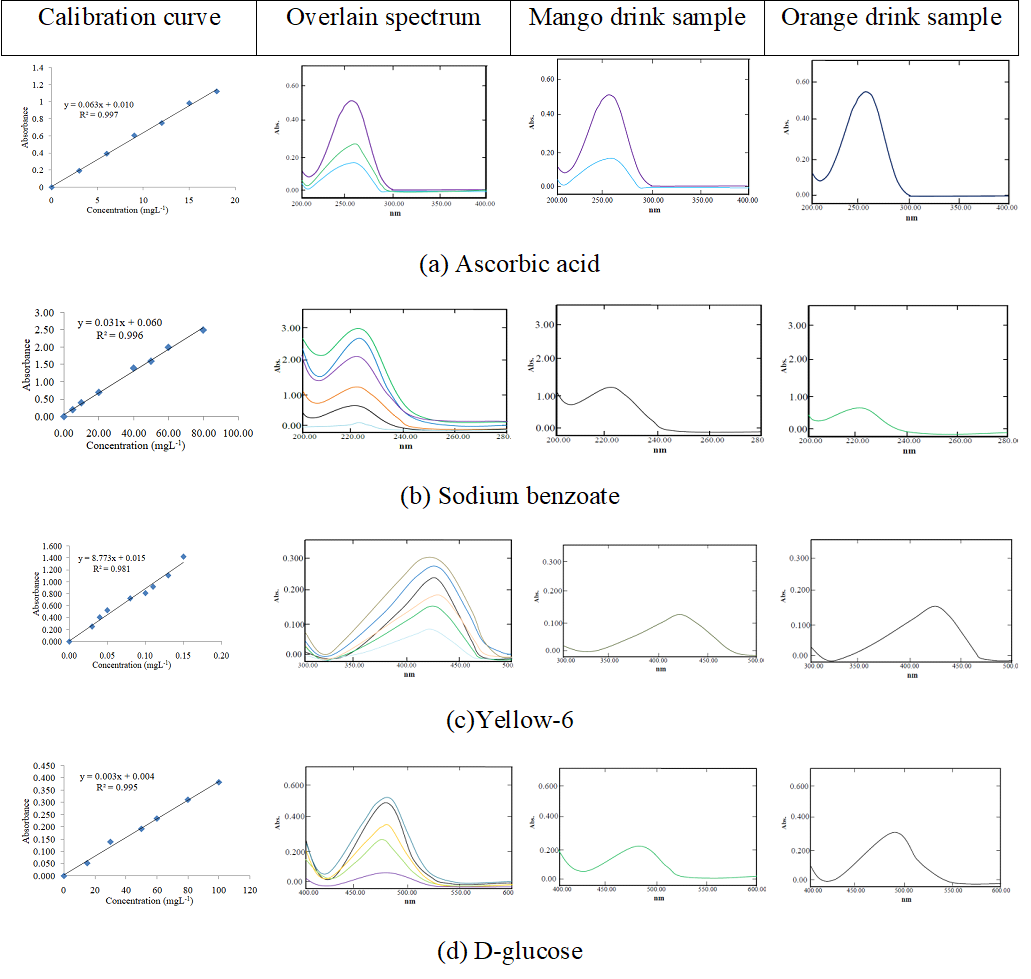
Figure 2: Calibration curves and necessary UV-Visible spectrums of ascorbic acid (a), sodium benzoate (b), yellow-6(c) and D-glucose(d).
Solid sample of each commercial powder drink was dissolved in methanol: water (50:50 v/v) system to prepare 0.1g/mL solution and the absorbance was measured at 258 nm.
Determination of sodium benzoate: The primary standard solution (500 µg/ml) was prepared by dissolving 0.0100 g of sodium benzoate in a 20 mL volumetric flask using HPLC grade water. A secondary standard solution (200 µg/mL) was then made by diluting the primary standard. Working standard solutions (80, 60, 50, 40, 20, 10, 5 mgL-1) were subsequently prepared from the secondary standard solution through dilution with HPLC grade water. The absorbance of the samples was recorded at 224 nm as shown in figure 2 (b). The UV-visible absorption spectrum of each of the sample was recorded by preparing their solution. Dried solid sample of each commercial sample was dissolved in water to make 0.1gmL-1 solution and the UV-visible absorption absorbance spectrum of each solution was recorded at 224 nm.
Determination of Yellow-6: The UV-visible spectrum of yellow-6 was recorded, revealing an absorption maximum (λmax) at 429 nm. A standard yellow 6 stock solution (1 mg/mL) was prepared and gradually diluted to generate eight different concentrations: 0.03, 0.04, 0.05, 0.08, 0.10, 0.11, 0.13, and 0.15 mgL-1. The absorbance of each diluted yellow 6 solution was measured at 429 nm using a UV-visible spectrophotometer as shown in figure 2 (c).
Dried solid sample of 0.1g was dissolved in 1mL water and the UV-visible absorption absorbance spectrum of each solution was recorded at 429 nm. Using the standard calibration curve of yellow 6, the amount of yellow 6 in commercial brand orange juices were determined.
Total carbohydrate determination: 2.0 mg of D-glucose was taken in a 10.0 mL volumetric flask with the addition of 3.0 mL concentrated sulfuric acid and vortexed. Then it was diluted to mark by concentrated sulfuric acid. The concentration of diluted standard solutions were 100, 80, 60, 50, 30 and 15 mgL-1. 3.0 mL from each volumetric flask was taken in different test tube and 50 μL 80% aqueous phenol was added in each test tube and vortexed. The absorbance was taken in the range of 400-800 nm and found maximum (λmax) at 490 nm as shown in figure 2 (d).
Solid samples of juice (90 mg) were dissolved in 1L water to get a solution of 90 mgL-1. Total carbohydrate in each solution was determined performing phenol sulphuric acid test and using the standard calibration curve made for glucose.
RESULTS AND DISCUSSION
Soft mango drink powder and orange drink powder samples were taken for analysis like moisture content, ash content, pH, amount of total carbohydrates, soluble dietary fiber, sodium benzoate, ascorbic acid and food grade color Yellow-6.
Table 1: Moisture content, ash content and pH of instant soft drink powder
| Mango drink powder (g/100 g) | Orange drink powder (g/100 g) | ||||||
| Sample ID | Moisture content ±SD | Ash content ±SD | pH | Sample ID | Moisture content ±SD | Ash content ±SD | pH |
| M1 | 8.86 ± 0.20 | 0.65±0.03 | 3.76 | O1 | 23.67 ±1.66 | 0.86±0.05 | 4.56 |
| M2 | 8.65 ± 0.18 | 0.57±0.01 | 4.28 | O2 | 12.37 ± 1.24 | 0.87±0.09 | 3.60 |
| M3 | 15.11 ± 0.24 | 0.49±0.02 | 4.95 | O3 | 8.33 ± 0.81 | 1.10±0.11 | 3.36 |
| M4 | 14.81 ± 0.34 | 0.63±0.02 | 4.43 | O4 | 19.03 ± 1.23 | 1.24±0.08 | 3.76 |
| M5 | 12.14 ± 0.19 | 0.67±0.03 | 3.39 | O5 | 21.35 ± 0.94 | 1.03±0.14 | 3.41 |
| M6 | 7.31±0.19 | 0.51±0.03 | 4.25 | O6 | 13.44 ± 0.78 | 1.14±0.15 | 4.72 |
| M7 | 8.16±0.28 | 0.41±0.02 | 4.82 | O7 | 21.35 ± 1.08 | 1.19±0.20 | 3.52 |
| M8 | 9.31±0.38 | 0.59±0.02 | 4.67 | O8 | 18.29 ± 1.10 | 1.18±0.21 | 3.77 |
| M9 | 18.09±0.41 | 0.78±0.02 | 3.14 | O9 | 21.56 ± 0.86 | 1.23±0.08 | 3.81 |
| RSD | 1.56-4.08% | 1.75-4.87% | – | RSD | 3.99-10.02% | 0.06-0.64% | – |
The moisture content in Mango drink powder (M) ranged from 7.31-18.09% (with a relative standard deviation, RSD, of 1.56-4.08%), whereas in Orange drink powder (O), it ranged from 8.33-23.67% (RSD of 3.99-10.02%) (Table 1). It’s evident that the Mango flavor generally exhibited lower moisture content compared to the Orange flavor. Maintaining moisture levels below 8% prevents microorganism growth in food, while exceeding 18% encourages it, with a moisture content below 10% being deemed ideal for dehydrated products like instant drink powder (Akther et al, 2020). These variations may be attributed to differences in raw material properties, processing methods, or packaging. The ash content in Mango drink powder (M) 0.41-0.78% (RSD 1.75-4.87%), while in Orange drink powder (O) 0.86-1.19% (RSD 0.06-0.64%) (Table 1). The data shows that Orange drink powder has a significantly higher ash content compared to Mango drink powder. This discrepancy may be due to the different fruit sources and formulation processes used in the two flavors. The guideline established by SNI (01–4320-1996) regarding the ash content in instant powder beverages is capped at a maximum of 1.5% (Nasional, 1996) with which each of the targeted samples in this study are compatible in formulations. The pH for Mango drink powder (M) 3.14-4.95, while for Orange drink powder (O), they varied from 3.36-4.72 (Table 1). The pH values of both flavors fall within the acidic range (< 7.00), which is expected for fruit-flavored drink powders. A recent study on 33 samples of fruit juices and drinks showed that, the pH from 3.15 (Tang Mosambi) to 5.22 (Nestle Fruita Vitals Royal Mangoes), with an average pH of 4.22 and a standard deviation of 0.00 (Kumar et al., 2022). SDF is typically absent in instant fruit-flavored soft drink powders to ensure the desired clarity, smooth texture, and rapid dissolvability when the powder is mixed with water, aligning with consumer expectations.
Table 2: Ascorbic acid and sodium benzoate in the instant fruit flavored soft drink powder
| Mango drink powder (mg/100 g) | Orange drink powder (mg/100 g) | ||||
| Sample ID | Ascorbic acid ± SD | Sodium benzoate ± SD | Sample ID | Ascorbic acid ± SD | Sodium benzoate ± SD |
| M1 | 89.04 ± 0.82 | 38.34 ± 1.09 | O1 | 8.38±0.09 | 37.84±0.09 |
| M2 | 126.59 ± 0.97 | 43.28 ± 1.34 | O2 | 6.34±0.09 | 29.40±4.60 |
| M3 | 38.47 ± 0.63 | 24.35 ± 0.85 | O3 | 11.28±0.10 | 38.45±1.80 |
| M4 | 160.12 ±1.12 | 51.02 ± 1.15 | O4 | 12.09±0.10 | 46.55±3.00 |
| M5 | 269.09 ± 2.61 | 46.42 ± 0.84 | O5 | 7.78±0.04 | 41.18±0.70 |
| M6 | 118.21 ± 1.87 | 56.37 ± 1.10 | O6 | 6.75±0.09 | 50.70±0.20 |
| M7 | 54.60 ± 1.06 | 41.01 ± 1.45 | O7 | 11.25±0.19 | 38.50±2.90 |
| M8 | 100.68 ± 0.96 | 58.45 ± 1.07 | O8 | 6.45±0.05 | 29.84±3.49 |
| M9 | 287.03 ± 1.59 | 47.83 ± 1.47 | O9 | 7.74±0.13 | 41.30±0.94 |
| RSD | 0.53-1.94% | 0.17-3.52% | RSD | 0.51-1.69% | 0.01-0.15% |
The data we have obtained demonstrates substantial differences in the levels of ascorbic acid between Mango (M) and Orange (O) drink powders (Table 2). In Mango drink powder, the concentration of ascorbic acid were 38.47-297.03 mg/100 g, with RSD of 0.53-1.94%. Orange drink powder exhibited significantly lower ascorbic acid levels, 6.34-12.09 mg/100 g, with RSD of 0.51-1.69% (Table 2). These variations are of paramount importance, as ascorbic acid not only contributes to the flavor and nutritional value of the product but also serves as a natural preservative, extending the product’s shelf life. The higher ascorbic acid content in Mango flavor indicates its potential advantages in terms of both flavor and preserving the product’s freshness.
The producer increased the amount of ascorbic acid in mango flavor because the duration and storage conditions affect the degradation of ascorbic acid. A research conducted that the concentration of ascorbic acid in various commercially available fruit juices in Greece varied from 2.4 to 43 mg/100 mL (Kabasakalis et al., 2000). Another study was conducted on 22 fruit drink samples in Bangladesh finding the value of ascorbic acid 2.96-70 mg/100 mL (Alam et al., 2019) which is compatible with our study. The sodium benzoate content in Mango drink powder were 24.35-58.45 mg/100 g, with RSD of 0.17-3.52%. In contrast, the Orange drink powder showed sodium benzoate levels 29.40-50.70 mg/100 g, with RSD of 0.01-0.15% (Table 2). These variations in sodium benzoate content can be attributed to formulation differences and the specific requirements for preserving each flavor. Even though the sodium benzoate poses minimal toxicity and low levels of carcinogenicity, overutilization of these substances in the food sector could present potential health hazards for humans, as indicated by various studies (Yazdanfar et al., 2023; Chaleshtori et al., 2018). The European Commission and Bangladesh Standards and Testing Institution (BSTI) both have established a maximum allowable concentration of sodium benzoate at 15 mg/100 mL (Akter et al., 2017; SCCP, 2005).
Table 3: Yellow-6 and total carbohydrates in the instant fruit flavored soft drink powder
| Mango drink powder (mg/100 g) | Orange drink powder (mg/100 g) | ||||
| Sample ID | Yellow-6 ± SD | Carbohydrate ± SD | Sample ID | Yellow-6 ± SD | Carbohydrate ± SD |
| M1 | 69.56 ± 1.07 | 89.21 ± 0.64 | O1 | 84.00±2.26 | 72.99±0.93 |
| M2 | 75.86 ± 0.62 | 88.07 ± 0.44 | O2 | 59.00±1.00 | 85.30±1.02 |
| M3 | 51.39 ± 0.77 | 82.40 ± 0.61 | O3 | 75.80±0.50 | 88.00±1.86 |
| M4 | 46.05 ± 1.33 | 83.68 ± 0.48 | O4 | 97.70±5.13 | 77.64±0.70 |
| M5 | 88.10 ± 1.45 | 85.82 ± 0.53 | O5 | 71.70±2.50 | 75.65±1.58 |
| M6 | 79.86 ± 1.77 | 90.07 ± 0.52 | O6 | 85.00±1.70 | 83.23±1.43 |
| M7 | 67.84 ± 1.34 | 89.10 ± 0.46 | O7 | 59.70±1.52 | 75.32±0.56 |
| M8 | 93.85 ± 1.89 | 88.65 ± 0.73 | O8 | 66.00±5.29 | 78.04±1.61 |
| M9 | 77.21 ± 1.29 | 78.01 ± 0.58 | O9 | 60.60±1.50 | 75.49±1.06 |
| RSD (%) | 0.81-2.88 | 0.50-0.82 | RSD (%) | 0.01-0.08 | 0.01-0.02 |
The data in our study indicates the presence of Yellow-6 in both Mango (M) and Orange (O) drink powders. The concentration of Yellow-6 in Mango drink powder were 46.05-93.85 mg/100 g, with RSD of 0.81-2.88%. Similarly, in Orange drink powder, the levels of Yellow-6 were 59.00-97.70 mg/100 g, with RSD of 0.01-0.08% (Table 3). These findings suggest that both flavors of soft drink powders are enriched with Yellow-6 to achieve the desired vibrant and appealing color. According to World Health Organization (WHO) the maximum allowable level of Yellow 6 is 20 mg/100g in different food items like snack food, beverages and dairy food products (FAO/WHO, 2011). The instant soft drinks powders are used by mixing in water or making solutions by diluting 10-15 times in water. So, all of the targeted instant soft drink powder samples are in safe level for consumers. The data presented here can serve as a reference point for manufacturers to adjust and optimize the use of Yellow-6 in their formulations. In 2005, a study on Yellow 6 in 96 instant drink powder samples available in Turkey was carried out and find that the amount in 3-42 mg/100g (Güler, 2005). In Mango drink powder, the levels of total carbohydrates were 78.01-90.07 mg/100 g, with RSD of 0.50-0.82%. Similarly, in Orange drink powder, total carbohydrates were 72.99-88.00 mg/100 g, with RSD of 0.01-0.02% (Table 3). These variations in carbohydrate content can be attributed to differences in formulation, including the choice of sweeteners and flavor enhancers. The data provides insight into the nutritional characteristics of these products and can assist manufacturers in ensuring that the carbohydrate content aligns with desired taste profiles and nutritional labeling requirements.
CONCLUSION
This study examines Mango and Orange instant soft drink powders, assessing factors like moisture content, ash content, pH, SDF, ascorbic acid, sodium benzoate, Yellow-6, and total carbohydrate content. The research underscores the importance of quality control and consistent production processes in achieving desired product attributes, highlighting distinctions between the two flavors. These insights are valuable for manufacturers in the instant soft drink powder industry, informing product formulation and quality assurance. Additionally, the study differentiates instant soft drink powders from fruit juices and smoothies, as they lack soluble dietary fiber. It analyzes ascorbic acid and sodium benzoate, emphasizing their role in flavor, nutrition, and preservation. Variances between Mango and Orange flavors stress the need for precise formulation and quality control. Furthermore, the research investigates Yellow-6 and total carbohydrate content, pivotal in influencing visual appeal, taste, and nutritional value. The data aids manufacturers in optimizing Yellow-6 usage and carbohydrate levels, enhancing the sensory experience and nutritional quality for consumers. The research successfully achieved its objectives by analyzing factors affecting Mango and Orange instant soft drink powders’ quality, providing manufacturers with insights to improve product formulation, quality assurance, and ensure the beverages’ overall safety and quality.
REFERENCES
- Aadil RM, Madni GM, Roobab U, Rahman U, Zeng, X (2019) 1 – Quality Control in Beverage Production: An Overview, Editor(s): Alexandru Mihai Grumezescu, Alina Maria Holban, Quality Control in the Beverage Industry, Academic Press,1-38.
- Akolawole JS, Okoye PAC, Omokpariola D (2022) Effect of storage on the levels of sodium benzoate in soft drinks sold in some Nigerian market with exposure and health risk assessment. Environmental Analysis Health and Toxicology 37(4): e2022030-0.
- Akter S, Abu Z, Khan M, Bari L, Huq M, Rashid M (2017). Identification and Quantification of Sodium Benzoate in Different Brands of Mango Juices Available in Tangail Region, Bangladesh. Bangladesh Pharmaceutical Journal 20 (1): 20-26
- Akther S, Alim MA, Badsha MR, et al. (2020) Formulation and quality evaluation of instant mango drink powder. Food Research 4(4): 1287-1296.
- Alam MR, Habib MA, Shill L, Mamun MA, Chowdhury P, (2019). Determination of Ascorbic Acid Concentration in Commercially Available Fruit Drinks in Bangladesh. Asian Food Science Journal 13(3): 1-6.
- Alam S, Bari T, Sohany M, et al. (2020) Formulation and quality evaluation of instant soft drink powder prepared from hog plum (Spondius mangifera) and mint (Mentha spicata). International Journal of Food Science and Nutrition 5(1): 33-37.
- AOAC (2016) Official Methods of Analysis. 20th Edition, Association of Official Analytical Chemists, Washington, DC, USA.
- Arora P, Ansari SH, Arora S (2019) Nutritional Beverages. American journal of Pharmtech Research 9(04): 1-28.
- Badsha MR, Akther S, Jothi JS, et al. (2020) Quality evaluation of commercially available instant mango drinks powder in local market of Bangladesh. International Journal of Agricultural Research Innovation and Technology 10 (2): 54-58.
- Brandl B, Rennekamp R, Reitmeier S, Pietrynik K, Dirndorfer S, Haller D, Hofmann T, Skurk T, Hauner H (2022) Offering Fiber-Enriched Foods Increases Fiber Intake in Adults with or Without Cardiometabolic Risk: A Randomized Controlled Trial. Frontiers in Nutrition 9:816299.
- Buljeta I, Šubarić D, Babić J, et al. (2023) Extraction of Dietary Fibers from Plant-Based Industry Waste: A Comprehensive Review. Appllied Science13(16): 9309.
- Chaleshtori FS, Arian A, Chaleshtori RS (2018) Assessment of sodium benzoate and potassium sorbate preservatives in some products in Kashan, Iran with estimation of human health risk. Food and Chemical Toxicology 120: 634-638.
- Çopur ÖU, Incedayi B, Özkan Karabacak A (2019) Technology and Nutritional Value of Powdered Drinks. Production and Management of Beverages 47-83.
- Drago E, Campardelli R, Pettinato M, Perego P (2020) Innovations in Smart Packaging Concepts for Food: An Extensive Review. Foods 9(11):1628.
- FAO/WHO (2011) Evaluation of Certain Food Additives and Contaminants (Seventy-forth report of the Joint FAO/WHO Expert Committee on food Additives) WHO technical report series No. 966, 2011.
- FDA, 2008. authors. Code of Federal Regulations. 2 Food and Drug Administration; Silver Spring, MD, USA: 2008. Health claims: Fiber-contaning grain products, fruits and vegetables and cancer.
- Fernandes L, Fernandes JRA, Nunes FM, Tavares PB (2023) Effect of Drying Temperature and Storage Time on the Crispiness of Homemade Apple Snacks. Journal of the Science of Food and Agriculture 104(2): 1-16.
- Güler Z (2005) Determination of Synthetic Colorants in Confectionery and Instant Drink Powders Consumed in Turkey Using UV/Vis Spectrophotometry. Journal of Food Quality 28(1): 98–108.
- Ioniță-Mîndrican CB, Ziani K, Mititelu M, Oprea E, Neacșu SM, Moroșan E, Dumitrescu DE, Roșca AC, Drăgănescu D, Negrei C (2022) Therapeutic Benefits and Dietary Restrictions of Fiber Intake: A State of the Art Review. Nutrients 14(13):2641.
- Jumbale M, Okoth M, Abong G, Ambuko J, Gekonge D (2023) Product and process development of mango flakes using response surface methodology. East African Journal of Science, Technology and Innovation 4(Special Issue): 1-14.
- Kabasakalis V, Siopidou D, Moshatou E (2000) Ascorbic acid content of commercial fruit juices and its rate of loss upon storage. Food Chemistry 70(3):325-8.
- Kumar N, Amin F, Hashem D, Khan S, Zaidi H, Rahman S, Farhan T, Mahmood SJ, Asghar MA, Zafar MS (2022) Evaluating the pH of Various Commercially Available Beverages in Pakistan: Impact of Highly Acidic Beverages on the Surface Hardness and Weight Loss of Human Teeth. Biomimetics (Basel) 7(3):102.
- Lattimer JM, Haub MD (2010) Effects of dietary fiber and its components on metabolic health. Nutrients 2010 Dec;2(12):1266-89.
- Lawal A, Gwaram N, Lawal BY, Ibrahim I (2021) Determination of Sunset Yellow as a Synthetic Food Colorant in Confectionery Products Consumed in Katsina Metropolis (Nigeria) Using Uv-Vis Spectrophotometer. FUDMA Journal of Sciences 5: 358-363.
- Majiding CM, Damayanthi E, Dewi M (2021) Acceptability and nutrient content of instant drink made from yellow sweet potato and red kidney bean as an alternative supplementary drink for pregnant women with chronic energy deficiency. National Nutrition Journal 16(1): 62–71.
- Majiding CM, Siddiq MNA, Rozi F (2023) Physical Characteristics and Shelf Life Estimation of Instant Powder Drink Made From The Combination of Yellow Sweet Potatoes and Red Beans. Ad-Dawaa’ Journal of Pharmaceutical Sciences 6(1):55–65.
- Nasional BS (1996) SNI 01-4320-1996: Serbuk Minuman Tradisional, 1–6, 1996.
- Obilana AO, Odhav B, Jideani VA (2018) Nutritional, biochemical and sensory properties of instant beverage powder made from two different varieties of pearl millet. Food and Nutrition Research 62: 1524.
- Panczyk M, Dobrowolski H, Sińska BI, Kucharska A, Jaworski M, Traczyk I (2023) Food Front-of-Pack Labelling and the Nutri-Score Nutrition Label-Poland-Wide Cross-Sectional Expert Opinion Study. Foods 12(12):2346.
- Parmar VM, Laxmiben DC, Priyanshi NB, Kanzaria D (2023) Strategies for Extending Shelf Life of Fresh Fruits. 1(10): 52-58.
- Piper PW (2018) Potential Safety Issues Surrounding the Use of Benzoate Preservatives. Beverages4(2):
- Pongsetkul J, Benjakul S (2021) The Use of Sodium Benzoate on Shelf-Life and Quality Attributes of Dried Chili Fish Paste Stored in Different Packaging Containers. Foods 10(8):1802.
- Sadowska A, Swiderski F, Kulik K, Waszkiewicz-Robak, B (2021) Designing Functional Fruit-Based Recovery Drinks in Powder Form That Contain Electrolytes, Peptides, Carbohydrates and Prebiotic Fiber Taking into Account Each Component’S Osmo-Lality. Molecules. 26(18):5607.
- Santana MC, Ferreira MMC, Pallone JAL (2020) Control of ascorbic acid in fortified powdered soft drinks using near-infrared spectroscopy (NIRS) and multivariate analysis. Journal of Food Science and Technology 57(4): 1233-1241.
- SCCP (Scientific Committee on consumer products /0891/05) 2005. Opinion on Sodium benzoate and sodium benzoate. European Commission.
- Seyinde DO, Ejidike IP, Ayejuyo S (2019) HPLC Determination of Benzoic acid, Saccharin, and caffeine in carbonated soft drinks. International Journal of Chem Tech Research 12(4): 15–23.
- Shaddel R and Rajabi-Moghaddam S (2024) Encapsulation of caffeine in chitosan-coated nanoliposomes and its application in drink formulation, Food Hydrocolloids 149: 109598.
- Silva MM, Reboredo FH, Lidon FC (2022) Food Colour Additives: A Synoptical Overview on Their Chemical Properties, Applications in Food Products, and Health Side Effects. Foods 11(3):379.
- Ueda JM, Morales P, Fernández-Ruiz V, Ferreira A, Barros L, Carocho M, Heleno SA (2023) Powdered Foods: Structure, Processing, and Challenges: A Review. Applied Sciences 13(22):12496.
- Yazdanfar N, Manafi L, Ebrahiminejad B, Mazaheri Y, Sadighara P, Basaran B, Mohamadi S (2023) Evaluation of Sodium Benzoate and Potassium Sorbate Preservative Concentrations in Different Sauce Samples in Urmia, Iran. Journal of Food Protection 86(8):100118.
- Zambrano MV, Dutta B, Mercer DG, MacLean HL, Touchie MF (2019) Assessment of moisture content measurement methods of dried food products in small-scale operations in developing countries: A review. Trends in Food Science & Technology 88: 484-496.