
A Prioritised Automatic Switching Algorithm for Load Shedding Using Labview
- John Kojo Annan
- Vitalis Dassah
- 110-126
- Apr 2, 2024
- Micronutrient
A Prioritised Automatic Switching Algorithm for Load Shedding Using Labview
John Kojo Annan1*, Vitalis Dassah1
1Electrical and Electronic Engineering Department, University of Mines and Technology (UMaT), Ghana
*Corresponding Author
DOI: https://doi.org/10.51584/IJRIAS.2024.90313
Received: 10 February 2024; Accepted: 27 February 2024; Published: 02 April 2024
ABSTRACT
Load shedding is employed at the Ghana Grid Company (GRIDCo) Tarkwa power substation to ensure a balance between power demand and available power. This involves taking off loads from the power transmission network when demand exceeds available power. Such loads are later reintroduced when available power is adequate to supply applied loads. The traditional technique of load shedding employed at the GRIDCo power substation in Tarkwa requires dropping electrical loads based on frequency variations. This may lead to dropping load of entire sections without consideration of essential loads. Research into prioritised load shedding algorithm using semi adaptive load shedding approach can continuously monitor and switch loads at the study area which is a transmission substation located in the Western Region of Ghana. Electrical Transient Analysis Program (ETAP) software version 2019 was used to simulate the single line system of the GRIDCo substation to determine the rate of change of frequency against varying loads. The implementation of the proposed technique was achieved with Laboratory Virtual Instrument Engineering Workbench (LabVIEW) software version 2019. Using typical load shedding data from the GRIDCo Tarkwa power substation, the proposed design was tested and found to be effective in carrying out load shedding.
Keywords: Load Shedding, Switching Algorithm, GridCo, ETAP, Lab VIEW.
INTRODUCTION
Load shedding involves taking off load in an electricity supply system when there is imbalance between available power and consumer demand. Load shedding may result from deficit in supply as well as from maintenance schedules of electricity providers. A nation’s inability to supply regular load demand due to low input resource such as appropriate water head in the case of hydroelectric power supply, may plunge the nation into load shedding scheme where sections of the nation may be off at certain periods. In 2021, Ghana was forced into a 22-day load shedding schedule due to maintenance activities undertaken by the Electricity Company of Ghana (ECG) and GRIDCo (Aklama, 2021). Power quality and supply security have long been problems in Ghana’s electricity sector. There was a deficit of 25% of peak power in 2014-2015 due to an imbalance between demand and supply. This deficit in supply saw the country tread the path of load shedding [1], [2]. Reference [3] studied on the impacts of load shedding and indicated that projections placed the daily economic costs of load shedding at above USD 2 million, with incalculable consequences to social development. Load shedding is hence critical to a nation’s economic growth.
- Load Shedding Methods
Research indicates that load shedding methods employed in recent years include adaptive, semi-adaptive, computerised, and traditional load shedding methods. The traditional method involves monitoring threshold quantities and triggering load shedding schemes. The semi-adaptive system is an improvement of the traditional load shedding scheme where the rate of change in the measured quantity with time is monitored against threshold values to trigger the shedding of a varied quantity of load. The adaptive technique is based on the System Frequency Response (SFR) and makes use of the frequency derivative.
References [4], [5], and [6] worked on semi-adaptive load shedding and concluded that, the semi-adaptive method might give inaccurate information regarding active power shortfall when some elements were made constant or removed from the system. References [7] and [8] on the other hand, worked on adaptive load shedding method. Reference [7] concluded that various power system outages could be avoided while [8] realised an improved efficiency with retained system security upon the use of the adaptive method.
Other research papers like [9], [10], [11], and [12] based their studies on computerised intelligent methods where load threshold parameters were detected and load shedding activated based on system model, operational cost, process viability, and environmental factors.
- Details of the Study Area
GRIDCo, which was set up in accordance with the Energy Commission (EC) Act, 1997 (Act 541) and the Volta River Development (Amendment) Act, 2005 (Act 692), performs economic load dispatch and transmission of power from wholesale suppliers (generating units) to bulk consumers which include the Electricity Company of Ghana (ECG), the Northern Electricity Department (NED), and the Mines Authority of Ghana [13].
The GRIDCo 161 kV ring main power substation, being the study area in Tarkwa within the Tarkwa-Nsuaem Municipal Assembly (TNMA) of the Western Region of Ghana, could be located about 2 km from the Tarkwa township on Latitude 5° 18′ 0″ N and Longitude 1° 59′ 0″ W [14]. It receives power supply from Kumasi and Aboadze and transmits the power at 34.5 kV to consumer substations including ECG and surrounding mining companies.
- Switching Issues at the Study Area
Switching could be manual where control buttons of feeders are repeatedly switched on or off by personnel in the control room of the substation or it could be automatic using accurate, fast, and usually expensive programmable computerised system [15].
At GRIDCo power substation in Tarkwa, frequency and voltage relays continuously monitor frequency and voltage of the power network and display line parameters on the substation’s control panel. The relays trip to shed off loads in the system when monitored parameters of the feeders go beyond certain threshold, usually set to ±5% of the nominal frequency of 50 Hz. The inability of the relay system to quantify the loads to be shared results in the relay taking off more loads than required to regain system stability. Again, the system is unable to consider alternatives like switching off a percentage of the system’s loads or automatically requesting for an increase in power supply.
In some instances, extreme fluctuations in monitored parameters may force engineers to manually take off loads to ensure system stability. The loads usually taken off is determined by the engineer’s discretion and experiences.
The substation has four main load feeders namely:
- The Mines Feeder which connects mining companies and their residences. They are usually referred to as bulk power customers;
- ECG Feeder for power distribution to mainly domestic residences and commercial establishments;
- Prestea Load Feeder that transmits power from the GRIDCo Tarkwa substation to Prestea, a distant gold mining town; and
- Takoradi Load Feeder for onward power transmission to the next town (Takoradi and its environs) within the ring main grid network.
MATERIALS AND METHODS USED
The research employs the use of Lab VIEW software 2019 (Version SP1) and ETAP software 2019 (Version 19.0.1) to model, design, and simulate a control switch for complete or partial automatic load shedding with an associated control system that will automatically request for back-up power in situations where excess generation is possible.
- Line Diagram Modelling of GRIDCo Tarkwa Substation
To identify operational conditions of frequency and load variations of the transmission and distribution processes at the power substation, a single line diagram is modelled and simulated using Electrical Transient Analysis Program (ETAP).
Figure 1 shows the single line diagram of the GRIDCo Tarkwa Substation.
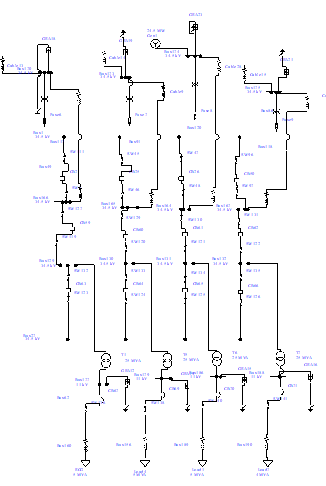
Figure 1 Single Line Diagram of GRIDCo Tarkwa Power Substation
- Components of the Single Line Diagram
Several components employed in the model of Figure 1 are explained as follows.
1) Generator: A 33 MW generator was modeled to serve as a source of power for the entire model. The diesel-powered, 4 poles non-salient rotor type generator was rated at 34.5 kV, 28.8 MVA that run at a speed of 1500 rpm. Generally, the real-time generating capacity of the producing plant is in the 100 MW. Figure 1 was modelled in ETAP with scaled values of the real-time ratings of the producing plant. The modelled single line diagram of the generator as shown in Figure 2 had a test run in normal and overloaded conditions.
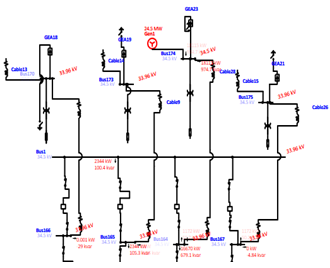
Figure 2 Modelled Generator in an Overload Mode
2) Bus Bars: The substation is designed with two (2) bus bars for receiving and transmitting high voltages from the producing plant. It consists of an isolator and a circuit breaker. The bus bars are arranged in the “main and transfer bus” type [16] where all connections are linked to the main bus. The transfer bus, on the other hand, is used to enhance the system maintenance procedure by shifting the line and circuit breaker to be maintained to the transfer bus [17]. A 34.5 kV rating was used to model the bus bars.
3) Low and High Voltage Circuit Breakers: Circuit breakers were placed on each line of the transmission network, with high voltage circuit breakers on the high voltage side and low voltage circuit breakers on the low voltage side. The high and low voltage circuit breakers were rated at 34.5 kV and 11 kV respectively. The high voltage circuit breakers were arranged in the breaker-and-half configuration comprising two major buses, each of which is generally electrified (Figure 3). The breaker-and-a-half arrangement allows for circuit breaker maintenance and ensures that transient faults on either of the primary buses result in no circuit disruptions.
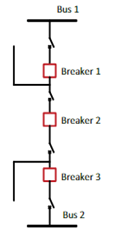
Figure 3 Breaker-and-Half Configuration
4) Isolators: Isolators were inserted on both ends of the circuit breaker to ensure a completely dead circuit and allow for risk-free repair of circuit breakers and line components [18]. Isolators were modelled as single throw switches. The modelled isolators were connected to the 34.5 kV line as well as the high voltage circuit breakers [19].
5) Transformers: Transformers were modelled to receive 34.5 kV from producing plants for onward transmission to 11 kV bulk power consumers and distributors. These are usually referred to as receiving station transformers. The data sheet used in modelling the receiving station transformers is shown in Figure 4. ECG is a typical bulk power distributor while power consumers include surrounding mining companies like Gold Fields Ghana Limited and Ghana Manganese Company Limited.
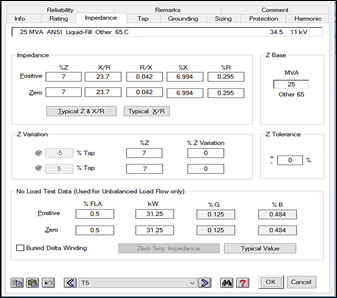
Figure 4. Data Sheet of Modelled Transformer
6) Loads: Electric loads may consist of resistive loads, inductive loads, capacitors loads or a combination of the components [20]. Electrical loads in power systems, based on structure and area of application, could also be grouped as:
- Industrial load;
- Domestic load;
- Agricultural load; and
- Commercial load.
Loads were selected accordingly in ETAP software, and their ratings varied during the simulation to analyse load variations with voltage, current, and frequency. Figure 5 shows the data sheet of typical loads used in the modelling.
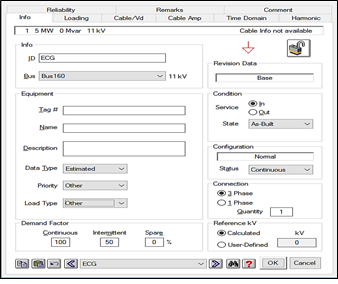
Figure 5 ECG Tarkwa Load Model
- Simulation of the Modelled GRIDCo Tarkwa Power Substation
Simulation was carried out by applying ETAP’s load flow and transient analysis features. The process was repeated to collect data correlating load variations with frequency. Figure 6 shows the power flow from generating plants to the loads. The load flow analysis indicated power, voltage, current and line losses in each segment of the single line diagram. Table 1 gives results obtained after repetitive simulations were carried out on the system.
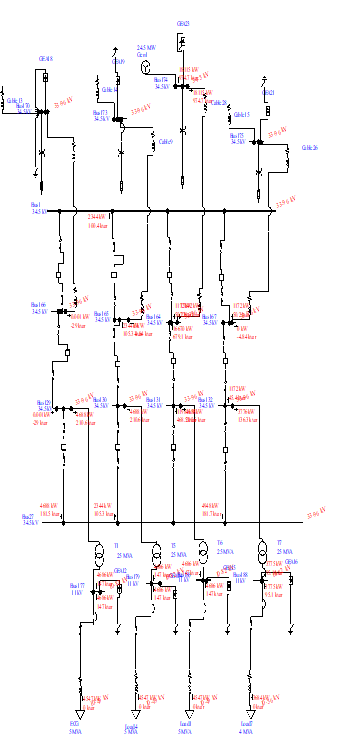
Figure 6 Load Flow Simulation of GRIDCo Tarkwa Power Substation
Table 1. Frequency Variations with Varying Loads
| Load (MW) | Frequency (Hz) |
| 18.0 – 19.5 | 49.92 |
| 19.6 – 20.5 | 49.90 |
| 20.6 – 23.0 | 49.85 |
| 35.0 – 37.5 | 47.42 |
| 37.5 – 40.0 | 47.16 |
| 40.1 – 43.2 | 46.97 |
| 43.3 – 45.0 | 46.57 |
| 45.1 – 47.2 | 46.31 |
| 47.3 – 50.0 | 46.12 |
Table 1 presents frequency variations realised upon variations in load. A load range of 18 – 19.5 MW changed the nominal frequency of 50 Hz to 49.92 Hz. Within the load range of 37.5 – 40.0 MW and corresponding frequency change of 47.16 Hz, a huge imbalance was realised in the system operation. An amount of load equivalent to the percentage load injected into the simulation process was shed to maintain the system’s operation to normalcy. The imbalances and manipulated loads bringing the system to normal operation gives a clear indication of the need for load shedding within the TNMA. The data presented in Table 1 served as a guide in the design of the centralised load shedding scheme using Lab VIEW version 2019.
- Flowchart of Proposed Design
Figure 7 shows the algorithm for the operation of the proposed design using Lab VIEW. At the start of the program, the total load of the system was calculated by summing all the loads of the power network. A comparison was made with the instantaneous supply from the generating plant. Upon the total load exceeding the instantaneous supply, another comparison was made with the allowable generating capacity of the generating plant. When the total load demand further exceeded the allowable generating capacity including back up generation, the system initiated a load reduction process. This involved taking off 30% of the load. Subsequent comparisons were made with the allowable generating capacity. Further Total Load Demand (TLD) exceeding the allowable generation, triggered additional 20% load shedding. Beyond the 20% reduction, any further increase in TLD saw the designed system load shedding from the line with least load to the heavily loaded line with reason being that, heavily loaded line pay more to the power producing company and hence needed to be prioritized. These processes continued until a balance between loads and the generating capacity was attained.
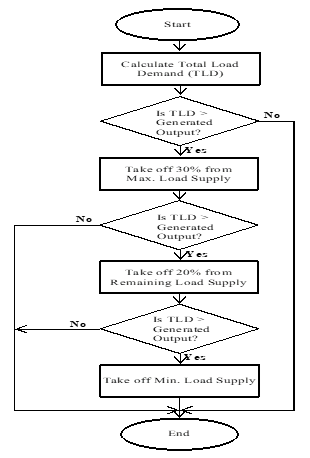
Figure 7 Flowchart of the Automatic Control Scheme
RESULTS AND DISCUSSION
- Components of the Front Panel of the Proposed Design
The proposed design was completed using Lab VIEW software with easily interactive interface. The front panel of the proposed design contained components that display, indicate, or control the processes of the automatic control switching.
1) Load controls: These controls display the amount of load on each feeder of the transmission network. In modelling the load operations, the amount of load on each feeder could be adjusted to make room for analysis of the system. Figure 8 shows the load controls of the four feeders of the substation as discussed in sub-section C of section I.
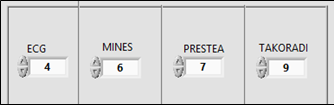
Figure 8 Load Controls of Proposed Design
2) Load switches: Each load control was coupled to a switch (SW) which turned on and off the respective load as shown in Figure 9.
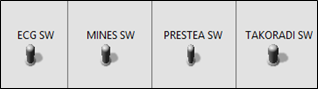
Figure 9 Switch Arrangement of Substation Feeders
3) Light indicators: Light indicators were used to indicate active or inactive mode of a feeder. Each load control has a corresponding light indicator on the front panel to indicate active (blue light) and inactive (black light) loads.
4) Maximum and minimum load indicators and indexes: The maximum load indicators display the feeder with the highest load demand in the power network. This way, an operator can easily determine which geographical location demands the most power at a particular time. The maximum index indicator displays the location of the maximum load on the computer memory. Minimum load indicators, on the other hand, display the feeder with the lowest load demand. The index indicator shows the location of the minimum load on memory, which was used to determine the specific load to shed. Figure 10 shows the maximum and minimum load indicators and indexes.
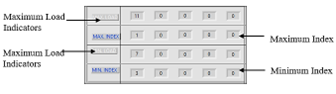
Figure 10. Maximum Load Indicators and Indexes
5) Mode of operation indicator: These indicators display what mode the algorithm is running on. The mode of operation could be load shedding mode indicated by a red-light, extra generation mode indicated by a green-light or normal mode indicated by a blue-light. These represent the active state of the loads. For the inactive state, the light indicators are black. It is, however, possible for the system to run on both extra generation mode and load shedding mode. This occurs when there is partial load shedding where the generating plant generates more power to support the initial generation. Figure 11 shows the mode of operation indicators of the load shedding algorithm.
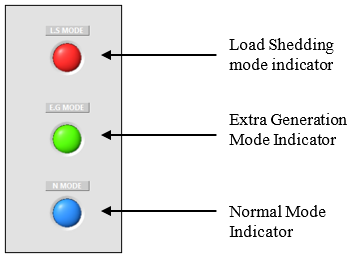
Figure 11 Mode of Operation Indicators
6) Total generating capacity and instantaneous power generation indicators: These indicators as shown in Figure 12 display the total generating capacity of the producing plant as well as the instantaneous generation dubbed initial generation. Total generating capacity is a constant constraint that remains the same over time. Initial generation, on the other hand, varies with load.
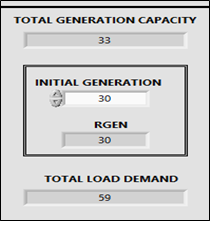
Figure 12 Total Generating Capacity and Instantaneous Power Generation Indicators
- Block Diagram Panel
The graphical code for the Virtual Instrument (VI) operation is contained in the block diagram. Wires connecting the blocks show the direction of the data stream. The block diagram could display terminals for each item on the front panel. Structures and functions that operate on controls and provide data to indicators were also included on the block diagram panel which could be used to position structures and functions. Access to a fully-fledged graphical programming language is located within the block diagram with all the typical characteristics of a general-purpose programming platform, including data models, loop control structures, event handling, and object-oriented logics. A portion of the block diagram of the load shedding scheme is shown in Figure 13.
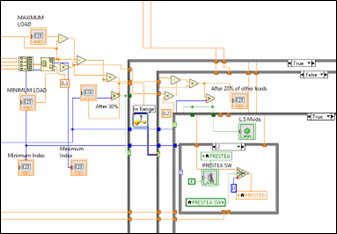
Figure 13 Block Diagram Panel of the Load Shedding Scheme
- Mode of Operation of the Automatic Control Switch Algorithm
The instantaneous generation was assumed to be 30 MW which could be varied to match actual values. The automatic control switch algorithm was designed to operate in three (3) modes:
- Normal mode where TLD is lesser or equal to the assumed instantaneous generation;
- Extra generation mode where TLD is greater than the assumed instantaneous generation but less than the total generating capacity of the generating plant therefore requiring an increase in generation to meet demand; and
- Load shedding mode.
In partial load shedding, a percentage of the loads in the power network is shed, usually starting with a 30 percent reduction of the load in the feeder with the maximum load. This is followed by a 20 percent reduction of all other loads in the network if the initial 30 percent reduction does not normalise the system’s frequency. Sometimes a complete load shed is required to bring the frequency to normal operating zones. Complete load shedding involves shedding the load on a feeder completely.
- Block Diagram Operational Review
The total load demand of the power network is calculated by summing all the loads in each feeder using simple arithmetic operations, as shown in Figure 14. A comparison of the total load demand with the starting or initial supply is then made using operations on the comparison sub-palette of the function palette.
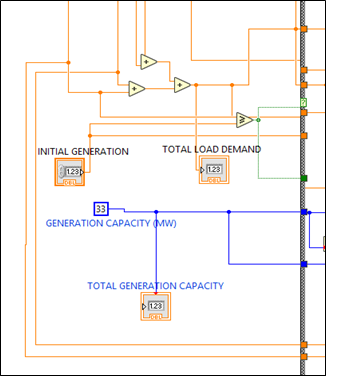
Figure 14 Load Feeder Summation and Comparison Algorithm
The result of this comparison was then moved to a case structure which depending on the comparison, initiated a set of codes for the next operation. For a false statement in the return of the comparator output, the algorithm was made to run in the normal mode due to initial power supply being greater than total load demand. A true statement, which indicated that total load demand was greater than initial power supply, another comparison was made with total generating capacity of the generating plant to check if the plant could generate additional power to cater for the extra demand. A case structure then determined the next line of action based on comparator’s output. Returning a false statement indicated that extra generation by the generating plant could accommodate the extra power demand. The graphical codes representing the process of extra generation demand are shown in Figure 15.
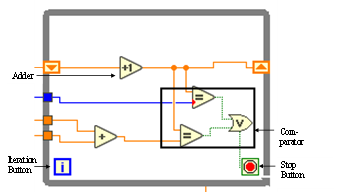
Figure 15 Graphical Codes for Extra Generation Mode
For a return of the true statement from the comparator, which indicated that the producing plant was incapable of generating extra power to overcome the extra generation, the outcome was fed into another case structure where the load feeders were placed in an array. The array served as a container for holding the load values, waiting for decisions to be made. The maximum and minimum loads were then scouted from the list of feeders. From Figure 16, calculation of a 30 percent off the maximum load was carried out after the scouting process. A comparison of the total load demand after the reduction was made with the power from the generating plant and the outcome moved to a case structure. For a false statement, implying that generation from the producing plant was greater than the load demand after reduction, no further reduction occured. But for a true statement, implying load demand to be greater than generated value, a further 20 percent of load demand was taken off. The algorithm for this process is shown in Figure 17.
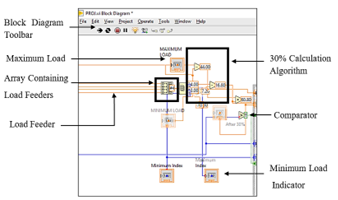
Figure 16 Algorithm for 30% Reduction Calculation
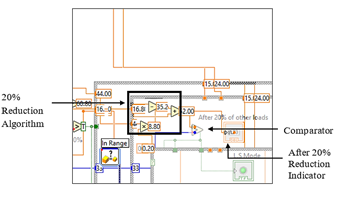
Figure 17 Algorithm for 20% Reduction Calculation
The comparator, after comparing the data on its input, gives an output which is fed into a case structure. The comparator output is of Boolean data type, true or false. For a false statement which implies that total generation is greater than total load demand, the algorithm ends and restarts the overall process. For a true statement, which implies that the TLD is greater than the total generation, the algorithm enters the next stage where it begins to shed off load in the power network. Figure 18 shows the switching mechanism used in taking off loads. The initiator algorithm returns a zero (0) once a load is shed. The load switch disconnects the load it represents from the power network. The index represents a particular load in the power network.
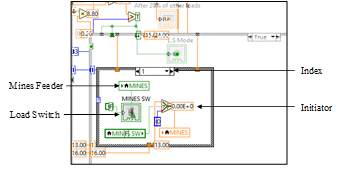
Figure 18 Codes Showing Switching Mechanism Algorithm
- Discussion of Results
1) Normal Mode: In the normal mode of operation, as shown in Figure 19 with the blue indicator light turned on, the total load demand of the feeders is 28 MW which is less than the starting or initial supply of 30 MW. The substation therefore does not need extra generation to balance the network and load shedding is not required.
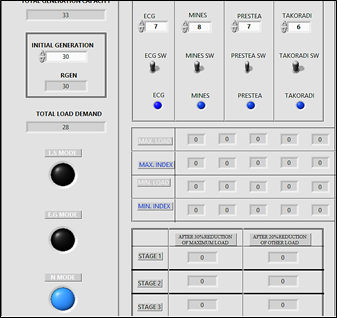
Figure 19 Lab VIEW for Substation Running in Normal Mode
2) Extra Generation Mode: In the extra generation mode, the load demand of the feeders is within 30 MW and 33 MW. Under this condition, the generating plant is made to produce more power to overcome the extra load in the system as shown in Figure 20 where the green light indicator is turned on.
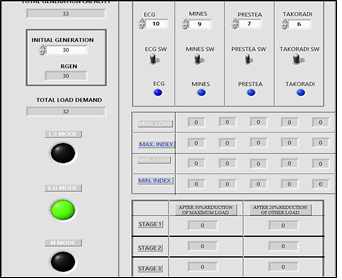
Figure 20 Lab VIEW for Substation Running in Extra Generation Mode
3) Load Shedding Mode: In the load shedding mode, total load demand after the reductions exceeds the generation capacity of the producing plant. Under this condition, producing extra power from the 33 MW producing plant will not bring a balance to the power network. The algorithm enters load shedding mode once there is a reduction in the demand. As shown in Figure 21, the load shedding indicator is switched on and the total load demand is shown on its indicator. The Prestea load feeder has been shed off the power network because the feeder has the minimum load demand of 15 MW. Power from areas with minimum load demand is shed to give room for areas where power demand is high. On taking off a load, the load switch moves from its original position on the front panel to a new position while the load light indicator turns off and the load reading turns to zero (0).
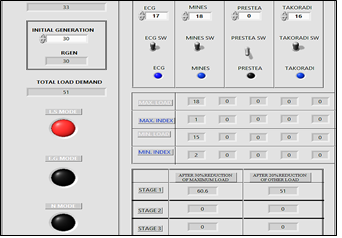
Figure 21 Lab VIEW for Substation Running in Load Shedding Mode
CONCLUSIONS AND RECOMMENDATIONS
From the findings, it is important that prioritized and partial load shedding be carried out instead of complete load shedding which renders outright removal of specified loads, usually weak loads, from the grid since outright load shedding could negatively impact on customers. It is noted that prioritized load shedding helps to protect the investment of valued customers who have paid dearly for continuous power supply so that even if TLD could not be supplied, a befitting amount of power could be supplied for consumers to sustain operation of valuable equipment within their establishments. It could also be concluded that Lab VIEW software could be used to model the automatic switch control for partial and complete load shedding.
Though a system configuration is required to accommodate automatic and prioritized load shedding, it is imperative that automated load shedding be considered to satisfy all levels of customers where load shedding algorithms could be reviewed to address specific issues within specified conditions. Shedding loads at GRIDCo Tarkwa power station should consider the prioritized automated approach to ensure minimal economic cost to the power transmission company, improved customers’ trust, reduced power theft and sustained power always.
An implementation of a prototyped prioritized automatic control switch for load shedding using Lab VIEW software is required in future studies at the GRIDCo Tarkwa power station to ascertain the required adjustments and configurations needed for complete installation. Further research could be conducted to validate the proposed adaptive load shedding scheme using real-time data from power systems which could then be compared with conventional schemes in practical scenarios. Extending a well defined and scalable scheme to handle more complex and combinational events multiple substations and interconnected networks could be considered. The impact of the proposed scheme on other aspects of power system operation, such as voltage stability, fault analyses and transient stability, can be investigated to assess overall effectiveness and potential benefits.
REFERENCES
- Asumadu-Sarkodie, S. and Owusu, P. A. (2016), “A Review of Ghana’s Energy Sector: National Energy Statistics and Policy Framework”, Cogent Engineering, Vol. 3, No. 1, pp. 115 – 274.
- Eshun, M. E. and Amoako, T. J. (2016), “A Review of the Trends in Ghana’s Power Sector Open Access”, Energy, Sustainability and Society, Vol. 5, No. 1, pp. 1 – 8.
- Fiawoo, E. E. (2016), “Assessing the Effects of Load Shedding (dumsor) on SMEs and the Coping Strategies Used to Survive Load Shedding in Madina, Accra”, http://hdl.handle.net/20.500.11988/168. Accessed: April 24, 2022.
- Rudez, U. and Mihalic, R. (2011), “Analysis of Underfrequency Load Shedding Using a Frequency Gradient”, IEEE Transactions on Power Delivery, Vol. 26, No. 2, pp. 565 -575.
- Banijamali, S. S. and Amraee, T. (2019), “Semi-Adaptive Setting of Under Frequency Load Shedding Relays Considering Credible Generation Outage Scenarios”, IEEE Transactions on Power Delivery, Vol. 34, No. 3, pp. 1098 – 1108.
- Faranda, R., Pievatolo, A. and Tironi, E. (2007), “Load Shedding: A New Proposal”, IEEE Transactions on Power Systems, Vol. 22, No. 4, pp. 2086 – 2093.
- Seyedi, H. and Sanaye-Pasand, M. (2009), “New Centralised Adaptive Load Shedding Algorithms to Mitigate Power System Blackouts”, IET Generation, Transmission & Distribution, Vol. 3, No. 1, pp. 99 – 114.
- Ford, J. J., Bevrani, H. and Ledwich, G. (2009), “Adaptive Load Shedding and Regional Protection”, International Journal of Electrical Power & Energy Systems, Vol. 31, No. 10, pp. 611 – 618.
- Shokooh, F., Dai, J. J., Shokooh, S., Taster, J., Castro, H., Khandelwal, T. and Donner, G. (2005), “An Intelligent Load Shedding (ILS) System Application in a Large Industrial Facility”, 40th IAS Annual Meeting Conference Record of the 2005 Industry Applications Conference, Vol. 1, pp. 417 – 425.
- Luan, W., Irving, M. and Daniel, J. S. (2002), “Genetic Algorithm for Supply Restoration and Optimal Load Shedding in Power System Distribution Networks”, Generation, Transmission and Distribution, IEE Proceedings, Vol. 149, No. 2, pp. 145 – 151.
- Zhao, B., Viet-Hung, N. Q. and Weidlich, M. (2020), “Load Shedding for Complex Event Processing: Input-based and State-based Techniques” 2020 IEEE 36th International Conference on Data Engineering (ICDE), pp. 1093 – 1104.
- Laghari, J. A., Mokhlis, H., Bakar, A. H. A. and Mohamad, H. (2013), “Application of Computational Intelligence Techniques for Load Shedding in Power Systems: A Review”, Energy Conversion and Management, Vol. 75, pp. 130 – 140.
- Anane, B. (2016), “Maintenance Optimization for Power Transmission Systems: A Case Study of Ghana Grid Company Limited”, The International Nuclear Information System, Vol. 53, No. 11, 101pp.
- Anon. (2017), “Climate and Average Weather Year-Round in Tarkwa”, https://weatherspark.com/y/40134/Average-Weather-in-Tarkwa-GhanaYearRound#:~:text=In%20Tarkwa%2C%20the%20wet%20season,or%20above%2095%C2%B0F. Accessed: August 5, 2022.
- Nwazor, N., Orisadare, W. and Phan, E. (2019), “Intelligent Substation Automatic Load Shedding System for Power Distribution”, International Journal of Scientific and Engineering Research, Vol. 10, No. 2, pp. 1296 – 1301.
- Ashlin, A. (2019), “Importance of Bus Bar in a Power System and its Applications”, https://forumautomation.com/t/importance-of-bus-bar-in-a-power-system-and-its-app lications/6049. Accessed: July 11, 2022.
- Edvard, C. (2014), “Main and Transfer (Inspection) Bus Arrangement Commonly Used in AIS”, https://electrical-engineering-portal.com/main-and-transfer-bus-arrangement-commonly-used-in-ais. Accessed: July 11, 2022.
- Anon. (2019), “Electrical Grid”, https://studentenergy.org/distribution/ electrical-grid/. Accessed: June 19, 2022.
- Baker, B. (2018), “What is the Difference Between a Switch, an Isolator, a Circuit Breaker, a Contactor, and a Relay?”, https://www.quora.com/ What-is-the-difference-between-a-switch-an-isolator-a-circuit-breaker-a-contactor-and-a-relay. Accessed: July 13, 2022.
- Anon. (2022), “Types of Electrical Loads on Power System and Load Curves Classification”, https://www.electricportal.info/2019/01/what-types-electrical-loadscurves.html#: ~:text=Agricultural % 20 loads % 20 % 3 A, Agricultural % 20 power % 20 system & text = Agricultural % 20loads % 20 mainly % 20 include % 20 irrigation, during % 20 the % 20 morning % 20 and % 20 evening. Accessed: July 13, 2022.