
An Assessment of Counter-Terrorism Options: A State Dependent Terror Queuing Model Perspective
- Udoh, I.J
- Alabi, O.I
- 74-103
- Feb 29, 2024
- Education
An Assessment of Counter-Terrorism Options: A State Dependent Terror Queuing Model Perspective
1Udoh, I.J., 2Alabi, O.I
1,2Applied Mathematics & Simulation Advanced Research Centre (AMSARC), Sheda Science & Technology Complex (SHESTCO), Abuja Nigeria.
DOI: https://doi.org/10.51584/IJRIAS.2024.90209
Received: 12 January 2024; Revised: 26 January 2024; Accepted: 31 January 2024; Published: 29 February 2024
ABSTRACT
The study is an application of a state-dependent queuing theory to evaluate the performance of counterterrorism (CT) options. The CT options examined include the Stick (use of force), the Carrot (non-coercive approaches), their combined variant, and covert agents. The model incorporates state transitions to capture the dynamic nature of terrorist recruitment processes in a CT environment. Performance measures are adapted from conventional queue frameworks to assess the effectiveness of these CT options in mitigating terrorist threats. The study analyses the CT options under an arithmetic progression pattern of terrorist recruitment and state transitions. The results demonstrate the importance of maximizing interdiction rate, discrimination rate, system efficiency, and intelligence integration while minimizing system unfairness factors, response time, and queue length for optimal CT operations. The results of the analysis also highlight a positive correlation between the Stick and the Carrot options, as well as between their intelligence-driven variants, emphasizing the need for a balanced and coordinated intelligence-driven CT approach. The study argues that relying solely on brute force or aggressive law enforcement measures without credible intelligence would be insufficient and counterproductive. It suggests leveraging syndromnized intelligence optimizing pseudo-terrorists (SIOP) agents for enhanced credibility, sufficient intelligence gathering, and covert supervision of terrorists’ compliance to Carrot instruments in the CT environment. The findings contribute to the existing literature on CT research and provide insights for informed decision-making in optimizing CT strategies. The study aims to support the development of more efficient and adaptive approaches to combat terrorism.
Keywords: Counter-terrorism options, State dependent queuing model, Syndromnized intelligence optimizing pseudo-terrorists’ agents, Stick and Carrot CT options, Terrorists’ recruitment processes, performance measure.
INTRODUCTION
The concept of waiting lines or queues in human society, is everyday occurrence particularly in the context of limited resources and services. Queues are common in various daily activities such as waiting at bus stops, ticket offices, or shops. Queues also occur extensively within an economic, industrial, and social contexts, where people or objects arrive at a service facility and experience delays when the facility is occupied. Drawing analogy to counterterrorism (CT) operations, the concept of terror queuing suggests that terrorists and criminals can be seen as unconsciously and imaginarily queuing before the security agencies’ interdiction efforts. Thus, a terror queuing model (TQM) represent the flow of terrorist activities in a CT environment and the potential responses by government CT options.
Counter-terrorism underscored the strategies, policies, and actions implemented by governments to prevent, deter, and respond to terrorist activities. It involves measures aimed at disrupting terrorist networks, protecting potential targets, and minimizing the impact of attacks. Such government measures can be categorized into three fundamental CT options: the Stick (use of force and law enforcement actions), the Carrot (non-coercive approaches addressing root causes), and their combined variant[22],[24],[29]. However, considering the asymmetric nature of CT operations, and its heterogenous battlefield, the infiltration of “syndromnized intelligence optimizing pseudo-terrorists” (SIOP) agents to boost credible intelligence gathering in CT environment, also worth consideration as CT option, that could complement the three fundamental CT options.
The TQM applies queuing theory principles to the analysis and optimization of resource allocation and personnel in CT environments. It mirrors the conventional queuing model by managing the flow of tasks or terrorists through sequential processes. The goal is to ensure efficient resource utilization and minimize delays or bottlenecks. Factors considered in TQM include the capacity of each stage or activity, arrival rate of tasks or terrorists, processing time, task priority, and dependencies between stages. TQM provides insights into operational performance, identifies areas for improvement, and aids decision-making on resource allocation and process optimization in CT operations.
To analyse the respective CT options based on the current state or conditions of the CT environment, the present study conceptualises a state-dependent terror queue model (SD-TQM) framework; which incorporates the current state or conditions of terrorist activities. The state can be defined by factors such as the intensity of terrorist activities, geographical spread, recruitment dynamics, organizational level, and the effectiveness of CT measures. SD-TQM allows for the analysis of CT options based on these factors. Under the SD-TQM framework, the CT options (servers) represent the resources and strategies employed by CT organizations, including intelligence gathering, surveillance, investigations, law enforcement, and community engagement. The recruitment rate of terrorists (arrival population) reflects the rate at which individuals join terrorist organizations. It is modelled as a Poisson process. The interdiction rate (departure population) represents the rate at which terrorists are detected and prevented from carrying out activities. It depends on factors such as intelligence quality, coordination, resources, and response capabilities. The queuing process, therefore, involves the flow of individuals through the CT environment, with different CT options processing them. State transitions occur based on changes in recruitment dynamics, impacting arrival rates and strategies. CT responses include specialized SIOP agents, community outreach programs, and military-offensive actions, represented as parallel servers in the TQM. Performance measures are used to evaluate and manage the CT environment effectively.
In summary, the study proposes a TQM and a SD-TQM in particular, for the analysis and optimization of resource allocation and personnel in CT environments. The models consider factors such as arrival rates, interdiction rates, CT options, and state transitions. It emphasizes the importance of understanding and managing the flow of tasks or entities in CT operations to enhance capabilities in combating terrorism and maintaining security.
REVIEW OF RELATED LITERATURE
The first generally acknowledged study on “waiting line” or queuing is accredited to the work of A.K. Erlang[6], in which the classical “B-Formula or Erlang Loss Formula” was developed for the Denis Telephone Company in England. However, until the nascent wave of terrorism in September 11, 2001, the application of queuing theory – the mathematical model of “waiting line problems” had only dominated conventional business-oriented service systems. State dependent queuing models (SDQM) have been successfully applied in various real-world applications to analyze complex systems and optimize their performance[5],[7],[10], [12],[20],[25]. For instant, Kelly and Williams[7], reviewed the application of SDQM in traffic signal control. It presents an optimal control framework that considers the dynamic nature of traffic flow and signal timings to minimize delays and improve traffic efficiency. The study demonstrates the effectiveness of the SDQM in optimizing traffic signal control strategies. Gans, et al.,[20] work, also gave a comprehensive reviewed of a SDQM used in call centre operations. It discusses various aspects, such as arrival patterns, service times, staffing levels, and routing strategies. The study highlights the effectiveness of SDQM in optimizing call centre performance, reducing waiting times, and improving customer satisfaction.
In Hossein et al.[10], the author presented a state-dependent queueing system with both finite and infinite buffer sizes. The work shows that the steady-state solution of this system at arbitrary times can be derived using the supplementary variable method, and that the system’s state at arrival epochs can be analysed using an embedded Markov chain. In Singh and Bose[25], the author provided a state-of-the-art and survey of literature on the state-dependent queueing models operating under F-policy. The queueing models investigated under admission control F-policy have several applications at various places such as at communication systems, hospitals, call centers, manufacturing and production system, etc. Also, the work of Van der wal, et al.[12], presented some open challenges for state-dependent queueing models in health care. The authors call for a data-based queueing-science perspective to find appropriate models that explain the complex dynamics of patient flows in health systems. Further comprehensive review of SDQM applied in service systems, including hospitality, retail, and entertainment industries, was also provided in Wang, et al[5]. This paper discusses various applications, such as queue management, staffing optimization, and service time guarantees. The study demonstrates how SDQM can enhance customer satisfaction, improve operational efficiency, and optimize resource allocation in service-oriented industries.
Notwithstanding the extensive works on state-dependent queueing, its applications to combat dynamics, especially CT modelling is still scanty, except the recent quest for optimal interdiction of terror plots in CT environment[3],[14,16,17].[15],[26]. Specifically, Kaplan[14] had represented terror plots as terrorists, and covert intelligence agents as server system in a queuing framework. Originally, the authors’ terror queue analogy was purely descriptive, that aims to study the effect of infiltration and interdiction of terror plots by covert intelligence agents – employed to enhance both credible intelligences gathering and also interdict terror plots. Analysis of these models had introduced a new paradigm of determining the size of terrorists’ state variable as an arithmetic sum of all undetected and detected terror threats, which are often known to the state authorities. In a follow-up papers, Kaplan[16,17] included staffing level optimization in his terror queue to determine the proportion of covert agents that could maximize the benefits of preventing terror attacks. By presuming that terrorists are smart guys that may deduce the staffing level of CT personnel by observing the fraction of attacks interdicted, the author also extended their investigation to a simple terror queue staffing game. In another complementary effort, Seidl et al[3] extended Kaplan’s[16,17] works by applying Pontryagin’s optimal control theory to address the dynamic aspects of inter-temporal staffing problems with respect to the proportion of covert agents required to optimally detect and interdict terror plots. The work which provides a useful method for understanding the qualitative behaviour of CT staffing system, predicted that the optimal CT strategy for government depends on both the number of detected and undetected terror plots. Thus, as these state variables change dynamically over time, so too should the government strategy evolve.
In a similar terror queue model, Wrzaczek et al[26], also sought to determine terrorist optimal attack rates over time as government develops optimal CT staffing levels. Here, the authors estimated the numbers of successful and interdicted terror attacks via an underlying fluid terror queue model. Considering three different possibilities of information structures between the terrorist and government, the authors characterized the optimal controls for both the terrorists and the government in terms of the associated state and co-state variables. And deducing and solving the co-state equations numerically for the different information structures, the authors observed that if government is not able to observe terrorists by all means, and therefore, detect any terror plots, it is optimal for the terrorists to initiate terror plots at a constant rate – a motivation for the assumption of a constant attack rate made in Seidl et al[3]. Hence, it is optimal for terrorists to initiate more terror attacks if the number of existing terror plots is higher than the detected ones. Therefore, to contribute to this lean but demanding literature on CT performance appraisal, the present paper complement with the study of a state-dependent terror queue – where arrival population (recruitment) grows arithmetically with the system interdiction rate. With particular example in the Nigerian CT environment, it is hoped that this paper will throw more light on the performance appraisal of the relevant CT options, amidst growing calls for proper assessment of our domestic CT measures.
CONCEPTUALIZATION OF TQM
In this terror queue analogy, susceptible individuals (recruits) joining terrorist organizations are assumed to arrive (detected) the CT environment at random, following a Poisson process, and targeted for interdicted (service) by CT forces at First-come-first-serve (FCFS) service policy, except otherwise instructed by CT authority. If any of these terrorists is detected by covert intelligence agents, he/she is assumed to have entered the “queue”, and hence, subject to targeting and interdicted (remove from the system). Therefore, the number of detected terrorists per cycle of CT operation forms the queue length , while the sum of detected and interdicted terrorist forms the system size If the detected terrorist is targeted for interdiction, he/she is assumed to have entered “service” and is finally removed from the system by either arrest or assassination or surrender or defection, via any of the CT options (servers). Sometimes detected terrorists targeted for interdiction may escape as a result of some preferential interdiction policy (e.g., prioritization of leadership decapitation or Sacred Cow syndrome) or intelligence lapse or system failure, and thus, complete his/her terror attack. This is synonymous to customers who renege from the conventional queue prior to being served. Though, this assumption may not hold exact in our TQM analogy, because unlike customers in the conventional queues, terrorists are not always visible upon arrival at the CT environment, but must be detected by covert intelligence agents before being targeted for interdiction. Thus, detected terrorist and the standby CT forces may coexist in a CT environment. The CT options serving as service channel or server(s) in this TQM analogy, hypothetically underscores the application of any of the Pavlovian motivational learning theories – Stick and Carrot approaches, or their combined variant, as well as their enhanced efficacy via specialized SIOP agents, to the management of CT environment. Specialised SIOP agents, who may also play guerrilla fighters roles, can also help to detect and covertly interdict potential terror plots in CT environment. The combined variants of these CT options, (Stick + Carrot, or Stick + SIOP or Carrot + SIOP, or Stick +Carrot+SIOP), underscore their simultaneous or parallel utilization in a given CT environment for maximum interdiction of terrorist organizations.
Steady State Terror Queuing Model
When CT operations commences, we assumed that interdiction progresses via the respective of CT options, but attains stability after some time. Before the commencement of interdiction, the CT environment is very much influenced by the initial number of terrorists, and the elapsed time. This period of transition is termed as transient state of the CT environment. A CT environment endowed with multiple CT options, (M/M/k; k ≥ 1) is said to be in transient-state when its operating characteristics are dependent on time. However, after sufficient time has elapsed, the CT environment may become independent of the initial conditions and the elapsed time (except under very special circumstance), and thus, enters a steady state condition. A steady state condition is said to prevail when the behaviour of the CT environment becomes independent of time. By considering terrorists’ recruitment rate as the arrival population, CT options as servers, and the interdiction rate as the departure or service rate, this model, assume that the terror queuing system (TQS) reached a steady state when the number of terrorists recruited and interdicted remains relatively constant over time. Pn (t) denote the probability that the CT environment is in state (n) – there are η recruited terrorists at time t. We know that the change of Pn (t) with respect to time (t) can be denoted by its derivative (d/dt Pn (t)). Therefore, the TQS is assumed stability, eventually, Pn (t) if is independent of time (t), i.e., remains the same as time passes (t → ∞). Mathematically: ![]()
![]() From Lee’s[2] point of view, a TQS under steady state condition can be represents by:
From Lee’s[2] point of view, a TQS under steady state condition can be represents by:
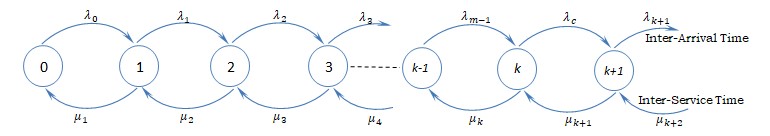
Figure 1.0: Flow diagram of M/M/k,≥ queuing Model
Consider the various states of CT environment, from the rate-diagram above, let
- λ denote the average number terrorists recruited per CT cycle.
- μ denote the average number of terrorists interdicted per CT cycle
- p denote the traffic intensity on CT option per CT cycle;
- L denote the size of CT environment (detected and interdicted terrorists) per CT cycle,
- Lq denote the queue length (detected terrorists) per CT cycle,
- ω denote the average time spent by an arbitrary terrorist from detection to interdiction,
- ωq denote the average time spent an arbitrary terrorist before interdicted,
- P0 denote the probability that no terrorists in the CT environment.
Considering the transition that take place in CT environment, state by state, we have that in steady state:
Rate of detection of terrorists = Rate of interdiction of terrorists.
Therefore, when the CT environment is in:
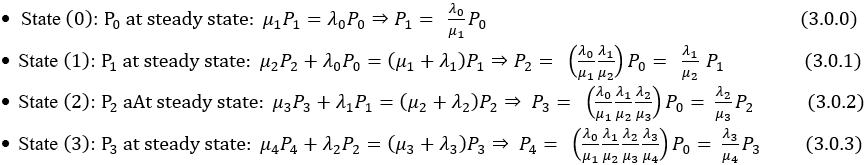
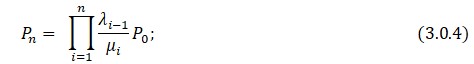
By mathematical induction, therefore, when the CT environment is in state – there are -terrorists in CT environment[2],[27]:
But, we also have
![]()
Substituting equation (3.0.4) into (3.0.5), we have
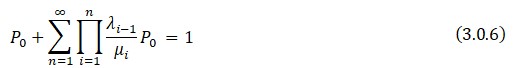
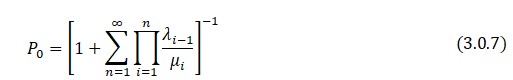
Therefore, the probability that there are no terrorists in the CT environment – no CT option is deployed,(P0) is given by:
By queuing theory[2],[6],[27], the system size – number terrorists detected, and interdicted (L) is given by:
![]()
And the queue length – mean number of terrorists detected per cycle of CT operation, given that there are K -CT options is given by:
![]()
The average rate at which a terrorist is detected in CT environment,λ , is given by:
![]()
Then the average time an arbitrary terrorist spent in CT environment after detection is be given by:
![]()
And the average time an arbitrary terrorist spent CT environment before he/her is interdicted, can be given by:
By Erlang-C formula[2],[6], [27], the probability that the interdiction of a detected terrorist will be delayed, given that there are ![]() terrorists in CT environment is given by:
terrorists in CT environment is given by:
![]()
State Dependent Terror Queuing Problem
Research and field findings indicate that, terrorist organization’s primary objective is to strategically establish a network of resilient combat units (cells) within its area of conquest first, before launching any attack. Consider a CT environment predisposed to some predetermined CT options, k, aimed at combating the terrorists’ combat cells, and hence, terrorists’ activities. We assumed that the respective CT options often interdict susceptible terrorists’ cells according to some exponential laws, with mean, say –cells per CT cycle. Susceptible terrorists’ cells are also assumed to recruit members randomly according to the state of CT environment, but at a constant rate, say -terrorist per CT cycle, as long as there is at least one (1) combat cell established in the CT environment. However, if at least 2-terrorists’ cells are successfully established in the CT environment, the recruitment rate increases arithmetically with the number of interdicted terrorists. But, if at least 5-unit cells are successfully established in a CT environment, then terrorists’ recruitment rate declines considerably.
In particular, research findings and journalistic account of how Al-Qaida, ISIS, Hezbollah, and their affiliates have developed over the recent decades, have shown that due to the dwindled intelligence capability of the conventional military-offensive CT option, a notional terrorist organization can at-most be depopulated by 20% via attrition, and 3% via internal personnel drain (IPD) through demotivation, fatigue, desertion as well as in-fighting and splintering[4],[9],[18]. Considering the CT goal of enhancing attrition accuracy via credible intelligence gathering, and boost IPD factors via viable Carrot instruments, Udoh, et al.,[28], observed that, notwithstanding the inherent inclination of abuse, misinterpretation and misconstrued of Carrot objectives in CT environment, however, the deployment of viable Carrot instruments has the potential of weaning at least 40% susceptible terrorists from terrorism. Whereas, the infiltration of at least 5% specialized SIOP agents into a Carrot CT environment has the potential of boosting interdiction rate by 65%, annually. Furthermore, the introduction of viable Carrot instrument in an enemy-centric CT environment has the potential enhance attrition accuracy by 40% and IPD by 25% annually. Whereas, same proportion of specialized SIOP agents has the potential of boosting attrition accuracy by 60% and IPD by 25% annually, in the combined Stick and Carrot CT environment.
State Dependent Terrorists’ Recruitment Dynamics (SD-TRD): Considering that a terrorists’ combat cell consists of at least 6 terrorists, therefore, to sustain or recuperate and consolidate on its current numerical strength after each CT cycle, susceptible operatives are often recruited in batches of at least 6 terrorists, in addition to the proportion lost in previous CT cycle. To maintain a strong, vibrant and resilience structure, field findings also reveals that four key factors often characterized the recruitment drive of ISWAP and Boko Haram terrorist organizations at any recruitment cycle: (i) The number of operatives that would expand its combat cells by at least one extra unit, (ii) The proportion of operatives to replenish the loss due to previous CT operations, (iii) The proportion of operatives to replenish loss due defected and natural dead, and (iv) a sizeable proportion to serve as backup for subsequent operations. In particular, an average of 10% backup plan, and at least one combat cells must be recruited by a terrorist organization per recruitment cycle. These factors, collectively defined the overall number of terrorists to be recruited, and hence, the arrival rate of terrorist in a CT environment at each CT cycle. Let yn (t) denote the number of terrorists to be recruited at i-cycle of recruitment process, then by the above state dependent queue, the organization’s recruitment regression model and be given by:
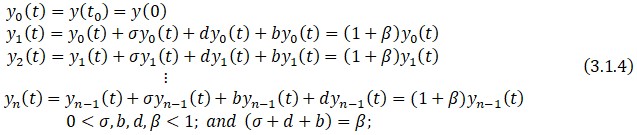
Where σ is the proportion of terrorist lost during the i-cycle of CT operations; d is the proportion of terrorists lost internally through defection or natural dead, and b denote proportion of terrorists required as backup for the next CT cycle. Notwithstanding the inherent inclination of abuse, misinterpretation and misconstrued Carrot objectives, Udoh, et al (2019) observed that the deployment of viable Carrot CT instruments in CT environment, has the potential of weaning at least 40% susceptible terrorists from terrorism. Whereas, the infiltration of at least 5% specialized SIOP agents into a Carrot CT environment has the potential to boost interdiction rate by 65%, annually. The authors also observed that, the introduction of viable Carrot instrument in an enemy-centric CT environment has the potential enhance attrition accuracy by 40% and IPD by 15% annually. Whereas, the infiltration of at least 5% specialized SIOP agents into such CT environment can boost attrition accuracy by 60% and IPD by 25% annually. Table 3.1 below give description of the model dataset.
Table 3.1: Description Model’s Data Set and Values
| Parameters | Description of Model Parameters | S | C | SC | S+ | C+ | SC+ |
| 0 < σ > 1: | Proportion loss via CT measures | 0.20 | 0.40 | 0.55 | 0. 75 | 0.65 | 0.85 |
| 0 < d > 1: | Proportion loss via IPD annually | 0.03 | 0.03 | 0.03 | 0.03 | 0.03 | 0.03 |
| 0 < b > 1: | Expected backup per CT cycle | 0.10 | 0.10 | 0.10 | 0.10 | 0.10 | 0.10 |
| 0 < β > 1: | Total recruitment per a CT cycle | 0.33 | 0.33 | 0.33 | 0.33 | 0.33 | 0.33 |
| n ≥ 1: | Expected cells per CT environment | 6.00 | 6.00 | 6.00 | 6.00 | 6.00 | 6.00 |
Given the above scenario, the queuing problem reduces to the formulation and performance analysis of the terror queue model, under the respective CT options, thereby making relevant inputs toward policy formulation and strategy modification for optimal CT operation. Such intelligent terror management system would allow for a better understanding of terrorist traffic and combat cells formation, hence, synergizing optimal allocation of the available CT resources toward the prevention and control of terrorism.
Formulation of SD-TQM :(M/M/k; k≥1):
Considering the above SD-TQM and its related recruitment dynamics, this section presents the mathematical formulation of a SD-TQM for M / M / k, k ≥ 1, queuing configuration, and the quantitative analysis of its operating characteristics. Suppose, we let k denote the number of CT options (servers) available for deployment on n number of terrorist cells at each CT cycle. Let Pn denote the probability that there are n terrorist cells in the CT environment per CT cycle. Then, by applying the SD-TQM measure of Section 3.1 on the above terror queue, the transition can be tabulated as follows:
Table 3.1: Transition of SD-TQM
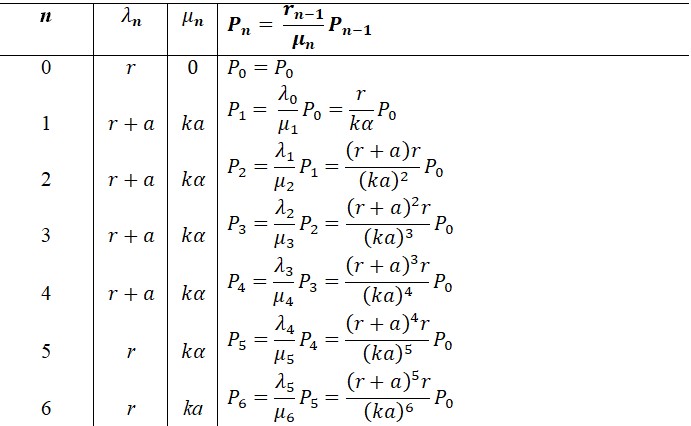
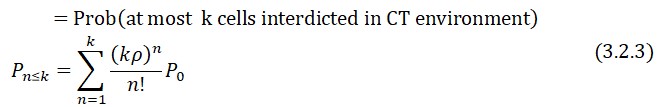
Considering the transition on Table 3.1 above, and by equation 3.0.7, the probability that there is no terrorist cell in the CT environment after a given CT cycle (Prob(n≥1)) cells) is given by:
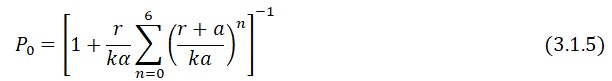
The probability that there is at least 1- terrorist cell in the CT environment after a given CT cycle (Prob(n ≥ 1)) cells) is given by:
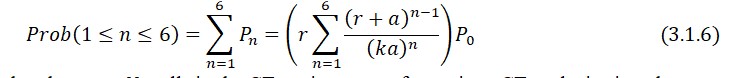
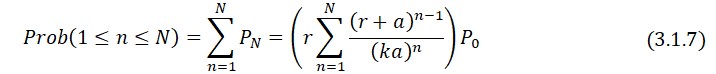
Therefore, the probability that there are N– cells in the CT environment after a given CT cycle, is given by:
The traffic intensity of a CT environment is given by: ρ = λ[kμ]-1 = r[ka]-1. We assumed that if a terrorist is detected in the CT environment, he/she must be targeted and interdicted immediately. However, if his/her interdiction is forestalled due to some preferential interdiction policy (e.g., prioritized leadership decapitation or Sacred Cow syndrome) or intelligence lapse or system failure, then, the additional time required to complete the interdiction such a terrorist follows an exponential distribution with mean: ρ-1 = kμλ-1 = kar-1.
System Size/Queue Length Distribution: By equation (3.0.8), the total number of terrorist cells established (detected and interdicted) in the CT environment after a given CT cycle is given by:
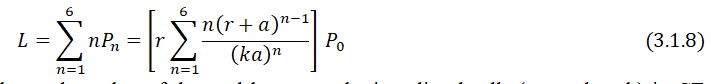
And by equation (3.0.9) the total number of detected but yet to be interdicted cells (queue length) in CT environment after a given CT cycle is given by:
Therefore, the total number of terrorist cells interdicted in a CT environment after a given CT cycle is given by:
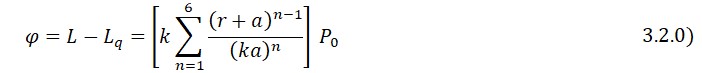
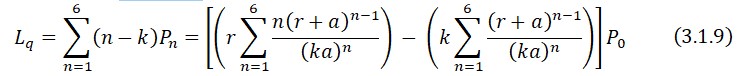
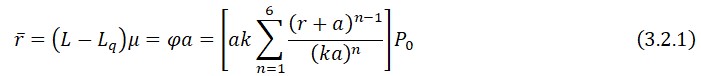
System Waiting/Response Time Distribution: Let ω and ωq denote the expected duration of a terrorist cell in the CT environment before and after interdiction, respectively. Then the effective terrorist flow rate (r ̅ ) – the average rate at which terrorist cells are established in the system is given by:
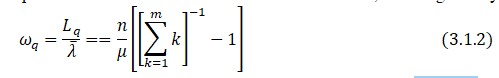
By equation (3.1.1), the expected duration a detected terrorist cell can exist in the CT environment before interdiction is given by:![]() . Also, by equation (3.1.2), the duration a terrorist cell can exist in CT environment after detection is given by:
. Also, by equation (3.1.2), the duration a terrorist cell can exist in CT environment after detection is given by: ![]() . Therefore, the time taken to target and interdict a terrorist cell in the CT environment (response time) after detection is given by:
. Therefore, the time taken to target and interdict a terrorist cell in the CT environment (response time) after detection is given by: ![]()
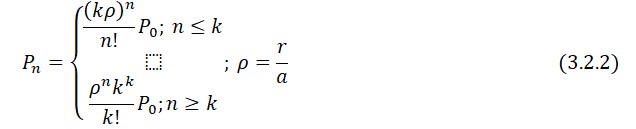
System Behaviour: By the state-dependent nature of the CT environment, suppose the queue is not empty (CT environment has at least n ≤ k cells), then we assumed that a detected cell must be targeted and interdicted immediately, otherwise a new cell will be established. Now, let Pn be the steady state probability that there are n-cells in the CT environment. Then by PASTA property, this is also the probability that n-terrorists are seen by an arbitrary arrival at a given CT cycle. Then Pn can be given by:
The probability that a new cell will be established, given that there are n ≤ k cells in CT environment is given by: Prob(Terrorist Entering CT environment) = Prob(At least one detected cell in CT environment)
Similarly, the probability that a new cell cannot be established, given that there are n ≥ k cells in CT environment is given by:
Prob(Terrorist balking from CT environment) = Prob(At least k detected cell in CT environment)
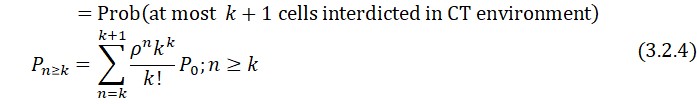
By equation (3.1.3), the probability that the interdiction of a newly established cell will be delayed, given that there are n > k detected cells in CT environment is:
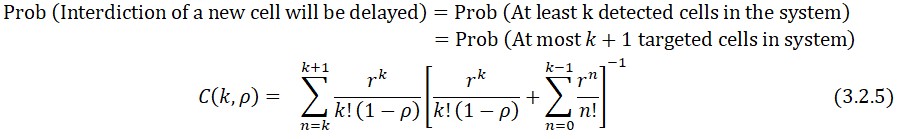
System Fairness Characteristics: By the basic principle of social justice: “equally needy members of a group should share equally the resources available to the group”[19],[21]. Also, by application Resource Allocation Queue Fairness (RAQF) metrics[23]: “at every cycle of CT operation, that there are n-terrorist cells in the queue, all cells (or operatives) deserved prompt targeting and interdiction…, any deviation from this standard creates discrimination (positive or negative)”. According to Raz et al[23], accounting for such discriminations and their summary statistics yield a measure of unfairness of CT environment. Suppose Li denote the total number of terrorist cells in CT environment, and Ki, the number of CT options (servers) available at i-CT cycle. Then, by RAQF fairness principle, the momentary warranted interdiction rate Ri of a terrorist cell at the -cycle is given by: Ri (t) = ki Li-1. Let σi be the momentary granted interdiction rate per -CT cycle of operation, then the momentary fair interdiction rate δi at an i-cycle of operation be given by: δi = σi-Ri. δi can be viewed as the rate at which a CT force discriminates against a terrorist cell at an i-CT cycle. A positive or negative value of δi indicates that the CT option was fair or unfair, and thus, more or less terrorists’ cells than require at the i-CT cycle was interdicted. Therefore, the total discrimination rate, D over the n-CT cycle, is be given by:
Similarly, a positive or negative value of D indicates that the CT option was fair or unfair, and thus, interdicted more or less terrorists’ cells than required at the nth-CT cycle.
System Unfairness Coefficient: Let E[Di]; i = 1,2,3…. denote the expected value of discrimination of a given CT option at i-CT cycle, given that a new terrorist cell formed meets n-cells in the CT environment (including the ones targeted for interdiction). Let Pk be the steady state probability that there are k-celles in the CT environment. Analogous to the “class discrimination” version of RAQF metrics[23], the expected discrimination (unfairness) of a CT option, given the probability that a new terrorist cell form encountered n ≤ k cells in the CT environment is given by:
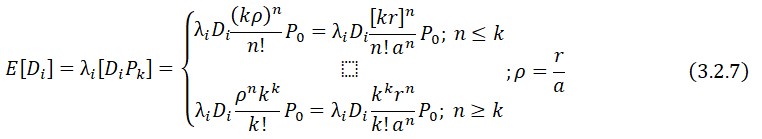
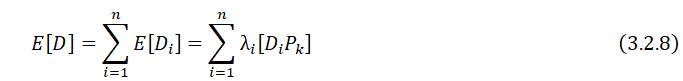
Where Pk is as defined in equation (3.1.2), and the accumulative discrimination over the n-CT cycle is given by:
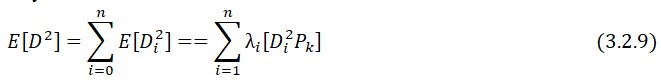
System Efficiency: Let E[D2 |k] denote the expected value of the square of discrimination of a given CT option over the n -CT cycles, given that a new terrorist cell formed meets k-cells in the CT environment (including the ones targeted for interdiction). Therefore, the system efficiency denoted by the second moment of D (total discrimination) is given by:
And by Sztrik[27] the overall efficiency of the system, denoted by Var[D] is given by:
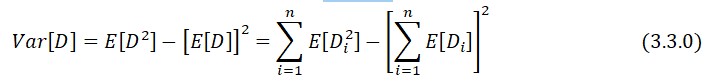
The validity and reliability of equation (3.3.4) is determined in the confidence interval: CI=D_n±t_(α⁄2) √(Var[D]); where α=0.05 (5%) level of significance.
RESULT OF THE ANALYSES
After due corroboration, and cross referenced of the secondary dataset with stakeholders, and repented terrorists in Nigerian CT environment, and the CT’s goal of boosting terrorists’ IPD by at least 20% (d ≥ 0.2) via viable Carrot instruments, as well as enhancing interdiction accuracy via 5% specialized SIOP agents, the table-4.0 below present a summary of operating characteristics of the SD-TQM. The results of the analyses are reviewed under the following headings: (i) the System Traffics/Utilization factor, (ii) System Size/Queue Length Distribution (iii) System Waiting/Response Times Distribution (iv) System Behaviour/Delay Distribution, and (v) System Unfairness Coefficient/Efficiency.
Table 4.0: Performance Characteristics of SD-TQM
| Terror Queueing Performance Measures | S | C | S+ | C+ | SC | SC+ | |
| A. | Mean arrival rate per CT cycle,(r) | 6.07 | 6.07 | 6.07 | 6.07 | 6.07 | 6.07 |
| Mean Interdiction rate per CT cycle(α) | 7.284 | 7.891 | 7.587 | 8.194 | 9.105 | 9.408 | |
| B. | System traffic intensity(ρ) | 0.833 | 0.769 | 0.4 | 0.3704 | 0.3333 | 0.2151 |
| System utilization factor (1-ρ) | 0.167 | 0.231 | 0.6 | 0.6296 | 0.6667 | 0.7849 | |
| Prob (Idle servers – no cell in system)(p0) | 0.0145 | 0.0187 | 0.3722 | 0.4156 | 0.4743 | 0.7974 | |
| Prob (Having at least a cell in system)(p1) | 0.5361 | 0.5548 | 0.6974 | 0.671 | 0.631 | 0.3693 | |
| C. | Total cells in CT environment (L) | 2.6601 | 3.0451 | 2.2279 | 2.0807 | 1.8791 | 0.7565 |
| Total cells on the Queue (Lq) | 2.5718 | 2.9434 | 1.9981 | 1.8595 | 1.6713 | 0.574 | |
| Total cells interdicted in the System(φ) | 0.0883 | 0.1017 | 0.2298 | 0.2212 | 0.2078 | 0.1825 | |
| Effective flow rate in the System(r ̅ ) | 0.6432 | 0.8025 | 1.7435 | 1.8125 | 1.892 | 1.717 | |
| D. | Mean waiting time in the System (ω) | 4.1357 | 3.7945 | 1.2778 | 1.148 | 0.9932 | 0.4406 |
| Mean waiting time after detection (ωq) | 3.9984 | 3.6678 | 1.146 | 1.0259 | 0.8834 | 0.3343 | |
| System response time (T) | 0.1373 | 0.1267 | 0.1318 | 0.122 | 0.1098 | 0.1063 | |
| Mean system (Resident) time (p-1) | 1.2005 | 1.3004 | 2.5 | 2.6998 | 3.0003 | 4.649 | |
| E. | Prob (a new cell) in the System | 0.122 | 0.125 | 0.045 | 0.042 | 0.082 | 0.026 |
| Prob (No new cell) in the System | 0.04 | 0.044 | 0.988 | 0.986 | 0.954 | 0.987 | |
| Prob (Delayed Interdiction) | 0.974 | 0.435 | 0.352 | 0.251 | 0.204 | 0.189 | |
| F. | System Discrimination, D | -42.44 | -7.996 | 3.206 | 2.888 | 3.058 | 8.072 |
| System Efficiency, Var[D] | 69.486 | 2.713 | 0.254 | 0.017 | 0.127 | 0.012 | |
System Traffics/Utilization factor
By system traffic intensity, the analyses underscore the measures of how busy the CT environment is (terrorist flow) under a given CT option – the rate of utilization of respective CT options during the 6 recruitment cycles of the organization. With an average recruitment rate of 6.07 operatives/cycle, column B of Table 4.0 above shows the variation of the respective CT option’s interdiction rate with the system traffics and utilization. Considering the statistics on Table 4.0, the correlation coefficient (ri; i = 1,2,…,4) analyses indicates that, the CT options’ interdiction rate (α) is negatively correlated with the system traffic intensity ρ (r1 = -0.7666,p < 0.001); a positively correlated with the system utilization factor, 1-ρ, (r2 = 0.7666,p < 0.001); and positively correlated with the probability of having a terrorists free system, P0 (r3 = 0.8336,p < 0.001), but negatively correlated with the probability of having at least a terrorist cell in the systemP1 (r4 =-0.4586,p < 0.001).
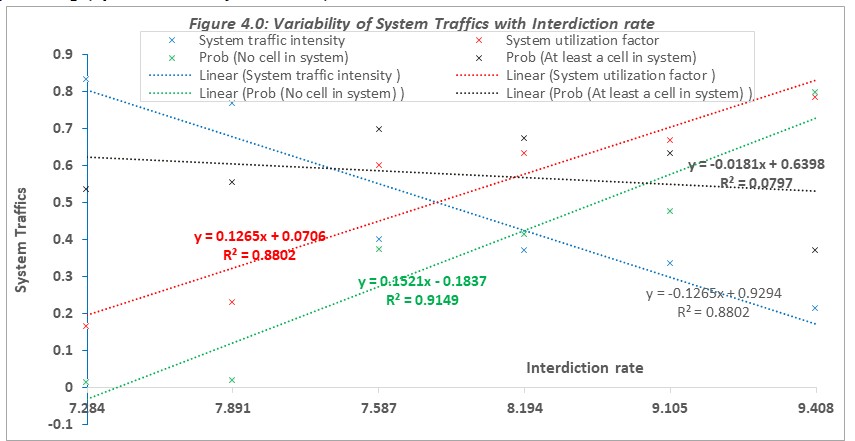
The negative correlation suggests that as the interdiction rate increases, the lower the system traffics, and the probability of having at least a terrorist cell in the system degreases correspondingly. Whereas, the positive correlation suggests that as the interdiction rate increases, the system utilization factor, and the probability of having no terrorists cell in the system also increase correspondingly. This implies that, the CT options with enhanced interdiction accuracy (viable Carrot instruments or specialized SIOP agents or both) have a lower potential to attract terrorists into the system and a higher probability of not having a terrorist cell. Conversely, intelligence-deficient CT options have a higher potential to attract terrorists and a lower probability of not having a terrorist cell.
The coefficient values of -0.7666, indicates a very strong negative relationship between a CT options’ interdiction rates and the system traffic intensity. Whereas, the coefficient values of 0.7666, and 0.8336 indicates a very strong positive relationship between a CT option’s interdiction rate and its utilization factor, as well as with its probability of guaranteeing no terrorist cell in the system. Also, the coefficient values of -0.4586, indicates a strong negative relationship between a CT option’s interdiction rate and the probability of having at least a terrorist cell in the system.
Corroborating the correlation analyses, Figure 4.0 above, gives the respective linear regression models of the interdiction rate with respect to the system traffic intensity, y1 = -0.1265x + 0.9294, (blue curve); the system utilization factors y2 = 0.1265x + 0.0706 (red curve); probability of empty system y3 = 0.1521x – 0.1837 (green curve); and the probability of having at least one terrorist cell y4 = -0.0181x + 0.6398 (black curve), respectively. These equations define the relationship between the system traffic intensity (y1); the system utilization factors (y2); the probability of empty system (y3); the probability of having at least one terrorist cell (y4), and the CT options’ interdiction rate (x), under 88.02% ; ![]()
![]() , goodness of fits, respectively.
, goodness of fits, respectively.
Security Implication of the Correlation between Interdiction rates and System Traffics: By exploring the security implications of the correlation between interdiction rates and system traffics in the context of CT measures, the negative correlation between the interdiction rate of CT options and the system’s traffic intensity, suggests that as more terrorists enter the system, the chances of detecting and interdicting them decrease. This creates a problem as increased traffic intensity can provide cover for terrorists to blend in with the crowd and carry out their activities undetected. Other significant security implications include:
Increased Probability of Terrorist Cells and Decreased Effectiveness of CT Options: The negative correlation indicates that as the number of terrorist cells in the system increases, the effectiveness of interdiction decreases. This poses a concern because it implies that as the terrorist threat level rises, CT options become less effective in identifying and neutralizing the threat. Terrorists can exploit this weakness and carry out their activities with a higher probability of success. It also suggests that CT options are less effective in detecting and neutralizing terrorist threats as the system becomes busier or the likelihood of terrorist presence increases.
Concealment within Normal Traffic: The negatively correlated interdiction rate allows terrorists to take advantage of high system traffic intensity to blend in with the general population. This makes it more challenging for security personnel to identify suspicious individuals or activities. The increased congestion and chaos in crowded environments provide cover for terrorists to operate covertly. If the interdiction rate of CT options decreases in such scenarios, it indicates that the system is ill-equipped to handle the increasing demands of security screening and threat detection. This can lead to delays, system failures, and vulnerabilities that terrorists can exploit.
Implications for Public Confidence: A negatively correlated interdiction rate can erode public confidence in the effectiveness of CT options and the system’s ability to protect them. If people perceive the system as ineffective in detecting and preventing terrorist threats, they may lose trust in its ability to ensure their safety. This can result in increased anxiety, decreased utilization of the system, and disruptions in public services.
Addressing these implications requires a comprehensive approach, such as improving surveillance capabilities, enhancing interdiction strategies, optimizing resource allocation, and investing in advanced technologies for threat detection. Balancing system efficiency with security effectiveness is crucial to mitigate the risks associated with terrorism in queuing systems. Reassessing and strengthening CT measures is essential to ensure the safety of the system and its users.
System Size and Queue Length Distribution
The difference between the total number of terrorist cells in the system and those on the queue (detected) is often a measure of the actual number of terrorist cells interdicted in the CT environment over the whole CT cycle, and hence, the success rate of a given CT option. With an average recruitment rate of 6.07 operatives/cycle, column C of Table 4.0 above shows the variation of the respective CT option’s interdiction rate with system size and queue length distributions. Considering the statistics on Table 4.0, the correlation coefficient (ri; i=1,2,…,4) analyses indicates that, the CT options’ interdiction rate (α) is negatively correlated with the system size L (r1 = -0.8164,p < 0.001); negatively correlated with the queue length, Lq, (r2 = -0.8131,p < 0.001); but positively correlated with the number of cells interdicted ,φ, (r3 = 0.4124,p < 0.001), and also positively correlated with the system effective flow rate r ̅ (r4 =0.6295,p < 0.001), respectively. The negative correlations suggest that, as the interdiction rate increases, the system size, and the queue length decreases correspondingly. Whereas, the positive correlations suggest that, as the interdiction rate increases, the number of cells interdicted and with the system effective flow rate also increases correspondingly.
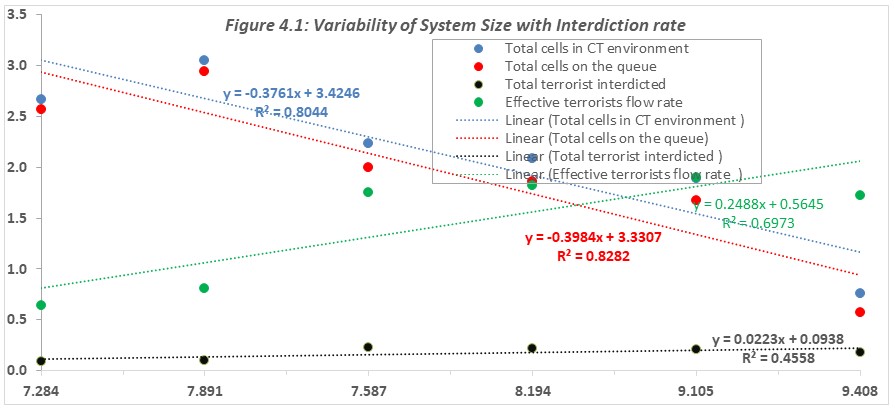
The coefficient values of -0.8164, and -0.8131 indicates a very strong negative relationship between a CT options’ interdiction rates and system size, as well as with the queue length respectively. While, the coefficient values of 0.4124, and 0.6295 indicates a strong and very strong positive relationship between a CT option interdiction rate and the number of interdicted cells, as well as with the system effective flow rate, respectively. Corroborating the correlation analyses, Figure 4.1 above gives the respective linear regression models of the system interdiction rate with respect to the system size, y1 = -0.3761x + 3.4246, (blue curve); the queue length, y2 = -0.3984x + 3.3307 (red curve); the number of interdicted cells y3 =0.0223x + 0.0938 black curve); and the system effective flow rate y4 = 0.2488x + 0.5645 (green curve), respectively. These equations define the relationship between the system size (y1); the queue length (y2); the number of interdicted cells (y3); the system effective flow rate (y4), and the CT options’ interdiction rate (x), under 80.44 % ![]() goodness of fits, respectively
goodness of fits, respectively
Security Implication of the Correlation between CT options’ Interdiction rates and System Size:
By examining the security implications of the correlation between the interdiction rates of CT (CT) options and the size of the system, a negative correlation, indicating that as the system size increases, the effectiveness of CT options’ interdiction rates decreases. This poses a potential vulnerability in combating larger-scale terrorist activities. Other significant security implications include:
- Impact on Queue Length: The negative correlation between the interdiction rate of CT options and the queue length suggests that higher interdiction rates result in shorter queues of terrorists awaiting interdiction. This implies that a more effective and efficient CT effort can reduce the backlog of terrorists in the queue, leading to a potentially lower risk of successful attacks. Additionally, the positive correlation between the interdiction rate and the number of terrorist cells interdicted suggests that a higher interdiction rate can target and disrupt a greater number of terrorist cells, enhancing the effectiveness of CT operations.
- Improvement in System Efficiency, Collaboration, and CT Effectiveness Evaluation: The positive correlation between the interdiction rates of CT options and the system’s effective flow rate indicates that higher interdiction rates are associated with a more efficient flow of terrorists through the system. This highlights the importance of a proactive and successful interdiction strategy in expediting the processing of terrorists and improving overall CT efficiency. It emphasizes the need for collaboration, information sharing, and resource allocation to enhance interdiction capabilities, intelligence gathering, surveillance, and law enforcement activities. Strengthening international cooperation and coordination can lead to more effective CT outcomes. Monitoring and analyzing interdiction rates, system size, and queue length can help security agencies evaluate the effectiveness of their strategies and identify areas for improvement.
- Adaptive Terrorist Strategies and CT Policy Considerations: The correlations suggest that terrorists may adapt their recruitment and operational strategies based on the effectiveness of CT interdiction efforts. CT agencies need to continuously adapt their approaches to stay ahead of evolving terrorist strategies. Allocating resources to CT options with higher effective terrorists’ flow rates and greater interdiction of terrorist cells can yield better results. Strategic focus should be on disrupting terrorist cells with a higher potential for attacks or those part of larger networks. This requires credible intelligence-driven decision-making and coordination among security agencies. The correlations can also influence CT policy decisions, prioritizing interdiction capabilities through investments in intelligence gathering, technology, training, and international cooperation. Trade-offs between interdiction activities and complementary CT measures like community engagement, deradicalization programs, and intelligence sharing should be considered. Risk assessment and mitigation strategies can be informed by understanding the relationship between interdiction rates and queue length.
In summary, the security implications of the correlation between CT options’ interdiction rates and system size depend on the specific context, nature of terrorist threats, operational environment, and CT agencies’ capabilities. Continuous monitoring, evaluation, and adaptation are crucial to address emerging challenges and ensure the effectiveness of CT options.
System Waiting and Response Times Distribution
The system waiting and response times of a terror queue is a measure of the total amount of time a terrorist cell or a terrorists must have spent in system after detection before he/she is finally interdicted. With an average recruitment rate of 6.07 operatives per CT cycle, column D of Table 4.0 above shows the variation of the respective CT option’s interdiction rate with system waiting and response time distributions. Considering the statistics on Table 4.0, the correlation coefficient (ri;i=1,2,…,4) analyses indicates that, the CT options’ interdiction rate (α) is negatively correlated with the system waiting time ω (r1 =-0.7261,p < 0.001); negatively correlated with the queue waiting time, ωq, (r2 = -0.7225,p < 0.001); and negatively correlated with the System response time T, (r3 = -0.9977,p < 0.001), but positively correlated with the system resident time ρ(-1) (r4 =0.8578,p < 0.001), respectively.
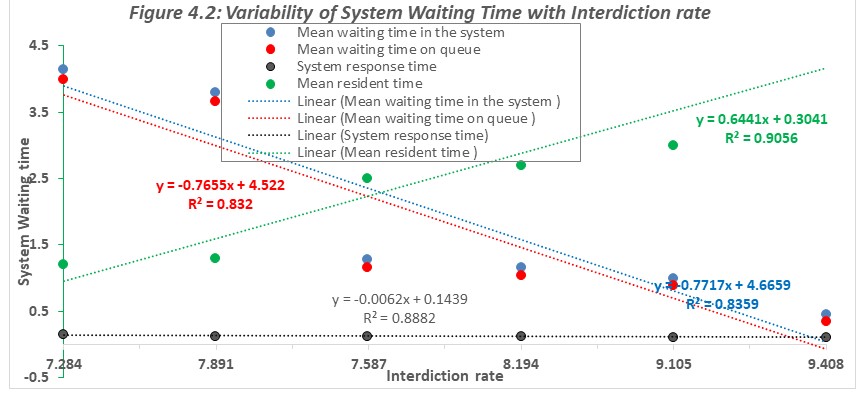
The negative correlations suggest that, as the interdiction rate increases, terrorists waiting time in the system, and on the queue, as well as the system response time, decreases correspondingly (see Figure 4.2). While the positive correlations suggest that, as the interdiction rate increases, the system resident time also increases correspondingly. The coefficient values of -0.7261,-0.7225, and -0.9977 indicates a very strong negative relationship between the CT options’ interdiction rate and the system waiting time, the waiting time on queue and the system response time, respectively. While the coefficient values of 0.8578 indicates a very strong positive relationship between the CT options’ interdiction rate and the system resident time.
Corroborating the correlation analysis, Figure 4.2 above, gives the linear regression models of system interdiction rate with respect to the system waiting time, y1 =-0.7717x + 4.6659 (blue curve), terrorists’ waiting time on queue y2 = -0.7655x + 4.522, (red curve); the system response time y3 =-0.0062x + 0.1439 (black curve), and the system resident time y4 =0.6441x + 0.3041 (green curve). These equations define the relationship between the system waiting time (y1); terrorist waiting time on queue (y2); the system response time (y3); the system resident time (y4), and the CT options interdiction rate (x), under 83.59% ![]() goodness of fits, respectively.
goodness of fits, respectively.
Security Implication of the Correlation between Interdiction rates and System Waiting Times: By exploring the security implications of the correlation between interdiction rates and system waiting times in a counterterrorism (CT) system, negative correlation suggests that the system is designed to minimize the time terrorists spend waiting in queues; achieved through efficient security screening processes, intelligence gathering, resource allocation, and streamlined queuing mechanisms. Other significant security implications included:
- Trade-off between Security and Efficiency: The negative correlation between interdiction rates and waiting times, queue waiting times, and system response times indicates a trade-off between CT measures and system efficiency. While minimizing waiting and response times can enhance user experience and system throughput, it may potentially reduce the effectiveness of CT measures. Rapid processing and movement of individuals can lead to decreased scrutiny and a higher risk of security breaches.
- Increased Risk of Undetected Threats: When interdiction rates are negatively correlated with waiting and response times, there is a higher likelihood of potential threats going undetected. Emphasizing speed and efficiency may compromise thoroughness in security checks, allowing individuals with malicious intent to bypass or exploit vulnerabilities. This increases the vulnerability to undetected threats and poses a significant security risk.
- Potential Security Breaches: The reduced time available for comprehensive security checks increases the chances of missing suspicious behaviors or concealed threats, creating opportunities for security breaches. Terrorists can exploit these gaps to infiltrate the system, smuggle weapons, or coordinate attacks. However, a positive correlation between interdiction rates and system resident time suggests higher scrutiny for individuals spending more time in the system, aiding in identifying potential threats.
- Public Frustration and Compliance Issues: A negative correlation between interdiction rates and waiting times may be positively perceived by the public due to shorter queues and reduced waiting times. However, compromised CT measures can lead to public frustration, concerns about personal security, and negative perceptions. This can erode public trust, cooperation, and compliance with security protocols.
In summary, balancing system efficiency and security effectiveness is vital in addressing the security implications of the correlation between interdiction rates and system waiting times. Implementing robust CT measures, leveraging advanced technologies, training security personnel, optimizing queuing algorithms, and fostering collaboration can mitigate security risks and ensure the safety of individuals within the CT system. Maintaining a dynamic approach to security is essential to adapt to evolving threats and maintain a secure environment.
System Behaviour/Delay Distribution
The system behaviour and delay distribution are measures of terrorist flow-in and flow-out of the system, during the busy and less busy period of CT operations. respectively. With an average recruitment rate of 6.07 operatives per CT cycle, column E of Table 4.0 above shows the variation of the respective CT option’s interdiction rate with system behaviour and delay distribution. Considering the statistics on Table 4.0, the correlation coefficient (ri;i=1,2,3) analyses indicates that, the CT options’ interdiction rate (α) is negatively correlated with the probability of forming a new terrorists’ cell in the system (r1 =-0.5112,p < 0.001); positively correlated with the probability that a new terrorists’ cell cannot be form in the system, (r2 = 0.5935,p < 0.001); and also negatively correlated with the System delay probability, (r3 = – 0.7499,p < 0.001), respectively.
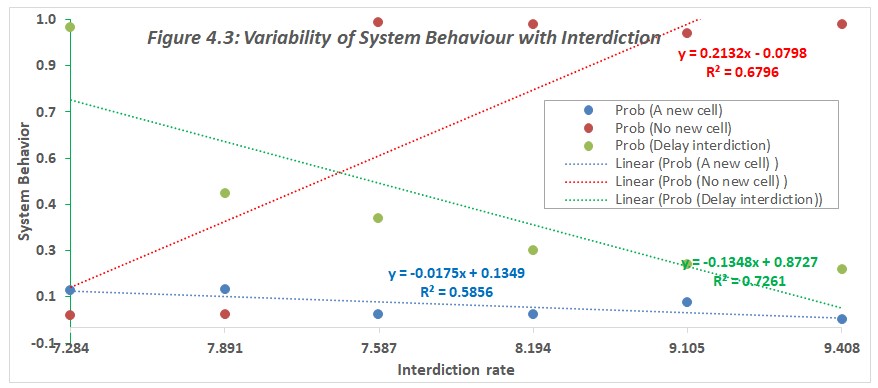
The negative correlations suggest that, as the interdiction rate increases, the probability of terrorists forming a new cell, and the system delay probability decreases correspondingly. Whereas, the positive correlations suggest that, as the interdiction rate increases, the probability that terrorists cannot forming a new cell in the system increases correspondingly (see Figure 4.3). The coefficient values of -0.5112,, and – 0.7499 indicate a very strong negative relationship between the interdiction rate and the probability of forming a new terrorists’ cell, as well as with the system delayed probability respectively. While the coefficient values of 0.5935 indicate a very strong positive relationship between the interdiction rate and the probability that a new terrorists’ cell cannot be form in the system.
Corroboration the correlation analysis, Figure 4.7 above, represent the linear regression models of interdiction rate with respect to the probability of forming a new terrorists cell (blue curve), y1 =-0.0175x + 0.1349; the probability that a new terrorists cell cannot be form (red curve), y2 = 0.2132x – 0.0798; and the system delay probability (green curve): y3 -0.1348x + 0.8727, respectively. These equations define the relationship between the probability of forming a new terrorists’ cell (y1); the probability that a new terrorists’ cell cannot be form (y2); the system delay probability (y3), and the interdiction rate (x), under 58.56% ![]() goodness of fits, respectively.
goodness of fits, respectively.
Security Implication of the Correlation between CT options’ Interdiction rates and System Behavior: By exploring the relationship between the effectiveness of CT options and the behavior of the overall system, the security implications that arise from the correlation between the interdiction rates of CT options and various system behaviors, may include the followings:
- Negative Correlation with Waiting Times: The document reveals a negative correlation between the interdiction rates of CT options and system waiting times. This suggests that when CT measures are more effective at intercepting threats, waiting times for individuals within the system tend to be shorter. This implies that efficient security screening processes, optimized resource allocation, and streamlined queuing mechanisms are in place to minimize waiting times and enhance the overall efficiency of the system.
- Negative Correlation with Response Time: Similarly, a negative correlation is observed between the interdiction rates of CT options and system response times. This indicates that when CT measures are more successful, the system can promptly respond to security incidents. This focus on quick response times contributes to reducing the vulnerability of individuals within the system to potential security threats.
- Trade-off between Security and Efficiency: The negative correlations between interdiction rates and waiting times, as well as response times, suggest a trade-off between CT measures and system efficiency. While minimizing waiting and response times can enhance user experience and system throughput, it may potentially compromise the effectiveness of CT measures. Balancing system efficiency with robust security measures becomes crucial to ensure both the smooth functioning of the system and the ability to detect and mitigate threats effectively.
- Increased Risk of Undetected Threats: When interdiction rates of CT options are negatively correlated with waiting times and response times, there is a higher likelihood of potential threats going undetected. Emphasizing speed and efficiency in the system may compromise the thoroughness of security checks, allowing individuals with malicious intent to exploit vulnerabilities and evade detection. This increases the risk of undetected threats and poses a significant security concern.
- Potential Security Breaches: The reduced time available for security personnel to perform comprehensive checks due to shorter waiting times and response times can create opportunities for security breaches. Insufficient scrutiny increases the chances of missing suspicious behaviors, prohibited items, or concealed threats. This can allow terrorists to infiltrate the system, smuggle weapons or explosives, and coordinate attacks, leading to serious security incidents.
- Public Perception and Compliance: While shorter waiting times may be positively perceived by the public, compromised CT measures and reduced scrutiny can result in public frustration and concerns about the system’s ability to ensure their safety. This can lead to decreased public cooperation, non-compliance with security protocols, or even avoidance of using the system altogether. Striking a balance between CT measures and user experience is crucial to maintain public trust and cooperation.
In summary, the correlation between the interdiction rates of CT options and system behavior has significant security implications. It highlights the trade-off between security and efficiency, the increased risk of undetected threats, the potential for security breaches, and the importance of public perception and compliance. Balancing system efficiency with robust CT measures, optimizing security protocols, and maintaining public trust are essential to mitigate security risks and ensure the safety of individuals within the system.
System Unfairness Factor
By system efficiency, the analysis underscores the potentials of the relevant CT options to optimize the available CT resources toward maximizing terrorist interdiction over a given CT cycle, as well as over the entire 6 CT cycles. With an average recruitment rate of 6.07 operatives per CT cycle, column F of Table 4.0 above shows the variation of the respective CT option’s interdiction rate with system discrimination and efficiency distribution.
Considering the statistics on Table 4.0, the correlation coefficient (ri;i=1,2) analyses indicates that, the CT options’ interdiction rate (α) is positively correlated with the system discrimination rate (r1 =0.67,p < 0.001); and negatively correlated with the system unfairness coefficient, (r2 =-0.5697,p < 0.001). The positive correlations suggest that, as the interdiction rate increases, the discrimination rate increase correspondingly. Whereas, the negative correlations suggest that, as the interdiction rate increases, the system unfairness coefficient decreases correspondingly (see Figure 4.4). The coefficient values of 0.67, and -0.5683, indicate a very strong positive relationship between the interdiction rate and the system discrimination rate, but a strong negative relationship between the interdiction rate and the system unfairness.
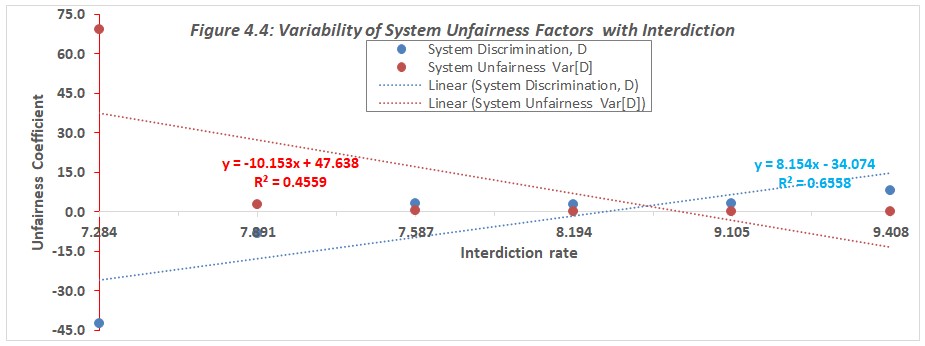
Corroborating the correlation analyses, Figure 4.4 above, represent the linear regression models of CT options’ interdiction rate with respect to the system discrimination rate (blue curve), y1 =8.154x – 34.074; and the system unfairness coefficient (red curve), y2 = -10.153x + 47.638; respectively. These equations define the relationship between the system discrimination (y1), its unfairness factor (y2), and its interdiction rate (x), under 65.58% (R2= 0.6558); and 45.59% (R2= 0.4559); goodness of fits, respectively
Security Implication of the Correlation between Interdiction rates and System Unfairness Factors:
By explores the relationship between the effectiveness of CT measures and system fairness factors. the security implications that arise from the correlation between interdiction rates of CT options and system discrimination rates, unfairness coefficients, and other factors. May include the follows:
- Effectiveness and Efficiency: The document suggests that when the interdiction rate of CT measures is positively correlated with the system discrimination rate, it indicates that the CT measures are effective in accurately identifying and intercepting potential threats. A higher discrimination rate means the system can distinguish between threats and non-threats more accurately, leading to a higher interdiction rate. However, it is important to strike a balance between effectiveness and efficiency to avoid unnecessary delays or inconveniences for individuals who do not pose a threat.
- Bias and Fairness: The document also highlights the negative correlation between the interdiction rate of CT options and the system unfairness coefficient. This suggests that the CT measures aim to minimize bias or unfair treatment. A lower unfairness coefficient indicates a more equitable treatment of individuals, regardless of their demographic characteristics. However, it is crucial to regularly assess and mitigate biases that may be present in the system to ensure fair, objective, and unbiased CT measures.
- Racial and Ethnic Profiling: The correlations between interdiction rates, discrimination rates, and unfairness coefficients can have unintended consequences. If the discrimination rate is high while the unfairness coefficient is also high, it may indicate disproportionate targeting of specific groups, potentially leading to social tensions or perceptions of discrimination. Striving for a balance that maximizes security while minimizing unjust treatment is essential to avoid negative societal implications.
- Privacy Concerns and System Vulnerabilities: A high discrimination rate and interdiction rate may suggest an effective system in identifying potential threats. However, it is important to consider privacy concerns associated with intrusive CT measures. Adversaries may exploit vulnerabilities in the system, and maintaining a balance between security and privacy is crucial to avoid unnecessary infringement on individual rights.
- Public Perception, Legal, and Ethical Considerations: The correlations between these factors have legal and ethical implications. CT measures that disproportionately target specific groups or violate individuals’ rights can raise concerns and diminish public trust. It is important to align CT efforts with legal frameworks, human rights standards, and ethical principles to maintain the rule of law and protect individual liberties.
In summary, the document emphasizes the need to strike a balance between effective threat identification, fair treatment, and the avoidance of unintended consequences. Maximizing security while upholding ethical standards, fairness, and public trust is crucial. Continuous assessment, adaptation, and addressing emerging challenges are essential for effective CT efforts.
Correlation of CT Options:
Considering the statistics on Table 4.0, the correlation coefficient (r) analysis indicated a significant positive correlation between the intelligence deficient Stick and Carrot, (r = 0.5614,p < 0.001), CT options, and also a significant positive correlation between specialized SIOP controlled Stick and the specialized SIOP supervised Carrot, (r = 0.9967,p < 0.001) CT options. The coefficient values of 0.5614, and 0.9967, indicates a very strong positive relationship between intelligence deficient Stick CT option and Carrot CT options, a very strong positive relationship between SIOP controlled Stick CT option and SIOP supervised Carrot CT options. The security implications of these correlation can be analysed as follows.
Security Implications of Positive Correlation between Intelligence-deficient Stick and Carrot CT Options: By exploring the relationship between two CT approaches, namely the Stick CT option and the Carrot CT option, the security implications of a positive correlation between these two approaches, highlights the need for a balanced and comprehensive strategy. Other significant security implications are as follows:
- Balanced Approach: The document emphasizes the importance of adopting a balanced approach to enhance the effectiveness of CT efforts. The Stick CT option involves aggressive law enforcement tactics, while the Carrot CT option focuses on preventive measures and community engagement. The positive correlation suggests that relying solely on aggressive law enforcement measures without addressing underlying grievances and root causes of terrorism may be insufficient and counterproductive in the long term. Therefore, a comprehensive strategy that combines proactive law enforcement with preventive and community-focused initiatives can yield better security outcomes.
- Synergistic Effects and Collaboration: The positive correlation indicates synergistic effects when both the Stick and Carrot CT options are employed simultaneously. Effective law enforcement measures can disrupt terrorist networks, providing valuable intelligence for preventive measures and community engagement efforts. Conversely, community engagement initiatives can build trust, enhance intelligence gathering, and support law enforcement activities. Collaboration among security agencies, communities, and stakeholders is crucial for ideal CT efforts. By engaging local communities and fostering partnerships, security agencies can create a collaborative environment that supports both CT options.
- Intelligence-Driven and Contextual Approach: The positive correlation emphasizes the significance of intelligence in guiding CT efforts. Both the Stick and Carrot CT options rely on accurate and timely intelligence. Strengthening intelligence capabilities and fostering information sharing among security agencies is necessary to enhance the effectiveness of both approaches. Additionally, the correlation suggests that the two options should be deployed in a targeted and contextual manner, taking into account specific characteristics of the threat landscape and local dynamics.
- Intelligence Deficiency Mitigation and Multidimensional Approach: The positive correlation highlights the need to address intelligence deficiencies in CT efforts. Investing in intelligence capabilities, technological advancements, information sharing mechanisms, and international cooperation can help mitigate intelligence deficiencies and enhance overall security. Governments and security agencies may need to invest in both law enforcement capabilities and preventive measures. A multidimensional approach that combines intelligence operations, law enforcement actions, preventive initiatives, and social interventions can address the multifaceted nature of terrorism.
- Evaluation, Adaptation, and International Cooperation: Continuous evaluation, adaptation, and international cooperation are essential in countering terrorism. The positive correlation emphasizes the need for collaboration and information sharing among nations to enhance collective CT capabilities. Monitoring the effectiveness of both CT options, measuring their impact, and conducting rigorous assessments can identify areas for improvement. Flexibility and adaptability are key to refining approaches and ensuring the effectiveness of CT efforts.
It is important to note that the specific security implications may vary depending on the context, nature of the threat, and socio-political environment. Implementing these approaches requires a nuanced understanding of the dynamics between the Stick and Carrot CT options and adapting strategies based on the evolving threat landscape to achieve desired security outcomes effectively.
Security Implications of Positive Correlation of SIOP Driven Stick with SIOP Supervised Carrot CT options: By exploring the security implications of the correlation between the SIOP-driven Stick CT option and the SIOP-supervised Carrot CT option, the positive correlation emphasizes the benefits of deploying both options simultaneously, and also the importance of intelligence integration, coordination, and continuous evaluation. Other salient security implications include.
- Coordinated Intelligence-Driven CT Operations: The positive correlation suggests that the SIOP-driven Stick and SIOP-supervised Carrot CT options can be deployed together to enhance coordinated and intelligence-driven CT operations. SIOP agents play a vital role in gathering intelligence, infiltrating terrorist networks, and disrupting their activities through targeted operations. The Stick variant involves direct action against terrorists, while the Carrot variant utilizes gathered intelligence for preventive measures and engagement with at-risk individuals or communities. Coordinated intelligence gathering between SIOP agents of both options is crucial for a comprehensive understanding of the threat landscape and effective decision-making.
- Targeted Disruption of Terrorist Networks: The correlation implies that combining the SIOP-driven Stick and SIOP-supervised Carrot CT options can lead to more targeted and effective disruption of terrorist networks. SIOP agents, through their undercover roles, can penetrate terrorist organizations, identify key individuals, and gather actionable intelligence. This information can be used to implement measures that prevent attacks, mitigate radicalization, and dismantle terrorist networks. The collaboration between SIOP agents and the supervised Carrot CT options optimizes operational planning, risk assessment, and resource allocation, enhancing the disruption efforts.
- Targeted Preventive Measures and Coordinated Response: The positive correlation indicates that the intelligence gathered through covert operations can inform targeted preventive measures. By understanding the tactics, plans, and vulnerabilities of terrorist networks, the supervised Carrot CT options can implement strategies to counter radicalization, address grievances, and disrupt the drivers of terrorism. Effective coordination between covert agents of both CT options ensures synchronized efforts, appropriate information sharing, and efficient resource allocation. This coordination leads to a comprehensive and cohesive response to the terrorist threat, leveraging the strengths of both approaches.
- Covert Operations Effectiveness and Continuous Evaluation: The integration of SIOP-driven Stick CT option with SIOP-supervised Carrot CT options enhances the overall effectiveness of CT efforts. Covert operations, driven by skilled agents, provide valuable intelligence, disrupt terrorist activities, and neutralize high-value targets. The supervised Carrot CT options leverage this intelligence to implement preventive measures and engage with at-risk individuals. Regular evaluation and adaptation of strategies are necessary to refine approaches and identify areas for improvement, ensuring that CT efforts remain effective and aligned with evolving threats.
- Risk Mitigation, Agent Training, and Collaboration: Covert operations involve inherent risks, and the positive correlation emphasizes the importance of close supervision and support from the Carrot CT options to mitigate these risks and enhance agent safety. Robust training, ongoing support, and collaboration between covert agents and their supervisors optimize results. Collaboration allows for real-time intelligence exchange, coordination of efforts, and resource optimization.
- Ensuring Accountability, Legal, and Ethical Considerations: The positive correlation highlights the need for a robust system of oversight and accountability to prevent abuses and ensure adherence to legal and ethical standards. Transparency, checks, and balances are crucial for maintaining the legitimacy and effectiveness of covert operations within the CT framework. Adherence to legal and ethical standards, strict oversight, and accountability mechanisms are essential to prevent abuse and maintain public trust.
It is important to note that the effectiveness of the SIOP-driven Stick and SIOP-supervised Carrot CT options depends on various factors, including intelligence quality, agent capabilities, coordination, and the specific threat context. Regular evaluation, adaptation, and adherence to legal and ethical standards are necessary to achieve desired security outcomes effectively.
RECOMMENDATIONS
To optimize the terror queueing model (TQM) for effective and efficient CT operations, the following relevant measures should be considered:
- Interdiction Rate: Maximize the system’s ability to identify and intercept potential threats through robust intelligence gathering, reliable threat assessment, and proactive measures.
- Discrimination Rate: Maximize the system’s ability to accurately differentiate between threats and non-threats, minimizing false positives and false negatives.
- System Efficiency: Maximize the utilization of resources to ensure effective allocation and minimize waste.
- Intelligence Integration: Facilitate timely information sharing and analysis among relevant stakeholders to enhance CT operations.
- Unfairness Coefficient: Minimize bias and unfair treatment of individuals by implementing objective and transparent protocols and procedures.
- False Positives and False Negatives: Minimize instances where innocent individuals are mistakenly flagged as threats or potential threats go undetected.
- Processing Time: Minimize delays and streamline operational processes to ensure efficient CT operations.
- Queue Length: Minimize long queues and congestion to reduce inconveniences for the public.
Additionally, the study highlights the importance of combining CT strategies for a balanced and coordinated approach. The “Stick” CT option, focusing on aggressive law enforcement, and the “Carrot” CT option, emphasizing conciliatory initiatives, should be deployed simultaneously. Trust, collaboration, and information sharing among security agencies, communities, and stakeholders are crucial in this approach.
Finally, the significance of coordinated and enhanced intelligence-driven CT operations was also emphasized, as coordinated intelligence gathering, particularly through the use of specialized SIOP agents, would enhance effectiveness and strategic decision-making. SIOP agents play a vital role in gathering intelligence, infiltrating terrorist networks, and disrupting their activities, contributing to overall CT optimization.
CONCLUSION
In conclusion, the research work on “An Assessment of Counter-Terrorism Options: A State Dependent Terror Queuing Model Perspective” provides valuable insights into optimizing CT efforts through the application of an SD-TQM. The study examines various performance measures and strategies to enhance the effectiveness and efficiency of CT operations. The research highlights the importance of maximizing key performance measures such as the interdiction rate, discrimination rate, system efficiency, and intelligence integration. These measures ensure the successful identification and interception of threats, accurate differentiation between threats and non-threats, optimal resource utilization, and effective integration of intelligence for proactive CT actions.
Additionally, the study emphasizes the need to minimize factors such as system unfairness, false positives and negatives, system processing time, and queue length. Minimizing these factors reduces biases, errors in threat identification, delays, and congestion in CT operations. The research underscores the value of combining CT strategies, particularly the correlation between the Stick (aggressive law enforcement) and Carrot (interventionist and conciliatory initiatives) options. Simultaneously deploying compatible CT strategies, including their intelligence-driven variants, leads to a balanced, coordinated, and enhanced intelligence-driven CT approach. This not only maximizes effectiveness but also contributes to the de-legitimization of terrorism and its ideologies.
The study argues against relying solely on brute force or aggressive measures and emphasizes the importance of credible intelligence in guiding CT operations. It recommends leveraging specialized SIOP agents for enhanced intelligence gathering and covert supervision of terrorists’ compliance with viable conciliatory instruments in the CT environment. Privacy considerations are also addressed, emphasizing the importance of respecting individuals’ privacy rights while maintaining necessary CT measures. Striking a balance between security needs and privacy concerns requires robust safeguards, strict data protection policies, and adherence to legal and ethical standards.
Overall, the research provides a comprehensive assessment of CT options through the lens of the SD-TQM. It contributes to the existing literature on CT research and offers valuable insights for optimizing CT efforts, maintaining public trust, and upholding legal and ethical standards. The findings underscore the need for continuous evaluation, adaptation to evolving threats, and the development of efficient and adaptive approaches to combat terrorist organizations. The research work lays a solid foundation for further exploration and refinement of CT strategies, with the aim of achieving optimal outcomes in the ongoing fight against terrorism.
REFERENCES
- Aaron C. and Kristian S. G., (2011): “The Developmental Dynamics of Terrorist Organizations”. Santa Fe Institute, Santa Fe, NM 87501, USA and Centre for the Study of Civil War, Oslo, Norway.
- M. Lee, (1968): Applied queuing theory, MacMillan, London, 1968
- Andrea Seidl, Edward H. Kaplan, Jonathan P. Caulkins, Stefan Wrzaczek, Gustav Feichtinger (2015): Optimal Control of a Terror Queue. Operations Research and Control Systems Institute of Statistics and Mathematical Methods in Economics Vienna University of Technology, (Research Report 2015-12) September, 2015. Pp 1-22.
- Butler, L.B. (2011): Hezbollah: The Dynamics of Recruitment. US Marine Corps, School of Advanced Military Studies. US Army Command and General Staff College, Fort Leavenworth, Kansas AY 2011-01.
- Wang, Y. Li, and X. Zhang (2023): State-dependent Queuing Models for Service Systems. https://www.mdpi.com/2071-1050/14/21/14104
- Erlang, A. (1909): The theory of probabilities and telephone conversations. Nyt Tidsskrift for Matematik B 20 (1909), 33–39.
- Kelly and R. J. Williams (1991): Optimal Control of a State-Dependent Queuing System with Applications to Traffic Signal Control. Journal of Advances in Applied Probability” in the year 1991
- Guiora, A. N., (2008): Fundamentals of Counterterrorism. Aspen Publishers, New York,
- Gutfraind, A. (2009): Mathematical Terrorism: “Understanding Terrorist Organizations with a Dynamic Model.” A PhD dissertation. Studies in Conflict & Terrorism 32: 45-59, SIAM Journal, October 2009.
- Hossein Abouee-Mehrizi, Opher Baron, and Joseph L. Rotman (2015): State-Dependent Queueing Systems. https://www-2.rotman.utoronto.ca/opher.baron/files/A21_state- dependent%20MG1%20queueing%20systems.pdf
- Horgan, J. (2005): The Psychology of Terrorism. New York, NY: Routledge, Sept 2005
- van der Wal, M. van der Heijden, and R. van der Mei (2022): Validating state-dependent queues in health care. Queueing System 100, 505–507 (2022). https://doi.org/10.1007/s11134-022-09827-x. https://link.springer.com/article/10.1007/s11134-022-09827-x
- D. Little (1961): A proof of the queuing formula L = λW, Opns. Res., 9 (1961), pp. 383–387
- Kaplan, E. H. (2010). Terror queues. Operations Research, 58(4-part-1):773–784.
- Kaplan, E.H. and Feinstein, J.S. (2012): Intel Queues. Military Operations Research, V17, pp17-30, N1 2012, doi 10.5711/1082598317117.
- Kaplan, E. H. (2013): Staffing models for covert counterterrorism agencies. Socio-Economic Planning Sciences, 47(1):2–8.
- Kaplan, E. H. (2015). Socially efficient detection of terror plots. Oxford Economic Papers, 67(1):104–115.
- Kress, M., & Szechtman, R. (2009): Why defeating insurgencies is hard: The effect of intelligence in counterinsurgency operations – A best case scenario. Operations Research 57(3), 578-585.
- Mona Khechen (2013): Social Justice: Concepts, Principles, Tools and Challenges. Economic and Social Commission for Western Asia (ESCWA), Distr. LIMITED E/ESCWA/SDD/2013/Technical Paper.9 16 December 2013
- Gans, G. Koole, and A. Mandelbaum (2003): State-dependent Queuing Models for Call Centers. Journal of Operations Research. https://www.scirp.org/reference/ReferencesPapers.aspx? ReferenceID=210563
- Olga Nikolić and Igor Cvejić (2017): Social Justice and the Formal Principle of Freedom. UDK: 316.34 https://doi.org/10.2298/FID1702270N Original scientific article Received: 15.5.2017 — Accepted: May 2017
- Paul K. Davis (2014): Toward Theory for Dissuasion (or Deterrence) by Denial: Using Simple Cognitive Models of the Adversary to Inform Strategy. International Security and Defense Policy Center, RAND NSRD WR-1027, January 2014. http://www.rand.org/nsrd/ndri/centers.
- Raz D., Levy H. and Avi-Itzhak, (2004): A Resource Allocation Queuing Fairness Measure. In Proceedings of Sigmetrics 2004/Performance 2004 Joint Conference on Measurement and Modeling of Computer Systems, pp 130-141, New York, NY, June 2004. (Performance Evaluation Review, 32(1):130-141).
- Sasaki, T., Brännström, Å, Dieckmann, U. & Sigmund, K. (2012): Institutional delivery of incentives and assessment of voluntary participation. Proc. Natl Acad. Sci. USA 109, 1165–1169 (2012).
- K. Singh and S. K. Bose (2020): “State dependent queueing models under admission control. Journal of Ambient Intelligence and Humanized Computing, Original Research, Vol. 11, pg 3873–3891, (2020). https://link.springer.com/article/10.1007/s12652-019-01638-y.
- Stefan Wrzaczek, Edward H. Kaplan, Jonathan P. Caulkins, Andrea Seidl, Gustav Feichtinger (2016): Differential Terror Queue Games. Operations Research and Control Systems Institute of Statistics and Mathematical Methods in Economics Vienna University of Technology, (Research Report 2016-02) March, 2016, pp1-16.
- Sztrik, J. (2012): Basic Queuing Theory. University of Debrecen, Faculty of Informatic.http://irh.inf.unideb.hu/user/jsztrik/education/05/3f.html.
- Udoh, I.J., Michael O. Oladejo & Hycienth O. Orapine (2019): Assessing the Effectiveness of “Carrots and Sticks” Approach on Terrorists’ Strength and Sustainability: A Mathematical Deterministic Model. International Journal of Research and Innovation in Applied Science (IJRIAS) Vol.4 (2), 11- 27, February 2019.www.rsisinternational.org/ journals/ijrias/ DigitalLibrary/Vol.4 Issue2/11-27.pdf.
- Victor Asal, Brian J. Phillips, R. Karl Rethemeyer, Corina Simonelli and Joseph K. Young (2018): Carrots, Sticks, and Insurgent Targeting of Civilians. Journal of Conflict Resolution, 1- 26, DOI: 0.1177/0022002718789748. http://www.journals.sagepub.com/home/jcr