
Analysis of Flood Incidence in the River Dilimi Catchment Area of Plateau State
- Shiphrah Retu Afsa
- Isaac Shola Laka
- Gerald Tsemwan Maigida
- Gad Dauda Sumdhin
- 360-378
- Jun 15, 2024
- Environmental Impact +1 more
Analysis of Flood Incidence in the River Dilimi Catchment Area of Plateau State
Shiphrah Retu Afsa1 ٭, Isaac Shola Laka2, Gerald Tsemwan Maigida2, Gad Dauda Sumdhin3
1National Center for Remote Sensing Jos, Plateau, Nigeria
2 Department of Geography University of Jos, Plateau, Nigeria
3 Century mining Company Riruwai, Doguwa Kano, Nigeria
٭Corresponding Author
DOI: https://doi.org/10.51584/IJRIAS.2024.905032
Received: 28 April 2024; Accepted: 13 May 2024; Published: 15 June 2024
ABSTRACT
The study cataloged flood incidences and analyze rainfall characteristics in the Dilimi Catchment. Climate Hazards Infrared Precipitation with Stations (CHIRPS) rainfall data set for the catchment for a 35years (1985-2019) period was collected and analyzed while vigorous literature search was carried out to assemble dates of flood incidences in the catchment. The average yearly amount of rainfall for the period is 1256.18mm with a minimum of 1110.69 mm and a maximum amount of 1379.15mm.
Rainfall data from Result revealed that Alternate hypothesis is accepted as the result is significant at 0.01 levels for a two-tailed test. This shows a positive correlation between flood year and anomaly years but weak. It suggests that rainfall is increasing over time in the study area. This goes to prove that rainfall is not the only driver of floods in the catchment. Overflowing of rivers, blocked/poor drainage contributes to flood occurrence in the Dilimi river catchment. Recommendations given include continual monitoring and study of rainfall characteristics and other climatic data such information will be helpful for planning purposes, construction of integrated drainages system and legislation against dumping of refuse on roads and drainages
Keywords: Catchment, Catalogue, Climate, Rainfall data, Correlation, Dilimi, Anova.
INTRODUCTION
Floods have long been recognized as complex environmental problems with multifaceted origins and impacts. The increasing risks of floods due to climate change and variability such as the cycle of warm and cold temperatures in poor and developing countries have been stated by Agbonkhese, Agbonkhese, Aka, Joe-Abaya, Ocholi, and Adekunle (2014); Zbigniew, Kundzewice, Sonia, John, Newille and Pascal (2013). Climate change causes frequent, severe weather, and climate events that threaten sustainable development globally. Climate change including rising temperatures and increasing variable rainfall patterns have resulted in increased frequency of extreme weather events such as floods and drought (Olanrewaju, Ekiotuasinghan and Godwin 2017).
Floods are environmental hazards largely caused by meteorological factors, but very often induced by man’s improper utilization or abuse of the physical environment (Ibrahim & Abdullahi, 2016). This occurs both in the developed and developing world and is usually associated with heavy losses of life, property, misery, hardship, diseases, and at times famine (Okorie, 2010). Floods are among the most recurring and devastating natural hazards, impacting human lives and causing severe economic damage throughout the world. They are extreme hydrological events that are independently distributed in time and characterized by their magnitude and reoccurrence (Alexander, 2020).
Flooding is also, a common environmental problem in Nigeria that occurs when a body of water moves over and above an area of land that is not normally submerged. It is the inundation of an area not normally covered with water, through a temporary rise in the level of river, lake, or sea (Nelson, 2001). It is a natural consequence of streamflow in a continually changing environment. Sada and Odemerho (1988) view it as an unusually high rate of discharge, often leading to inundation of lands adjacent to streams; it is usually caused by intense or prolonged rainfall. Flooding worldwide is accompanied by losses and related human health impacts to include loss of lives, damage to properties, and destruction of the physical environment (Penning, Jonson, Tunstall, Top sell, Morris, Chatterton & Green, 2005). The frequency of this natural disaster has been on an increase over the years. Flooding is divided into three major types which are categorized as river floods, flash floods, and coastal floods (Smith & Ward, 1998).
According to Houston (2011), Bashir, Oludare, Johnson, Aloysius (2012) and Douglas (2008) flooding in Nigeria are mainly fluvial (resulting from rivers overtopping their natural and manmade defences), coastal (affecting mainly the coastal areas), and pluvial (flash, arriving unannounced following a heavy storm) in nature and have been a major cause of concern for rural and urban areas within the country. Flooding is also attributed to the occurrence of high rainfalls for days in a catchment (Jimoh and Ayodeji, 2003). Adeoye, Ayanlade, Babatimehin, (2009); Adedeji, Odufuwa, Adebayo, (2012) and Terungwa & Torkwasa (2013) listed the causes of floods to include climate change, poor urban and environmental management along with anthropogenic activities. Consequently, there has been an unprecedented increase in occurrences of floods and their associated negativities in most countries (Morales, 2002). Etuonobe (2011) cited that in Nigeria, reports have shown that devastating flood disaster had occurred in Ibadan (in the years 1985, 1987, 1990, and 2011), Osogbo (1992, 1996, 2002 and 2010), Yobe (2000), Akure (1996, 2000, 2002, 2004 and 2006) and the coastal cities of Lagos, Ogun, Port Harcourt, Calabar, Uyo, Warri amongst others. These have claimed many lives and properties worth millions of Naira have been lost.
MATERIALS AND METHODS
The data used for this research are quantitative and qualitative. Quantitative data are based on the measurement of quantities or amounts while qualitative data involves the use of words to describe the subject of interest. In this wise, specific quantitative data needs for this work are as follows:
- Data on rainfall i.e. daily, monthly, and annual rainfall data for the Dilimi catchment area.
- Flood dates and records for the River Catchment area
Data Source
Sources of data for this study are mixed sources, from both primary and secondary sources.
Primary Source
Primary data in this study is obtained through a reconnaissance survey.
Secondary Data
These are data derived from existing sources to enhance the research. The secondary data for this research was obtained from websites, articles, maps, newspapers, journals, published annual and reports. Incidences of floods were gathered from published articles and some agencies such as National Emergency Management Agency (NEMA), Plateau State Management Agency (SEMA) while rainfall data for the catchment was extracted from Climate Hazards Infrared Precipitation with Stations (Chirps), and world datasets bank which is a quasi-global rainfall dataset that captured the river catchment area. This data assembled spanned for thirty-five (35) years (1985-2019).
Methods of Data Collection
The methods that are adopted for data gathering in respect to this study include reconnaissance survey and data from Climate Hazards Infrared Precipitation with Stations (Chirps).
Reconnaissance survey
A reconnaissance survey was carried out on the study area to be familiar with the area under study and also get some raw data from the community on the incidence of flood over past years was conducted to acquire data in the study area. And the type of activities carried out. The observation was conducted and carried out in such a way that the analysis of data will arrive at an objective judgment. The coordinates of the study area were assembled using the Geographical Position System (GPS) method. During the survey, the researcher discovered that Dilimi River runs through Jos North Local Government Area, stationed at about 200m away from the British-American Bridge, through the Jos University pedestrian bridge, which links the University of Jos Students Village with the University permanent site
Statistical Analysis
A Series of analytical techniques was employed to achieve the aim and objectives of the study as well as to make discernible decisions. Rainfall characteristics analytical techniques as used by Olarenwaju et al, (2017), Igweze et al. (2014), and Ologunorisa (2006) were adopted in this study to relate flood incidences in the study area. These include daily, monthly and yearly amounts of rainfall, variability, trends, and fluctuation of rainfall.
To analyze the rainfall Characteristics in the Dilimi Catchment Area: The rainfall characteristics used for this study include daily, the monthly and yearly amount of rainfall, variability, trends, and fluctuation (dry and wet spell) of rainfall.
Amount: The daily, monthly and total annual amount was plotted using line graph.
To calculate the amount of rainfall, both yearly for thirty-five (35) years, the formula below was adopted after Afangideh, et al (2013);
Rainfall Depth =
Rainfall Variability: The rainfall anomaly index (RAI) formula was used to determine the variability of rainfall over 35 years.
RAI =
Where,
x is annual rainfall totals
¯x is the mean of the entire series
S is the standard deviation from the mean of the series.
To describe the rainfall pattern of Dilimi Catchment Area: Climate Hazards Infrared Precipitation with Stations (Chirps) will be used in chapter 4 because is a 35year quasi-global rainfall data set that determine the patterns/trends of rainfall in the study area. (Funk et al; 2012; 2015), to further examine the nature of the trends rainfall pattern was auto-fitted using an Excel software package.
Catalogue Floods Years in River Dilimi Catchment Area
To ascertain rainfall anomaly years: Standardized Rainfall Anomaly Index (SRAI) was used to determine years of dryness and wetness. Cataloguing is used in this study to know flood incidences in the River Dilimi Catchment Area.
To relate rainfall amount and flood years in the catchment area: The Pearson product which explains the probability of exceedances. The correlation and ANOVA methods were used to establish the significant relationship between rainfall amounts and flood years in the River catchment area using an Excel software package.
RESULT AND DISCUSSION
Rainfall Characteristics in the Dilimi Catchment
1. General description of rainfall statistics
Rainfall data from 1985 to 2019 was assembled on daily records from the CHIRPS weather engine for a 35year period, for the catchment of study. This was summarized on a monthly and yearly basis to generate table 2. A statistical summary from table 3 was generated in excel and presented in table 4. From this table, a total of (43966.21mm) of rainfall was recorded in these 35 year periods with an average of (1256.18mm) of rainfall per year, the minimum rainfall amount was (1110.69mm) and the maximum amount (1379.15mm). The table also showed that numbers of significant rainfall months per year ranged from 6months to 10 months usually between March to October with traces in the months of November to February.
2. Average Rainfall for the Study Catchment
Rainfall distribution for the 35 years (figure 5) based on year average amount shows the average rainfall for each month of the year to range from 0.15mm in January and February with 1.0mm; in march, rainfall average was 26mm, April rose to 87mm, May 157mm and June 210mm; the month of July had 270mm, then August had the highest rainfall average of 289mm; after which the rainfall began to dip with September having 184mm, the October 43mm and November 1.0 mm; finally December 0.8mm of rainfall. This depicts the seasonality of rainfall in the catchment.
3. Probabilities of Exceedance (PX) of Ranked Annual Rainfall
Based on Hazen (1914), Weibull (1939), and California (1923) methods of estimating the probability of exceedances as explained in chapter 2, table 3 was generated from data in table 2. The probability of exceedance is the probability of the occurrence of a rainfall depth greater than.
Table 2: Rainfall Data from 1985 – 2019
| YEAR | Jan | Feb | Mar | Apr | May | Jun | Jul | Aug | Sep | Oct | Nov | Dec | |
| 1 | 1985 | 0.3 | 0.0 | 114.8 | 23.0 | 202.3 | 242.9 | 234.0 | 216.7 | 163.8 | 14.2 | 0.2 | 0.7 |
| 2 | 1986 | 0.3 | 0.0 | 24.8 | 56.4 | 131.3 | 170.7 | 348.4 | 206.4 | 188.8 | 28.1 | 3.0 | 0.0 |
| 3 | 1987 | 0.4 | 1.3 | 52.1 | 23.2 | 81.6 | 256.3 | 286.5 | 291.5 | 157.2 | 58.9 | 1.6 | 1.7 |
| 4 | 1988 | 0.1 | 0.0 | 22.9 | 134.0 | 171.8 | 190.6 | 232.0 | 198.2 | 211.7 | 24.4 | 0.0 | 2.1 |
| 5 | 1989 | 0.0 | 0.9 | 8.6 | 76.1 | 135.4 | 214.2 | 249.0 | 311.3 | 132.9 | 60.6 | 0.0 | 0.0 |
| 6 | 1990 | 0.3 | 0.0 | 8.2 | 50.5 | 234.6 | 205.8 | 247.8 | 226.9 | 182.7 | 33.8 | 0.3 | 2.1 |
| 7 | 1991 | 0.0 | 1.7 | 27.3 | 157.9 | 203.5 | 207.7 | 325.8 | 258.1 | 94.5 | 42.0 | 1.6 | 0.7 |
| 8 | 1992 | 0.4 | 0.0 | 26.1 | 130.2 | 166.2 | 227.8 | 295.9 | 301.9 | 181.3 | 34.7 | 4.0 | 0.0 |
| 9 | 1993 | 0.0 | 0.1 | 21.3 | 79.9 | 141.7 | 217.5 | 284.9 | 242.8 | 179.7 | 51.7 | 0.0 | 0.0 |
| 10 | 1994 | 0.0 | 0.0 | 6.7 | 121.7 | 131.3 | 197.3 | 226.6 | 344.3 | 211.7 | 74.1 | 0.8 | 1.2 |
| 11 | 1995 | 0.1 | 0.0 | 25.1 | 80.6 | 170.0 | 276.9 | 200.4 | 289.5 | 164.1 | 22.1 | 2.8 | 0.0 |
| 12 | 1996 | 0.0 | 3.3 | 26.0 | 70.1 | 191.5 | 212.2 | 191.3 | 358.3 | 289.3 | 36.1 | 0.0 | 1.1 |
| 13 | 1997 | 0.2 | 0.0 | 60.7 | 141.0 | 163.2 | 244.0 | 238.4 | 249.0 | 187.7 | 61.1 | 4.4 | 0.0 |
| 14 | 1998 | 0.0 | 0.0 | 12.6 | 64.5 | 153.8 | 179.9 | 242.4 | 273.1 | 199.4 | 30.4 | 0.0 | 0.0 |
| 15 | 1999 | 0.3 | 1.1 | 16.2 | 61.0 | 144.3 | 226.3 | 350.8 | 328.3 | 181.1 | 34.8 | 0.1 | 1.1 |
| 16 | 2000 | 0.0 | 0.0 | 11.1 | 56.9 | 140.0 | 198.3 | 292.4 | 289.7 | 180.3 | 56.4 | 0.0 | 2.2 |
| 17 | 2001 | 0.0 | 0.0 | 14.4 | 110.3 | 153.2 | 194.1 | 289.4 | 331.2 | 181.6 | 13.9 | 1.4 | 1.7 |
| 18 | 2002 | 0.0 | 0.7 | 29.2 | 105.7 | 145.9 | 249.8 | 293.9 | 258.1 | 162.5 | 55.9 | 0.4 | 1.1 |
| 19 | 2003 | 0.1 | 0.0 | 10.8 | 97.7 | 171.4 | 195.9 | 289.0 | 294.1 | 181.4 | 34.3 | 3.4 | 0.0 |
| 20 | 2004 | 0.1 | 0.0 | 10.0 | 81.5 | 180.4 | 146.0 | 259.6 | 235.4 | 162.1 | 35.3 | 0.4 | 0.0 |
| 21 | 2005 | 0.1 | 2.3 | 22.1 | 81.6 | 139.7 | 184.0 | 253.5 | 270.4 | 141.1 | 30.3 | 2.0 | 0.0 |
| 22 | 2006 | 0.2 | 3.4 | 25.7 | 49.2 | 185.0 | 166.0 | 257.8 | 374.9 | 222.1 | 45.0 | 0.0 | 0.0 |
| 23 | 2007 | 0.0 | 3.1 | 23.1 | 125.9 | 147.1 | 187.2 | 261.4 | 341.5 | 112.2 | 29.3 | 0.3 | 1.6 |
| 24 | 2008 | 0.3 | 0.0 | 20.9 | 61.3 | 171.6 | 184.7 | 357.3 | 310.1 | 132.9 | 22.8 | 0.0 | 2.2 |
| 25 | 2009 | 0.3 | 0.0 | 8.5 | 92.3 | 131.7 | 234.6 | 233.3 | 315.7 | 170.6 | 69.0 | 1.5 | 0.0 |
| 26 | 2010 | 0.4 | 0.1 | 23.4 | 67.5 | 166.2 | 166.6 | 344.3 | 289.5 | 197.0 | 74.7 | 0.1 | 1.3 |
| 27 | 2011 | 0.1 | 3.2 | 6.7 | 62.6 | 157.9 | 241.9 | 267.3 | 272.8 | 120.3 | 46.2 | 0.0 | 0.0 |
| 28 | 2012 | 0.2 | 0.0 | 10.4 | 119.5 | 187.2 | 217.0 | 320.5 | 235.1 | 173.9 | 60.9 | 1.9 | 0.0 |
| 29 | 2013 | 0.5 | 1.1 | 50.0 | 57.2 | 124.3 | 297.0 | 293.2 | 313.2 | 145.7 | 35.2 | 0.0 | 0.0 |
| 30 | 2014 | 0.5 | 2.1 | 41.5 | 135.4 | 160.3 | 183.2 | 236.8 | 278.6 | 190.4 | 43.3 | 4.0 | 0.0 |
| 31 | 2015 | 0.0 | 4.9 | 39.6 | 17.1 | 140.8 | 155.6 | 269.1 | 368.5 | 188.5 | 38.5 | 2.7 | 2.3 |
| 32 | 2016 | 0.0 | 0.0 | 49.0 | 158.0 | 142.8 | 178.8 | 274.0 | 291.8 | 151.7 | 32.0 | 0.1 | 2.0 |
| 33 | 2017 | 0.1 | 0.0 | 12.5 | 47.6 | 120.6 | 199.2 | 231.7 | 326.8 | 232.7 | 14.5 | 0.0 | 0.9 |
| 34 | 2018 | 0.1 | 4.0 | 20.0 | 114.7 | 156.5 | 149.0 | 204.2 | 349.1 | 188.4 | 120.5 | 0.2 | 1.7 |
| 35 | 2019 | 0.3 | 4.9 | 18.0 | 54.6 | 190.6 | 181.5 | 297.2 | 274.4 | 172.1 | 75.5 | 1.1 | 2.3 |
Table 3: Statistical Summary for Assemble Data
| Jan | JAN | FEB | MAR | APR | MAY | JUN | JUL | AUG | SEP | OCT | NOV | DEC | AVR |
| Mean | 0.16 | 1.09 | 25.73 | 84.76 | 158.16 | 205.15 | 270.86 | 289.06 | 175.23 | 44.02 | 1.09 | 0.86 | 1256.18 |
| Standard Error | 0.03 | 0.26 | 3.52 | 6.44 | 4.85 | 5.95 | 7.27 | 7.77 | 6.08 | 3.7 | 0.23 | 0.15 | 11.92 |
| Median | 0.11 | 0.05 | 22.15 | 79.85 | 156.49 | 198.25 | 267.3 | 289.72 | 180.33 | 36.15 | 0.33 | 0.73 | 1264.06 |
| Mode | 0 | 0 | #N/A | #N/A | #N/A | #N/A | #N/A | #N/A | #N/A | #N/A | 0 | 0 | #N/A |
| Standard Deviation | 0.17 | 1.56 | 20.81 | 38.09 | 28.68 | 35.22 | 43.01 | 45.98 | 35.99 | 21.92 | 1.37 | 0.89 | 70.53 |
| Sample Variance | 0.03 | 2.43 | 432.91 | 1450.77 | 822.62 | 1240.44 | 1850.24 | 2114.22 | 1295.09 | 480.3 | 1.88 | 0.79 | 4974.52 |
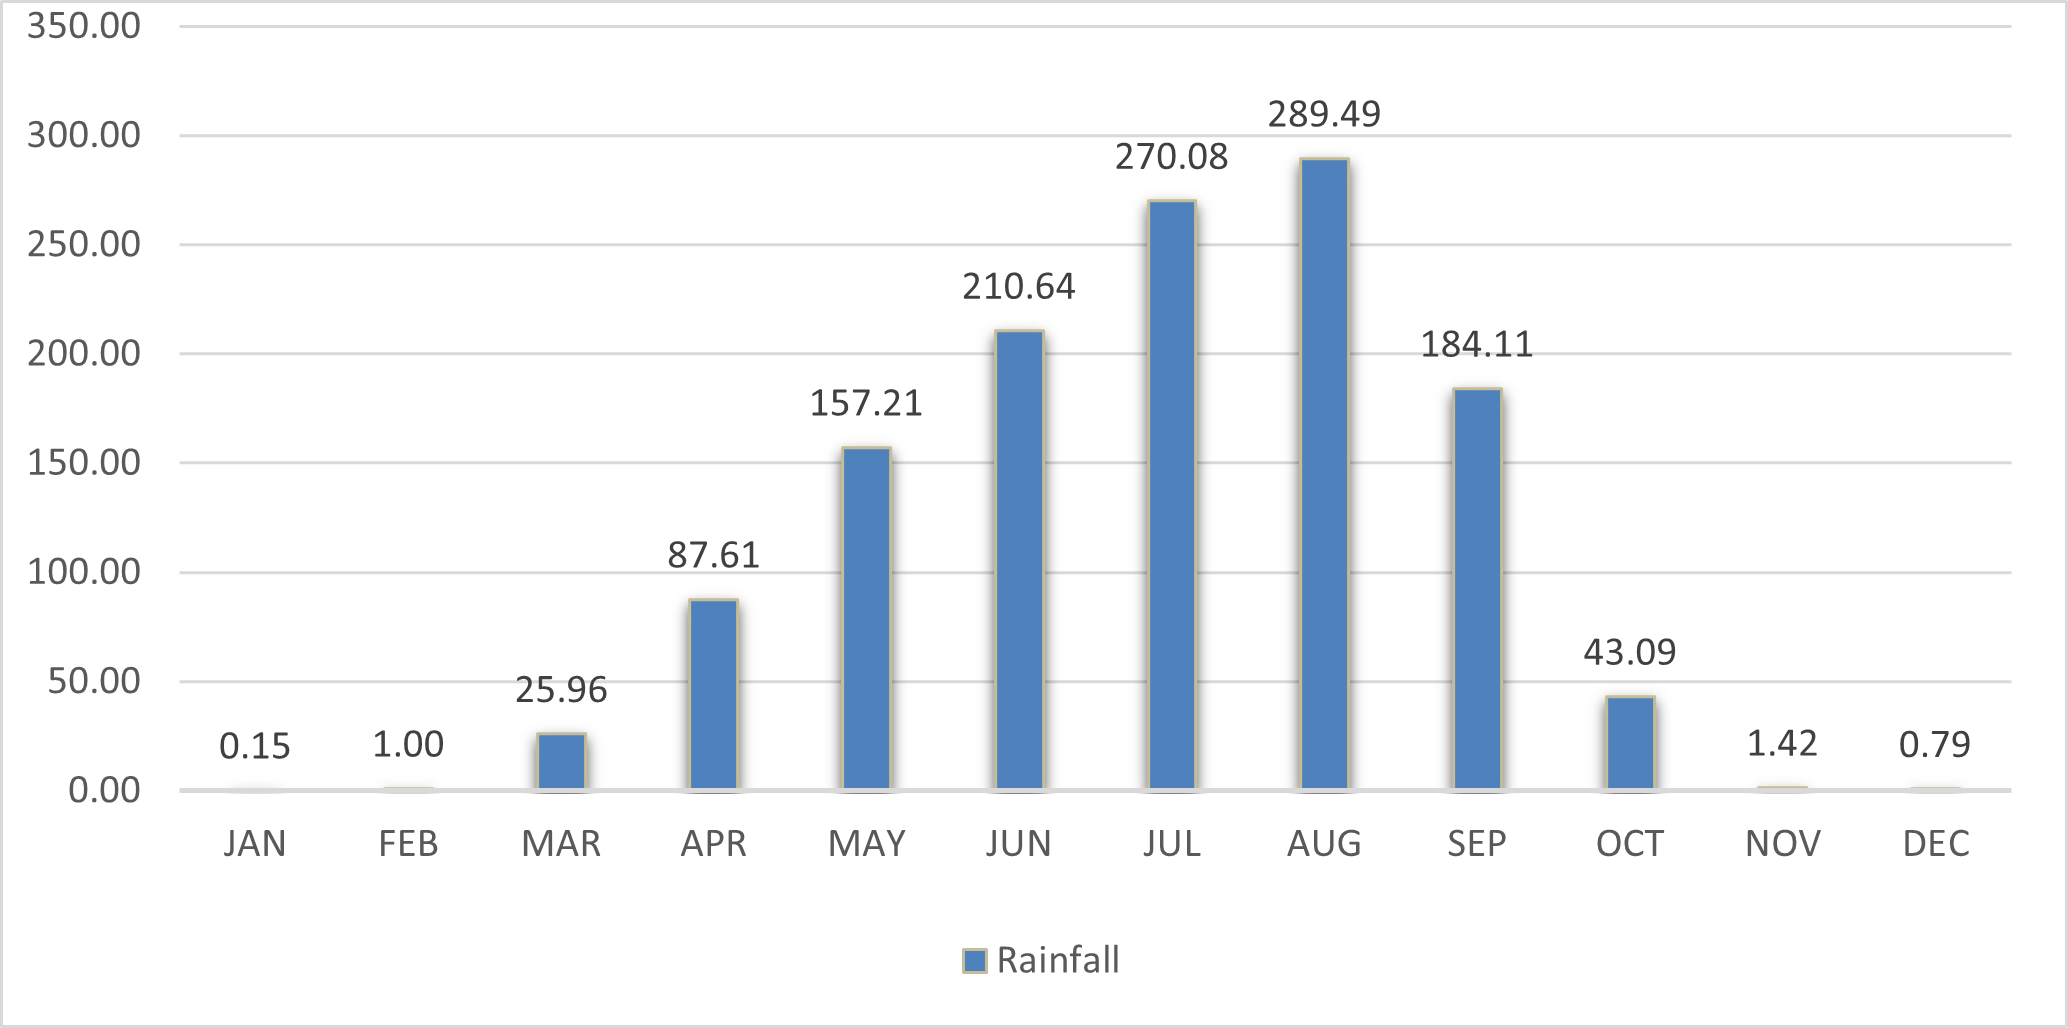
Figure 5: Average Monthly Rainfall Pattern (1985 to 2019)
Table 4: Probabilities of Exceedance of Ranked Annual Rainfall
| S/N. | YEAR | Rainfall Depth | Rank Number ( r ) | Estimate of Probability of Exceedance Px (%) | |||
| Hazen Px (%) | WelbulPx (%) | California Px (%) | Average
Exceedance(%) |
||||
| 1 | 1996 | 1379.1466 | 1 | 1.43 | 2.78 | 2.86 | 2 |
| 2 | 1992 | 1368.5179 | 2 | 4.29 | 5.56 | 5.71 | 4 |
| 3 | 1997 | 1349.5313 | 3 | 7.14 | 8.33 | 8.57 | 7 |
| 4 | 1999 | 1345.33 | 4 | 10.00 | 11.11 | 11.43 | 9 |
| 5 | 2010 | 1331.114 | 5 | 12.86 | 13.89 | 14.29 | 12 |
| 6 | 2006 | 1329.2679 | 6 | 15.71 | 16.67 | 17.14 | 14 |
| 7 | 2012 | 1326.5833 | 7 | 18.57 | 19.44 | 20.00 | 16 |
| 8 | 1991 | 1320.7006 | 8 | 21.43 | 22.22 | 22.86 | 19 |
| 9 | 2013 | 1317.4506 | 9 | 24.29 | 25.00 | 25.71 | 21 |
| 10 | 1994 | 1315.615 | 10 | 27.14 | 27.78 | 28.57 | 23 |
| 11 | 2018 | 1308.3145 | 11 | 30.00 | 30.56 | 31.43 | 26 |
| 12 | 2002 | 1303.3531 | 12 | 32.86 | 33.33 | 34.29 | 28 |
| 13 | 2001 | 1291.3297 | 13 | 35.71 | 36.11 | 37.14 | 30 |
| 14 | 2016 | 1280.1972 | 14 | 38.57 | 38.89 | 40.00 | 33 |
| 15 | 2003 | 1278.1514 | 15 | 41.43 | 41.67 | 42.86 | 35 |
| 16 | 2014 | 1276.1645 | 16 | 44.29 | 44.44 | 45.71 | 38 |
| 17 | 2019 | 1272.6006 | 17 | 47.14 | 47.22 | 48.57 | 40 |
| 18 | 2008 | 1264.0645 | 18 | 50.00 | 50.00 | 51.43 | 42 |
| 19 | 2009 | 1257.4432 | 19 | 52.86 | 52.78 | 54.29 | 45 |
| 20 | 2007 | 1232.6649 | 20 | 55.71 | 55.56 | 57.14 | 47 |
| 21 | 1995 | 1231.5211 | 21 | 58.57 | 58.33 | 60.00 | 49 |
| 22 | 2015 | 1227.6517 | 22 | 61.43 | 61.11 | 62.86 | 52 |
| 23 | 2000 | 1227.351 | 23 | 64.29 | 63.89 | 65.71 | 54 |
| 24 | 1993 | 1219.4896 | 24 | 67.14 | 66.67 | 68.57 | 57 |
| 25 | 1985 | 1213.049 | 25 | 70.00 | 69.44 | 71.43 | 59 |
| 26 | 1987 | 1212.3139 | 26 | 72.86 | 72.22 | 74.29 | 61 |
| 27 | 1990 | 1192.8536 | 27 | 75.71 | 75.00 | 77.14 | 64 |
| 28 | 1989 | 1188.9462 | 28 | 78.57 | 77.78 | 80.00 | 66 |
| 29 | 1988 | 1187.8468 | 29 | 81.43 | 80.56 | 82.86 | 68 |
| 30 | 2017 | 1186.7506 | 30 | 84.29 | 83.33 | 85.71 | 71 |
| 31 | 2011 | 1178.9473 | 31 | 87.14 | 86.11 | 88.57 | 73 |
| 32 | 1986 | 1158.078 | 32 | 90.00 | 88.89 | 91.43 | 76 |
| 33 | 1998 | 1156.1144 | 33 | 92.86 | 91.67 | 94.29 | 78 |
| 34 | 2005 | 1127.0658 | 34 | 95.71 | 94.44 | 97.14 | 80 |
| 35 | 2004 | 1110.6912 | 35 | 98.57 | 97.22 | 100.00 | 83 |
Some given value of Px. The probability of exceedance (Px) is expressed as a fraction (on a scale ranging from zero to one) or as a percentage chance with a scale ranging from 1 to 100 percent. This-show 1996, 1992, 1997, and 1999 as having less than 10% occurrence probability in a particular year. A scattered plot of the three exceedance methods shows a positive correlation of the methods. See Figure 6
Temporal Distribution of Rainfall in the Study Catchment
The temporal distribution of rainfall can be understood as the degree to which rainfall amounts vary over time. The 35-year average rainfall amount is 1256mm, yearly rainfall amounts that exceeded this average were those of 1991, 1992, 1994, 1996, 1997, 1999, 2001, 2002, 2003, 2006, 2011, 2012, 2013, 2014, 2016, and 2018 (see figure 7).
Temporal distribution of rainfall over the 35 years of study according to significant months of rainfall revealed the following: the years 2013 and 2014 had traces of rainfall (1.0mm) in the mount of January while the remaining had zero value in the same amount. The month of February 2015 and 2019 had above (4.0mm). While 1991, 1993, 1996, 2005, 2006, 2011, 2014 and 2014 had below (4.0mm) 1985, 1986, 1988, 1990, 1992, 1994, 1995, 1997, 1998, 2001, 2004, 2008, 2009, 2012, 2016 and 2017 had zero value in the month of February. The month of March 1985 had the highest depth of rainfall (115mm) in the 35year analysis while the lowest rainfall amount in March was in 1994 with (7mm). April 1991 had the highest rainfall amount (158mm) whereas 2015 had a very low amount (17mm), (Figure 8).
Further patterns revealed that May had its highest rainfall in 1990 with (235mm) and it’s lowest in 1987 with (82mm). The temporal distribution of rainfall in June revealed 2013 as with the highest rainfall amounts of (297mm) while for the same month the lowest (146mm) was in 2004. In July 2008 the highest rainfall depth was (367mm) while its lowest value was in 1996. With 191mm, August 2015 had the highest rainfall depth with 368mm, its lowest was in 1988 with 198mm (Figure 9); in the mouth of September 1996 had highest depth of 289mm while its lowest value is 95mm in 1991. October had rainfall amount of 120mm in 2018 while it lowest value of 14mm was in 2007. The month of November had the highest amount of 4.4mm in 1997, and the lowest had 0.1mm in 2016.
Finally, the mouth of December in 2015 and 2019 had rainfall amount of 2.3mm as the highest while it lowest is 0.7mm 1985(Figure 10). Therefore, rainfall generally increases steadily from April to September and then takes a downward trend to October. Among other driver floods, high rainfall amounts and consistent long duration of rains is foremost an inducing causes with implications of these months being possible flood months. Further analysis reveals that the months of July and August had the highest amounts recorded amount of rainfall and frequency frequent rainfall days are evident in then in months of June, July, August, and September, the implications being that antecedent moisture condition of soils in the catchment will be saturated may trigger more surface runoffs which eventually could leads to flooding. Although other human factors may play a part in enhancing flood, the rainfall pattern in the Dilimi River catchment aligns with climatic conditions associated with wet and dry climate characteristics, following the months and seasonality.
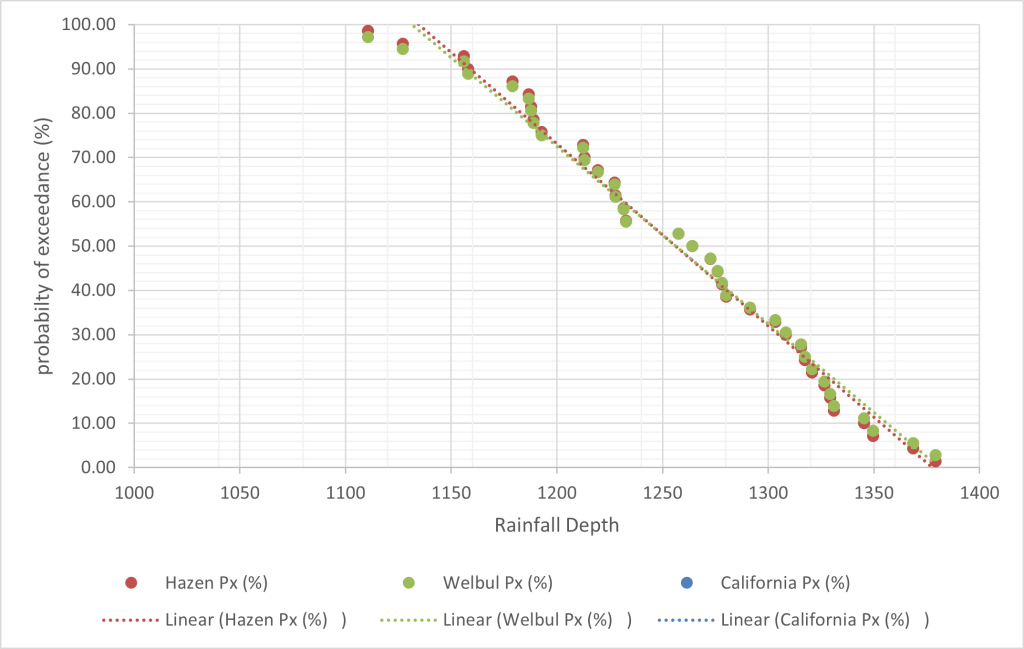
Figure 6: Scatter plot Probabilities of Exceedance
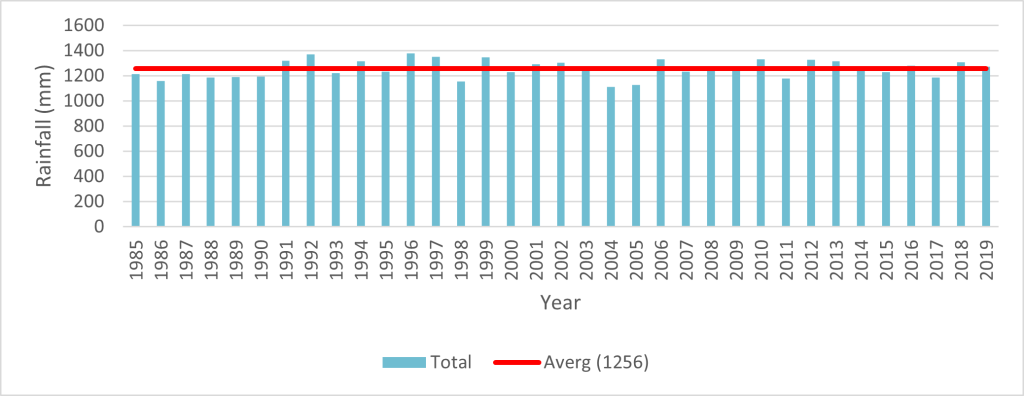
Figure 7: Yearly Rainfall Distribution for the Study Years (1985-2019)
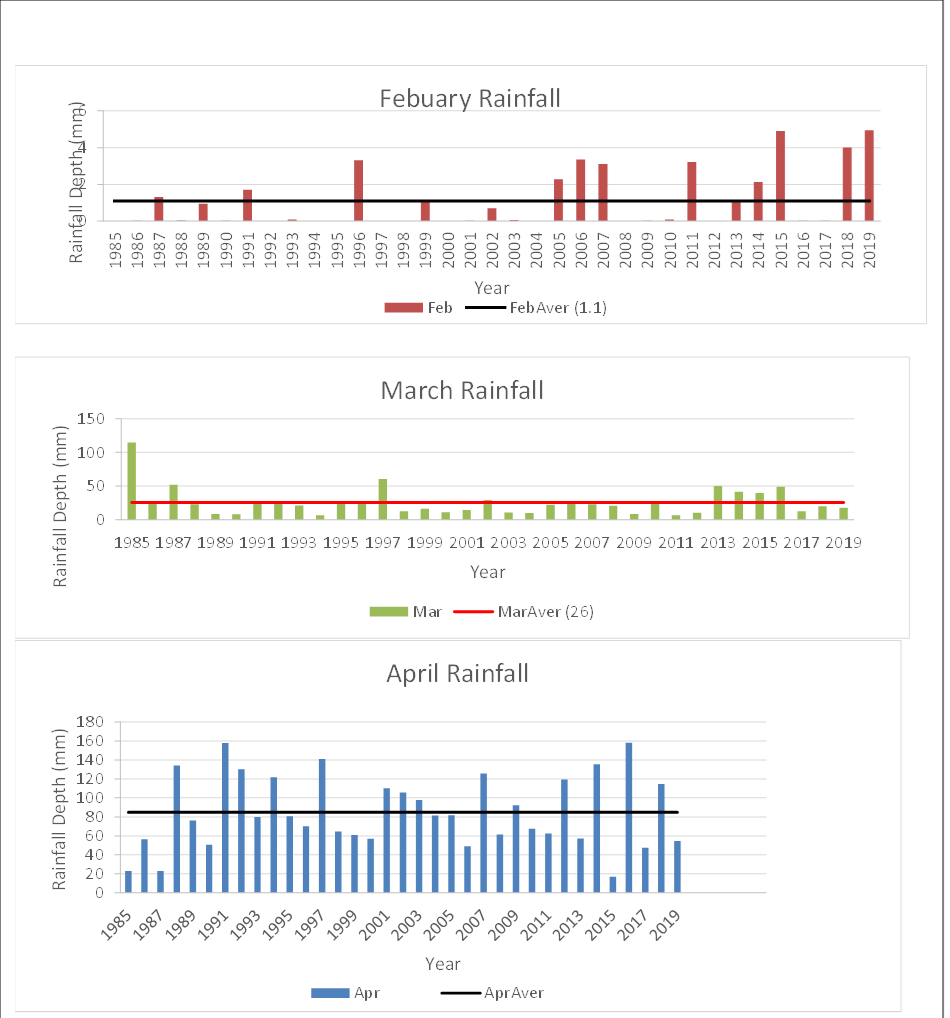
Figure 8: Rainfall Distribution for the Study Month January, February, March and April (1985- 2019).
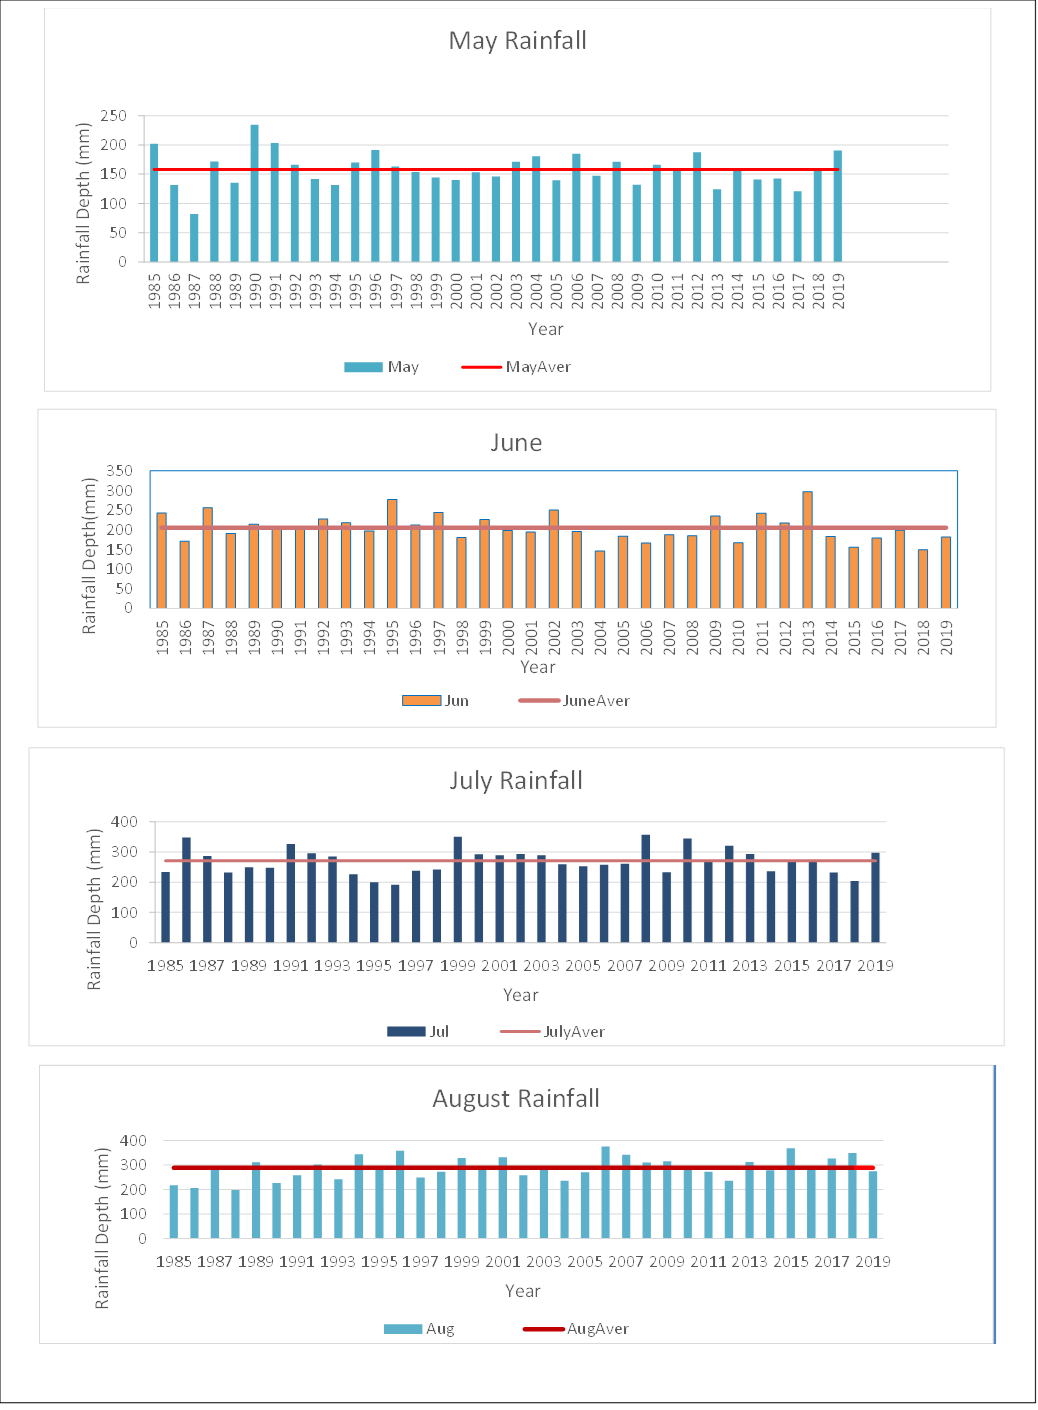
Figure 9: Rainfall Distribution for May, June, July and August (1985-2019).
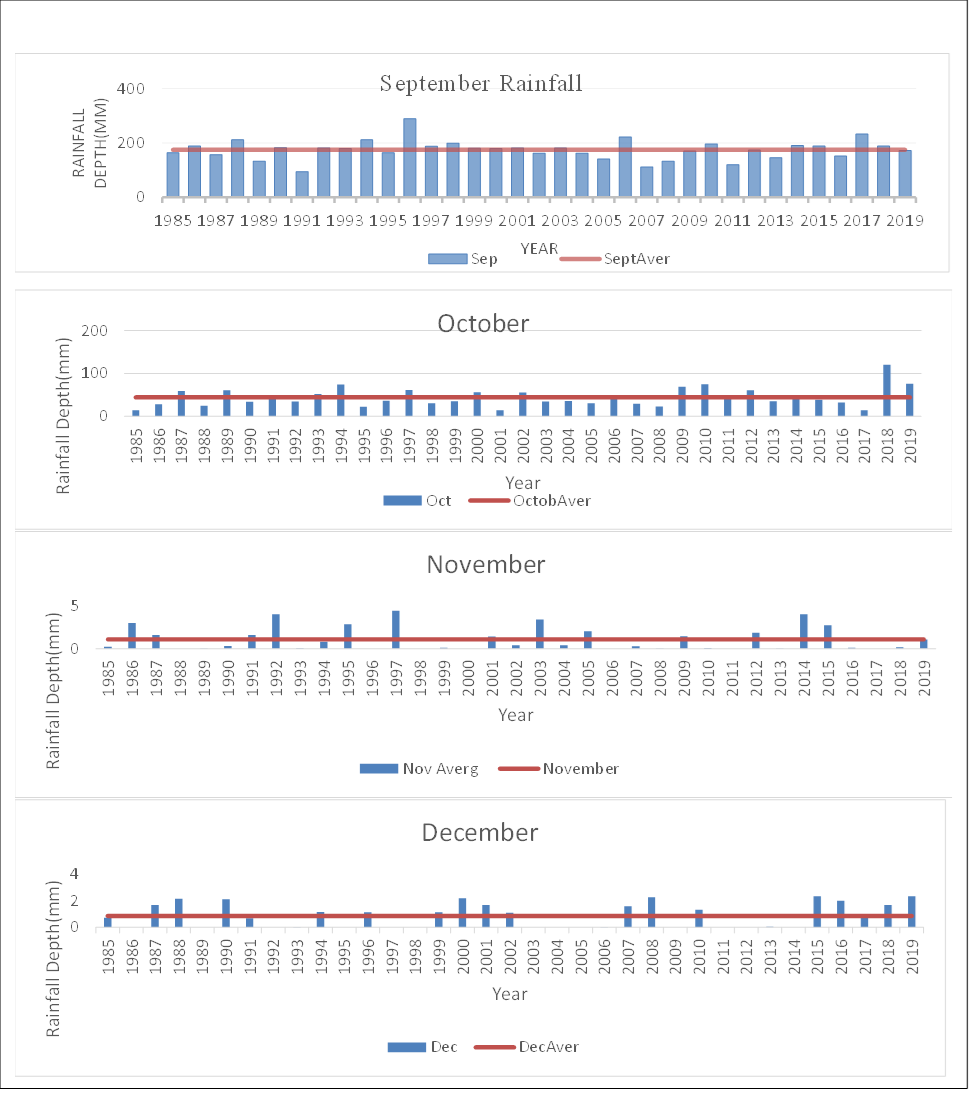
Figure 10: Rainfall Distribution for the Study Month September December (1985-2019).
Catogue of Flood Years in the Dilimi River Catchment
Flood records in the study area as assembled from literature in chapter 2 revealed ten years of flood incidence 1995, 2007, 2011, 2012, 2013, 2014, 2015, 2017, 2018, and 2019 within the 35 years of study. Table 6 presents the flood years, months, dates, and settlements affected by the floods, while Table 7 shows rainfall amounts and calculated average year. From the records,2012 had the highest rainfall amounts of 1326.58mm followed by the year 2013 with 1317.45mm, 2018, 2014, 2019, 2007, 1995, 2015, 2017 and 2011 had amounts of 1308.31mm, 1276.65mm, 1272.60mm, 1232.66mm,1231.52mm, 1227.65mm, 1186.75mm and 1178.94mm respectively.
Table 5: Flood Incidences in Dilimi Catchment Area
| S/N | YEAR | MONTH | DATE OF OCCURRENCE | LOCATION |
| 1 | 1995* | August | 07/08/1995 | AngwanRukuba, Fudawa |
| 2 | 2007*** | August | ||
| 3 | 2011*** | June | 03/07/2011 | |
| 4 | 2012** | August | 22/08/2012 | Rikkos,AngwanRukuba, AngwanRogo, |
| 5 | 2013** | August | 22/08/2013 | Rikkos,AngwanRukuba, AngwanRogo, |
| 6 | 2014** | June | 09/06/2014 | Kabong, Tundun Wada |
| 7 | 2015*** | July | 16/07/2015 | |
| 8 | 2017** | June | 03/07/2017 | AngwanRukuba, Rikkos, |
| 9 | 2018*** | September | 09/09/2018 | Rikkos, Gangare, Tundunoc, Rafan Kara |
| 10 | 2019*** | July | 11/07/2019 | Zinariya |
Source:
* Environmental Impact of Flood in Nigeria (2013).
**Unpublished Report Plateau State Emergency Management Agency Search and Rescue Department (2014).
*** National Emergency Management Agency (2021)
Table 6: Flood Year Exceedance from 1985 to 2019
| S/N. | YEAR | Rainfall Depth | Average Exceedance (%) |
| 1 | 1995 | 1231.5211 | 49 |
| 2 | 2007 | 1232.6649 | 47 |
| 3 | 2011 | 1178.9473 | 73 |
| 4 | 2012 | 1326.5833 | 16 |
| 5 | 2013 | 1317.4506 | 21 |
| 6 | 2014 | 1276.1645 | 38 |
| 7 | 2015 | 1227.6517 | 52 |
| 8 | 2017 | 1186.7506 | 71 |
| 9 | 2018 | 1308.3145 | 26 |
| 10 | 2019 | 1272.6006 | 40 |
Rainfall and Flood Incidence in the Catchment
Based on flood data and rainfall characteristics assembled a pattern of relationship was analysis and results are presented as follows:
1. Flood Months and Years of Floods
Data assembled from the literature review showed 10 years of floods in the catchment, and the months of floods coinciding with each year are presented in (table 8). This revealed that flood was highest in August, followed by June, then July and September in this order.
2. Rainfall Amounts in Flood Years and Month for the catchment.
Rainfall amounts for each flood months and flood years were assembled and presented in table 9. The table showed that four of the ten flood incidence years had the flooding coinciding with the month of highest rainfall amounts. These are 1995, 2014, 2017 and 2019; while other years had high rainfall amounts in the preceding months before flooding. A scatter gram of rainfall amounts for each of the flood years was plotted and it revealed the rainfall depth to be clustered between 1150mm to 1350mm. the trend line generated showed that rainfall amounts for four years (2007, 2011, 2015, and 2016) were below the trend line, while amounts for six years (1995, 2012, 2013, 2014, 2018 and 2019) were above.
Table 7: Flood Months and Years of Floods
| Row Labels | 1995 | 2007 | 2011 | 2012 | 2013 | 2014 | 2015 | 2017 | 2018 | 2019 | Grand Total |
| June | 1 | 1 | 1 | 3 | |||||||
| July | 1 | 1 | 2 | ||||||||
| August | 1 | 1 | 1 | 1 | 4 | ||||||
| September | 1 | 1 |
Table 9: Flood Year, Rainfall Depth and Flood Months for The Catchment
| Years | Jun | Jul | Aug | Sep | Annual Rainfall | Flood Month | |
| 1 | 1995 | 281.2 | 231.3 | 460.1 | 207.8 | 1369.9 | August |
| 2 | 2007 | 251.2 | 230.8 | 246.5 | 133.5 | 974.6 | August |
| 3 | 2011 | 172.2 | 321.7 | 223.8 | 240.6 | 1207.7 | June |
| 4 | 2012 | 238.2 | 677.7 | 215.5 | 214.4 | 1631 | August |
| 5 | 2013 | 124.8 | 179.6 | 244.3 | 338.3 | 1287.5 | August |
| 6 | 2014 | 312.5 | 326.7 | 186.2 | 304.4 | 1695.2 | June |
| 7 | 2015 | 192.9 | 393.6 | 382.5 | 360.6 | 1521.4 | July |
| 8 | 2017 | 339.2 | 381 | 281 | 796 | 2020.4 | June |
| 9 | 2018 | 227 | 157 | 502.2 | 94 | 1367.4 | September |
| 10 | 2019 | 332.2 | 464.9 | 397.3 | 277 | 2052.5 | July |
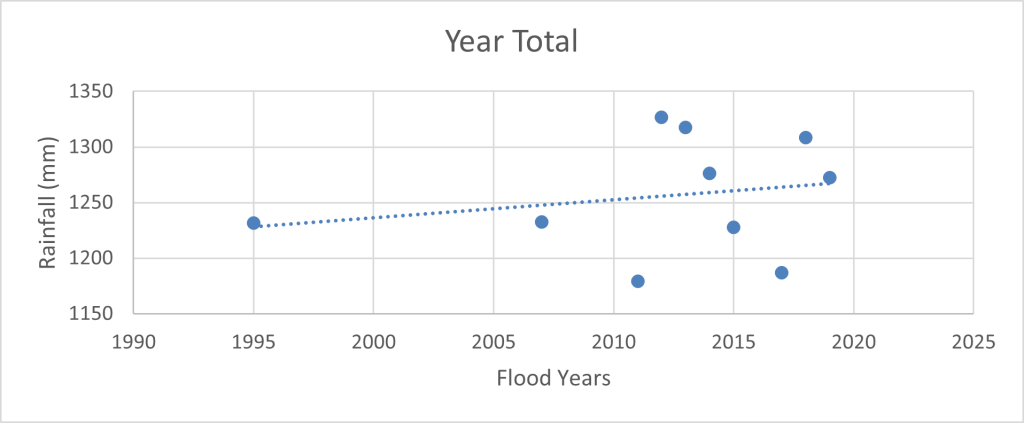
Figure 11: Scatter graph of the ten years of exceedance from 1985 to 2019
3. Rainfall exceedance years and flood years
The rainfall amount for each flood year was considered and the year with the least amount of rainfall had its rainfall amount chosen as the exceedance amount; this was 2011 with a rainfall depth of 1178.95mm. To arrive at the same scale of measurement for both variables – Rainfall and Flood years for the period of research was recoded such that any year with less than the 2011 rainfall amount was considered a non-exceedance year and coded 1, otherwise 2, and considered an exceedance year. Similarly, any year not identified from the literature as a flood year was considered a non-flood year and code 1 otherwise 2 for a flood year as in table 10. The coded exceedance and flood columns were correlated and the result is presented in table 11.
4. Result of correlation between Rainfall exceedance and flood years.
The correlation result presented in table 11, revealed that there is no significant correlation between exceedance years and flooding in the catchment. This goes to prove that rainfall is not the only driver of floods in the catchment.
Correlations coefficient of variation was used to determine the relationship between flood year and anomaly years in rainfall values for the study period; this showed the degree of variability in the monthly and yearly means of rainfall. To calculate rainfall, both yearly and a monthly run of 35 years (table 11) was used. Pearson’s correlation coefficient, p-value for two-tailed test of significance, and the table explained.
Null hypothesis (H0): there is no correlation between flood year and rainfall anomaly years. Alternative hypothesis (H1): there is correlation between flood year and rainfall anomaly years.
Conclusion: alternate hypothesis is accepted as the result shows significant at 0.01 level for a two-tailed test
This shows a positive correlation between flood year and anomaly years but weak. It suggests that rainfall is increasing over time in the study area. Since the increasing trend observed is statistically significant, increase in the future can be categorically predicted or ascertained and the trend can be attributed to a particular causative factor in the study are
Table 10: Coding for correlation between exceedance and flood years
| S/n. | Year | Rainfall depth | Exceedance year | Flood year |
| 1 | 1996 | 1379.1466 | 2 | 1 |
| 2 | 1992 | 1368.5179 | 2 | 1 |
| 3 | 1997 | 1349.5313 | 2 | 1 |
| 4 | 1999 | 1345.33 | 2 | 1 |
| 5 | 2010 | 1331.114 | 2 | 1 |
| 6 | 2006 | 1329.2679 | 2 | 1 |
| 7 | 2012 | 1326.5833 | 2 | 2 |
| 8 | 1991 | 1320.7006 | 2 | 1 |
| 9 | 2013 | 1317.4506 | 2 | 2 |
| 10 | 1994 | 1315.615 | 2 | 1 |
| 11 | 2018 | 1308.3145 | 2 | 2 |
| 12 | 2002 | 1303.3531 | 2 | 1 |
| 13 | 2001 | 1291.3297 | 2 | 1 |
| 14 | 2016 | 1280.1972 | 2 | 1 |
| 15 | 2003 | 1278.1514 | 2 | 1 |
| 16 | 2014 | 1276.1645 | 2 | 2 |
| 17 | 2019 | 1272.6006 | 2 | 2 |
| 18 | 2008 | 1264.0645 | 2 | 1 |
| 19 | 2009 | 1257.4432 | 2 | 1 |
| 20 | 2007 | 1232.6649 | 2 | 2 |
| 21 | 1995 | 1231.5211 | 2 | 2 |
| 22 | 2015 | 1227.6517 | 2 | 2 |
| 23 | 2000 | 1227.351 | 2 | 1 |
| 24 | 1993 | 1219.4896 | 2 | 1 |
| 25 | 1985 | 1213.049 | 2 | 1 |
| 26 | 1987 | 1212.3139 | 2 | 1 |
| 27 | 1990 | 1192.8536 | 2 | 1 |
| 28 | 1989 | 1188.9462 | 2 | 1 |
| 29 | 1988 | 1187.8468 | 2 | 1 |
| 30 | 2017 | 1186.7506 | 2 | 2 |
| 31 | 2011 | 1178.9473 | 2 | 2 |
| 32 | 1986 | 1158.078 | 1 | 1 |
| 33 | 1998 | 1156.1144 | 1 | 1 |
| 34 | 2005 | 1127.0658 | 1 | 1 |
| 35 | 2004 | 1110.6912 | 1 | 1 |
Table 11: Result of Correlation
| Exc | Flood | ||
| VAR00004 | Pearson Correlation | 1 | .227 |
| Sig. (2-tailed) | .189 | ||
| N | 35 | 35 | |
| VAR00005 | Pearson Correlation | .227 | 1 |
| Sig. (2-tailed) | .189 | ||
| N | 35 | 35 | |
5. Result of ANOVA testing on monthly rainfall for flood months
The ANOVA test was run on the rainfall data for each flood month and flood year in table 9. To ascertain if there is any significant difference between the average rainfall in the flood month of June, July, August, and September across the 10 years of floods, the results is shown in Table 12.
The Null hypothesis (H0): there is no significant difference between the average rainfall in the month of June, July, August, and September for the flood years.
Alternative Hypothesis (H1): there is a significant difference between the average rainfall experienced in the mouth of June, July, August, and September.
Conclusion: since F-critical is less than F-calculated or p<0.05, it, therefore, means that there is a statistically significant difference between the average rainfall for the four months of the flood years. And this is why floods occur at different months of the year, with the varying rainfall amounts.
Table 12: Result of ANOVA test
| Groups | Count | Sum | Average | Variance | ||
| JUN | 10 | 2088.5 | 208.85001 | 2437.673843 | ||
| JUL | 10 | 2581.806 | 258.18058 | 1583.659749 | ||
| AUG | 10 | 3049.565 | 304.95649 | 1737.511047 | ||
| SEP | 10 | 1688.129 | 168.81293 | 1275.583408 | ||
|
ANOVA |
||||||
| Source of Variation | SS | Df | MS | F | P-value | F crit |
| Between Groups | 104956.3999 | 3 | 34985.46663 | 19.89385144 | 8.95E-08 | 2.866266 |
| Within Groups | 63309.85242 | 36 | 1758.607012 | |||
| Total | 168266.2523 | 39 | ||||
CONCLUSION
The Dilimi River is one extensive catchment that experiences flood as it traverses within the metropolis of Jos and environs. This study aimed at analyzing flood incidences in the Dilimi River Catchment Area. This was achieved, through an analysis of rainfall characteristics in the catchment, cataloguing of flood incidences, and relating rainfall characteristics and flood incidences in the catchment. Rainfall data was obtained from the Climate Hazards Infrared Precipitation with Stations (CHIRPS) database for a period of 35years. Dates of flood in the catchment were obtained from the National Emergency Management Agency (NEMA) and Plateau State Emergency Management Agency (SEMA) office. These datasets were analyzed and presented using descriptive statistics in form of charts, graphs, percentages; and inferential statistics to establish relationships to include Pearson correlation coefficient and ANOVA.
Rainfall characteristic is highly variable over the study years and across raining months in the catchment. Rainfall amounts rise as high as (374.9mm) in August and as low as (6.7mm) in March within this period of 35years of the study. Rainfall months ranged from March to October while flood months are in June, July, August, and September.
The correlation between flood incident years and rainfall anomaly years revealed a significant correlation coefficient at alpha 0.01 for a two-tailed test. This shows a strong positive correlation between flood year and anomaly years. The ANOVA statistics, on the other hand, revealed a statistically significant difference between the average rainfall amounts for the four flood months (June, July August, and September), meaning that rainfall amounts are not the only determining factor of floods in the study area.
In the face of global climate change coupled with economic inequality and particularly the bad economic indices of in Nigeria, the citizenry of the country and the study area have fallen back to their environment independence of its resources to support their livelihoods in so doing have encroached on vital waterways and arteries which proves deadly with the occurrence of flood. With an established fact of direct relationship between rainfall and flood occurrence people of the flood liable areas of the Dilimi catchment area should ensure their safety by avoiding developments on waterways and arteries, planning authorities should do more to sensitize residents of these areas on the dangers of building on waterways to minimize future flood occurrence.
As the study has shown amounts of rainfall is a major factor to the occurrence of flood, with urbanization exerting high pressure on other land uses with an adverse effect on waterways. The governments, the general public, Weather agencies in the State and country at large should do more in providing relevant data on possible peaking of rainfall within the Dilimi catchment, these agencies and other interest groups should also be in the vanguard to develop models to counter flood incidences through:
- Urban planning and designing of drainage infrastructures by engineers should take into account the increasing nature of rainfall in the area.
- Government should lay emphasis on policies that steer development away from areas that are probe to floods. Meanwhile erring developers should be punished for violating these safety rules designed to protect lives and properties.
- There is need for the people to be enlightened on the environmental causes of floods. This can be done through radio and television programs, issuance of newsletter, booklets, and other avenues in mosques and churches.
- The establishment and improvement of early warning systems by the Nigerian Meteorological Agency to monitor both floods and droughts would help in planning of relief measures that would reduce the loss arising from flooding in the area.
REFERENCES
- Agbonkhese, O., Agbonkhese, E. G., Aka, E. O. Joe-Abaya, J., Ocholi, M., & Adekunle, A. (2014). Flood Menace in Nigeria: impacts, remedial and management strategies. Civil and Environmental Research, 6(4), 32-40.
- Alexander, B.C (2020): Analysis of rainfall trend, fluctuation and pattern over Port Harcourt, Niger Delta coastal environment of Nigeria. Biodiversity International Journal Published
- Adeoye, N. O., Ayanlade, A., and Babatimehin, O. (2009). Climate change and menace of floods in Nigerian cities: Socio-economic implications. Advances in Natural and Applied Sciences, 3(3),369
- Adedeji, O. H., Odufuwa, B. O., and Adebayo, O. H. (2012). Building capabilities for flood disaster and hazard preparedness and risk reduction in Nigeria: need for spatial planning and land management. Journal of Sustainable Development in Africa, 14(1), 45-58.
- Afangideh I., Ekpe A., and Offiong A. (2013): Implications of Changing Rainfall Pattern on Building Loss in Calabar. International Journal of Innovative Environmental Research. 1(2):10-18
- Bashir, O., Oludare, H., Johnson, O., and Aloysius, B. (2012). Floods of fury in Nigerian cities.Journal of Sustainable Development, 5(7), 69-79
- Etuonovbe, A. K. (2011, May 18-22). The devastating effect of flooding in Nigeria. Paper presented at the Bridging the Gap between Cultures, FIG Working week, Morocco, Africa
- Igweze H., Amagohm N., Ashinze N. (2014): Analysis of Rainfall Variations in the Niger Delta of Nigeria. Journal of Environment, Science, Toxicology and Food Technology (IOSRJESTFT) 8(1) Version VI. 25-30. Available online at Iosrsjournals.Org. [Accessed on 15th August, 2016].
- Jimoh, H.I. (1999). Effects of run-off on sediment transportation and deposition in Ilorin City. Nigeria. Centre Point Journal 7. No2. Pp. 97-100
- Living with risk (2002). A Global Review of Disaster Reduction Initiatives, Geneva Switzerland.
- National Emergency Management Agency Report (2021).
- Okorie, F.C. (2010). Great Ogberuru in its Contemporary geography. Owerri: Cape Publishers.
- R, Ekiotuasinghan. B and Akpan G (2017): Analysis of Rainfall Pattern and Flood Incidences in Warri Metropolis, Nigeria. Geography, Environment, Sustainability, Vol.10, No 4, p. 83-97 DOI-10.24057/2071-9388-2017-10-4-83-97.
- R, Ekiotuasinghan. B and Akpan (2017): Analysis of Rainfall Pattern and Flood incidences in Warri Metropolis, Nigeria. Geography, Environment Sustainability, Vol 10, No 4, p- 83-97 Dol -10. 24057/2071-9388-2017-10-4-83-97.
- Ologunorisa E and Tersoo (2006): flood Risk Assessment and Management in Nigeria Perspective from the Niger Delta Markudi: Selfers Educational Books.
- Pennel-Rowell et al., (2005). The Benefits of Flood and Coastal Risk Management; A Manual of Assessment Techniques. London; Middlesex University Press.
- Sada, P., and Odemerho, F. (1988). Environmental Issues and Management in Nigeria Development. Evans, Ibadan.
- Smith, K. and Ward, R. (1998). Floods: Physical processes and Human Impacts. John Wiley and Son. England
- Zbigniew W. Kundzewice S.K., Sonia I.S., John H., Newille N., Pascal P. (2013). Flood Risk and Climate Change: Global and Regional Perspective. Hydrological Science Journal 59 (1) 1 -28