
Analysis of Spatial Distribution of Air Pollution Level in Enugu Urban, Enugu State, Nigeria.
- Odoh C. C
- Ezeobi J. U.
- David D.
- Onyeizugbe U. R.
- 76-82
- Apr 29, 2024
- Environmental Impact
Analysis of Spatial Distribution of Air Pollution Level in Enugu Urban, Enugu State, Nigeria.
Odoh C. C.1*, Ezeobi J. U.2, David D.1 & Onyeizugbe U. R. 1
1Department of Environmental Management, Nnamdi Azikiwe University, Awka, Anambra State
2Department of Geography, Bayero University, Kano, Kano State
*Corresponding Author
DOI: https://doi.org/10.51584/IJRIAS.2024.90406
Received: 08 March 2024; Accepted: 23 March 2024; Published: 29 April 2024
ABSTRACT
Air pollution is generally defined as the presence in the outdoor atmosphere of one or more contaminants such as fumes, dust, gases, mist, odour, smoke, smog, or vapors in considerable quantities and duration of which is injurious to human, animal and plant life. There has been increasing negative consequences of air pollution on public health, biotic and abiotic components of the environment. The study analyzed the spatial distribution of air pollution level in Enugu State, Nigeria using pollution data obtained from field work through the use of a gas analyzer. The student’s t-test was the statistical tool employed for the study while remote sensing and Geographic information system (GIS) were further used. It was observed that Trans-Ekulu, Abakpa and Emene are the most polluted areas in Enugu while Asata, Coal Camp and Independence layout are the best least polluted areas. CO is the major pollutant in the area whereas pollution was found to be more severe in the evening than morning period in the area. It was concluded that although pollution increased generally as the evening period approaches, the concentration of pollutants appears to decrease more significantly as progression is made towards the southern part of Enugu urban.
Keywords: Air pollution, Pollutants, Diurnal and Nocturnal pollution levels.
INTRODUCTION
Until 1980, most air pollution problems were perceived as local problems before more problems emerged involving longer-lived pollutants and pollutants that are transported a long way before they do their damage: acid rain, destruction of the ozone layer by chlorofluorocarbons, and the buildup of carbon dioxide in the atmosphere (De Nevers, 2000). In other words, air pollution is when foreign substances are introduced into the atmosphere at a rate higher than what the atmosphere can process through its self-modifying process that dilutes naturally. Major pollutants that contribute to poor urban air quality includes: Carbon monoxide (CO), nitrogen oxides (NO), Sulphur oxides (SO), particulate matter (PM), Lead (Pb), photo chemical oxidants such as Ozone (O3), Ozone precursors like hydrocarbons and volatile organic compounds (Costa, 2001). The six in the foregoing had been listed as the six “classic” air pollutants (World Health Organization, 1999).
Air pollution affects the air quality of the global environment since there is no border in the atmosphere and predominates in towns and cities as against rural areas due to the agglomeration of activities (Ugboma and Nwobi, 2017). The awareness that the atmosphere is not limitless and that pollutants are a threat to human health, and also reduce the quality of an environment, have been responsible for recent vigorous efforts made towards controlling air pollution. Pollutant dispersion is also being affected by variability in wind direction. Wind is the best diluter of urban contaminants and tends to disperse pollution in several ways. large urban centers like Enugu represent a multitude of individual points and mobile sources, and the waste products from these sources collectively forms an urban plume whose depression by wind represents one of the most critical air quality problems facing modern societies. Enugu urban has experienced a rapid growth over time and subsequently a resultant growth in the establishment of industries and vehicle activities, which release tons upon tons of hazardous pollutants on a daily basis.
Air pollution is one of the major problems that result to the daily deterioration of urban environmental quality in the developing world. (Nath and Murthy, 2010) It has become a matter of grave concern, particularly in mega-cities like Enugu Urban. Urban pollution remains a threat to human health, and this is expected to increase reasonably as industries and vehicle ownership increase in Enugu Urban (Enete, Chukwudeluzu and Okolie, 2013). In the last few years, traffic population and industrial activities have grown at a geometric proportion with the attendant consequences of increased air pollution in Enugu Urban (Enete and Ogbonna, 2012). Most vehicles have been regarded as the primary cause of air pollution in the urban areas and account for 60 to 70% of the pollution found in the urban environment (Kishore and Deswal, 2017). Kampa and Castanas (2008) opined that air pollution has both acute and chronic effects on human health, affecting a number of different systems and organs. It ranges from minor upper respiratory irritation to chronic respiratory and heart disease, lung cancer, acute respiratory infections in children and chronic bronchitis in adults, aggravating pre-existing heart and lung disease, or asthmatic attacks. In addition, long-term exposures have also been linked with premature mortality and reduced life expectancy.
This research is aimed at analyzing the spatial distribution of air pollution level in Enugu urban, Enugu state, Nigeria.
To achieve this aim, the following objectives were pursued:
- To identify the areas seriously affected by pollutants in Enugu urban.
- To examine the pollutants associated with the different parts in the study area.
- To determine the diurnal and nocturnal changes in the air pollution level of the different areas.
Ho: There is no significant difference in air pollution levels between the day and night periods.
LITERATURE REVIEW
Okeke, Ezeh and Ikusika (2020) carried out a study on the outdoor air pollution levels in vehicular traffic junctions in the major cities of Nsukka, Enugu and semi-urban area of Awgu all in Enugu State, Nigeria using standard analytical procedures. PM2.5 was collected using Envirotech air sampler, APM 550 and analyzed gravimetrically. Kumar and Foster (2009) examined the spatial distribution of air pollution in response to recent air quality regulations in Delhi and its surroundings using Cartesian proximity (distance) analysis, Kriging method and regression models (Ordinary Least Square [OLS] regression model and Spatial Auto Regressive Models [SAM]). From the analysis three important findings emerged: air pollution levels in Delhi and its surroundings were significantly higher than that recommended by the World Health Organization (WHO), air quality regulations in the city adversely affected the air quality of the areas surrounding Delhi, and industries and trucks were identified as the major contributors of both fine and coarse particles. Ngele, Elom, Nwofe, Ogah, Agbo and Ehiri (2015) carried out a study on Diurnal Variation of ambient Air Pollutants Concentration in two Motor Parks in Ebonyi State, Nigeria. The study monitored ambient air day-time concentration of particulate matter less than ten micrometer (PM10) in size, CO and NO2 daily for twenty-eight days in the dry season in two motor parks in Ebonyi State. The results showed that during the study period, PM10, CO and NO2 had a range and mean values of 32-58 and 46.429± 6.161 µgm-3 , 0.1-0.4 and 0.162±0.079 ppm and 0.01-0.04 and 0.013±0.006 ppm respectively in site1. The corresponding values in site2 were 45-69 and 55.845±5.416 µgm-3 ,0.1-0.6 and 0.225±0.120 ppm,0.01-0.02 and 0.013±0.004 ppm respectively. The diurnal variation as depicted by the morning, afternoon and evening mean concentrations showed that for PM10 in both sites, afternoon mean concentration ˃ evening mean ˃ morning mean; for CO morning mean concentration > evening mean > afternoon mean while NO2 had afternoon mean concentration ˃ evening mean ˃ morning mean. Comparatively site 2 had higher concentrations of the pollutants monitored relative to site1.However, analysis of variance (ANOVA) of difference in mean of pollutants in the two sites in the different periods of the day showed that except for CO mean in the morning period, other monitored pollutants were not statistically significant (p<0.05).There research findings concludes that the mean concentrations of pollutants in this study were within the guide line limit of Nigerian National Environmental Standard Regulation and Enforcement Agency (NESREA) and United State Environmental Protection Agency (USEPA) for air quality. Singh, Biswal, Kesarkar, Mor and Khaiwal (2020) carried out a study on Diurnal and temporal changes in air pollution during COVID-19 strict lock down over different regions of India using the observations from 134 real-time monitoring sites of Central Pollution Control Board (CPCB). Significant reduction in PM2.5, PM10, NO2, and CO has been found in all the regions during the lockdown. SO2 showed mixed behavior, with a slight increase at some sites but a comparatively significant decrease at other locations. O3 also showed a mixed variation with a mild increase in IGP and a decrease in the South. The absolute decrease in PM2.5, PM10, and NO2 was observed during peak morning traffic hours (08-10 Hrs) and late evening (20-24 Hrs), but the percentage reduction is almost constant throughout the day. A significant decrease in daytime O3 has been found over Indo Gangetic plain (IGP) and central India, whereas night-time O3 has increased over IGP due to less O3 loss. The most significant reduction (~40-60%) was found in PM2.5 and PM10. The highest decrease in PM was found for the north-west and IGP followed by South and central regions.
MATERIALS AND METHODS
Study Area
The study area is Enugu urban, which is the capital of Enugu state in southeastern Nigeria (Fig. 1). This area was once the capital of the former southern provinces, eastern provinces, eastern region, east-central states and old Anambra state. It is composed of Enugu East, Enugu North and Enugu South local government areas (LGAs), and is bounded by various LGAs in the following directions: in the north by Igbo-Etiti and Isi-Uzo, south by Nkanu West, east by Nkanu East, and west by Udi. It lies approximately within Latitudes 6°21’N and 6°29’N of the equator and Longitudes 7°26’E and 7°35’E of the Greenwich meridian.
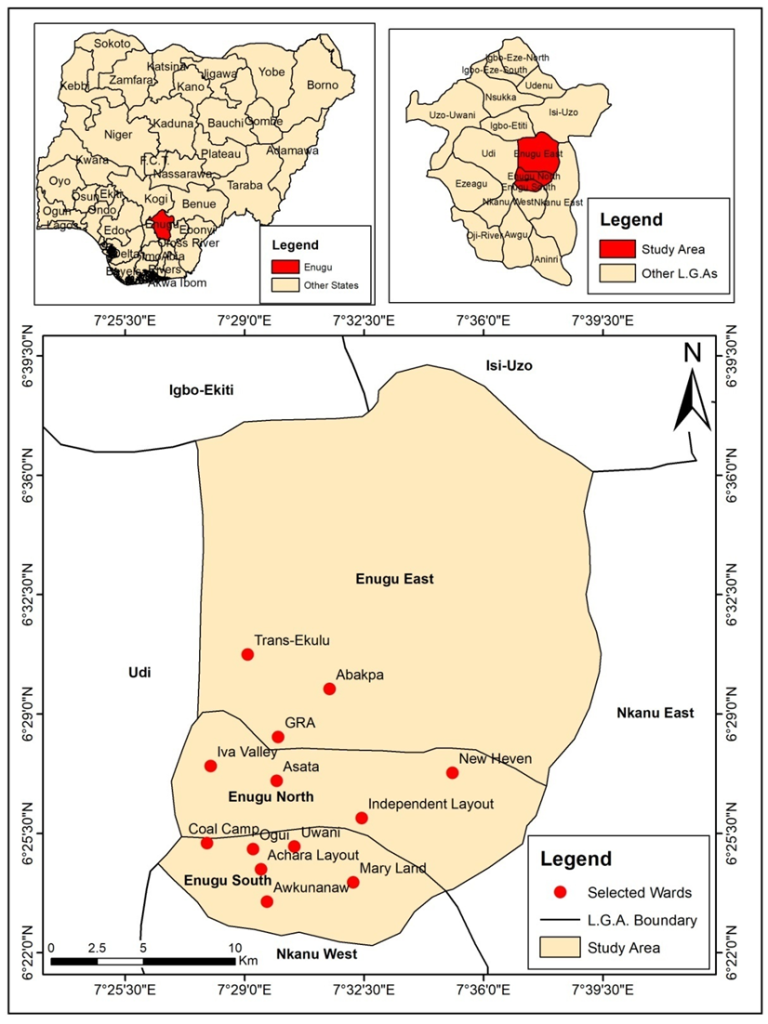
Figure 1: Study area map
Research Design and Data Acquisition
The experimental design was used. As a consequence, pollution data of Enugu urban sourced by sampling via fieldwork were employed. Data used for this study were Carbon monoxide (CO), methane (CH4), hydrogen sulfide (H2S) and photochemical oxidants such as Ozone (O3) for some selected wards in Enugu urban. The pollution data used for this study were obtained from fieldwork through the use of a gas analyzer. The study employed the use of Remote Sensing and Geographic Information System (GIS) to map out areas that are seriously affected by air pollution as well as statistical techniques in the analysis of data to achieve the various objectives. Statistics used involved measures of central tendencies and dispersion such as median, mean, and its deviation, and standard deviations while student’s statistics was used to test the research hypothesis.
RESULTS AND DISCUSSION
The spatial distributions of pollutants are shown in Table 1 and Table 2, and confirms Trans-Ekulu, Abakpa and Emene as the most polluted areas in Enugu urban while Asata, Coal Camp and Independence Layout are among the least polluted. Although pollution increased generally as the evening period approaches, the concentration of pollutants in the aforementioned areas persists relative to other area.
Table 1: Spatial Distribution of Air Pollutants (Morning)
| S/N | LGA | NEW LOCATION | NEW TOWN | LATITUDE | LONGITUDE | CO LEVEL (ppm) | OXYGEN LEVEL (%) |
| 1 | Enugu East | Naowas junction | Trans- Ekulu | 6.461667 | 7.491778 | 60 | 20.8 |
| 2 | Enugu East | All saints Junction | GRA | 6.455667 | 7.488556 | 54 | 20.8 |
| 3 | Enugu East | Eke Emene | Emene | 6.456722 | 7.486333 | 72 | 20.8 |
| 4 | Enugu East | Liberty Area | Abakpa | 6.456722 | 7.491806 | 82 | 20.8 |
| 5 | Enugu North | New Haven Primary School Junction | New Haven | 6.438528 | 7.487389 | 65 | 20.8 |
| 6 | Enugu North | T- Junction | Independence Layout | 6.442028 | 7.487194 | 40 | 20.8 |
| 7 | Enugu North | Asata Junction | Asata | 6.429639 | 7.480722 | 35 | 20.8 |
| 8 | Enugu South | Ogui Junction | Ogui New Layout | 6.429639 | 7.479583 | 22 | 20.8 |
| 9 | Enugu South | Total Filling Station Area | Coal Camp | 6.42675 | 7.494497 | 25 | 20.8 |
| 10 | Enugu South | Police College junction | Uwani | 6.422472 | 7.486278 | 43 | 20.8 |
| 11 | Enugu South | Garriki Market Junction | Garriki | 6.38975 | 7.494083 | 40 | 20.8 |
| 12 | Enugu South | Awkunanaw Girls | Awkunanaw | 6.391 | 7.494333 | 33 | 20.8 |
| 13 | Enugu South | Maryland junction | Maryland | 6.457 | 7.495 | 68 | 20.8 |
| 14 | Enugu South | Zik Avenue Bus Stop | Achara Layout | 6.387 | 7.4789 | 73 | 20.8 |
Table 1 shows the morning spatial distribution of air pollution in some selected areas of Enugu urban. Nowas junction, All Saints junction, Eke Emene, Liberty area, New Heaven Primary school junction, T-junction, Asata junction, Ogui junction, Total filling station area, Police college junction, Garriki market junction, Awkunanaw Girls junction, Maryland junction and Zik Avenue Junction Carbon monoxide level are 60,54,72,82,65,40,35,22,25,43,40,33,68 and 73 respectively, and Oxygen level of 20.8.
Table 2: Spatial Distribution of Air Pollutants (Evening)
| SN | LGA | NEW LOCATION | NEW TOWN | LATITUDE | LONGITUDE | CO LEVEL (ppm) | OXYGEN LEVEL (%) |
| 1 | Enugu East | Naowas junction | Trans- Ekulu | 6.461667 | 7.491778 | 52 | 20.8 |
| 2 | Enugu East | All saints Junction | GRA | 6.455667 | 7.488556 | 70 | 20.8 |
| 3 | Enugu East | Eke Emene | Emene | 6.456722 | 7.486333 | 77 | 20.8 |
| 4 | Enugu East | Liberty Area | Abakpa | 6.456722 | 7.491806 | 63 | 20.8 |
| 5 | Enugu North | New Haven Primary School Junction | New Haven | 6.438528 | 7.487389 | 52 | 20.8 |
| 6 | Enugu North | T- Junction | Independence Layout | 6.442028 | 7.487194 | 35 | 20.8 |
| 7 | Enugu North | Asata Junction | Asata | 6.429639 | 7.480722 | 42 | 20.8 |
| 8 | Enugu South | Ogui Junction | Ogui New Layout | 6.429639 | 7.479583 | 32 | 20.8 |
| 9 | Enugu South | Total Filling Station Area | Coal Camp | 6.42675 | 7.494497 | 35 | 20.8 |
| 10 | Enugu South | Police College junction | Uwani | 6.422472 | 7.486278 | 52 | 20.8 |
| 11 | Enugu South | Garriki Market Junction | Garriki | 6.38975 | 7.494083 | 50 | 20.8 |
| 12 | Enugu South | Awkunanaw Girls | Awkunanaw | 6.391 | 7.494333 | 65 | 20.8 |
| 13 | Enugu South | Maryland junction | Maryland | 6.457 | 7.495 | 49 | 20.8 |
| 14 | Enugu South | Zik Avenue Bus Stop | Achara Layout | 6.387 | 7.4789 | 56 | 20.8 |
Table 2 shows the evening spatial distribution of air pollution in some selected areas of Enugu urban. Nowas junction, All Saints junction, Eke Emene, Liberty area, New Heaven Primary school junction, T-junction, Asata junction, Ogui junction, Total filling station area, Police college junction, Garriki market junction, Awkunanaw Girls junction, Maryland junction and Zik Avenue Junction Carbon monoxide level are 52,70,77,63,52,35,42,32,35,52,50,65,49 and 56 respectively, and Oxygen level of 20.8
Pollutants Associated with Different Areas in the Study Area
The spatial distribution of air pollution level is presented in Table 1 and Table 2 for morning and evening periods respectively. These readings were obtained with the aid of a gas analyzer and indicated CO and O2 as the major pollutants in the area.
Diurnal and Nocturnal Changes in Air Pollution
At 95% confidence interval, the student’s t statistic was used to test the hypothesis which states that there is no significant difference in air pollution levels between the day and night periods. Since the calculated ‘t’ of 3.18 is greater than the critical ‘t’ of 1.76, the Ho was rejected. So the alternative hypothesis (H1) which states that there is a significant difference in air pollution levels between the day and night periods were consequently accepted. The implication therefore is that since evening readings have the higher mean, it would appear that pollution is more severe in the evening than in the morning.
Trans-Ekulu, Abakpa and Emene as areas of high pollution concentration with values between 63.99 to 79.99 ppm for CO, for example. On the other hand, Asata, Coal Camp and Independence Layout are some of the lowly concentrated areas of pollutants with a value in the range of 42.76-32.01 ppm for the same pollutant. The concentration of industrials in Emene obviously had contributed immensely, and the fact that CO is the most common pollutant further confirms this assertion. This finding is in agreement with Orlova, Pietkova and Borovikov (2015) that earlier asserted that the largest area of air pollution linked to the activities of industrial plants. The difference in the concentration of pollutants across the wards agrees with the findings of Costabile et al. (2010) which noted that air pollution varies significantly with space, time and proximity to relevant point emission sources. It was shown from the analysis that pollution is more severe in the evening than in the morning, having rejected the null hypothesis. A major factor to this is the increase in commercial as well as economic activities in the quest to obtain greener pastures as each day grows older, as these activities are more pronounced during the afternoon to evening periods. Wang and Tian (2018) recently reported that human activities in addition to natural factors influence the spatial and temporal variation characteristics of air quality.
CONCLUSION AND RECOMMENDATIONS
Although pollution increased generally as the evening period approaches, the concentration of pollutants appears to decrease more significantly as progression is made towards the southern part of Enugu Urban. This study therefore encourages strategic planning since it serves as a base to understand the patterns and possible causes of air pollution distribution level in the area.
REFERENCES
- Costa, D. L. (2001). Air pollution. In C. D. Klaassen (Ed.), Casarett and Doull’s toxicology: The basic science of poisons (6th edition), 979-1012. New York: McGraw-Hill Education.
- De Nevers, N. (2000). Air pollution control engineering (2nd). New York: McGraw-Hill Education
- Enete, I. C, and Ogbonna, C. E. (2012). Evaluation of Air Pollution Tolerance Index (APTI) of some selected ornamental shrubs in Enugu city, Nigeria. JESTFT, 1(2), 22-25.
- Enete, I. C., Chukwudeluzu, V. U., and Okolie, A. O. (2013). Evaluation of Air Pollution Tolerance Index of plants and ornamental shrubs in Enugu city: Implications for Urban heat island effect. World Environment, 3(3), 108-115.
- Nath, S.H.,and Murthy, U. N. (2010). Spatial distribution mapping for air pollution in industrial areas – A case study. Journal of Industrial Pollution Control, 26(2),217-220.
- Singh, V., Singh, S., Biswal, A., Kesarkar, A.P., Mor, S and Ravindra, K (2020). Diurnal and temporal changes in air pollution during COVID-19 strict lockdown over different regions of India. Environmental Pollution 266 (2020) 115368
- Wang, Z., and Tina, Z. (2018). Temporal and Spatial distribution characteristics and influencing factors of air quality index in Xuchang. IOP Conf. Series: Earth and Environmental Science, 108.
- World Health Organization, WHO. (1999). Guildlines for air quality. Geneva: Author