
Artificial Neural Network Applications in Transmission Line Fault Diagnosis
- Obinna Kingsley Obi.
- Chinedu Chigozie Nwobu.
- Abigail Chidimma Odigbo.
- Dennis Chukwuemeka Oyiogu
- 48-62
- Aug 27, 2024
- Electronics & Communication
Artificial Neural Network Applications in Transmission Line Fault Diagnosis
Obinna Kingsley Obi., Chinedu Chigozie Nwobu., Abigail Chidimma Odigbo., Dennis Chukwuemeka Oyiogu
Department of Electrical Engineering, Nnamdi Azikiwe University Awka, Nigeria
DOI: https://doi.org/10.51584/IJRIAS.2024.908006
Received: 08 July 2024; Accepted: 20 July 2024; Published: 27 August 2024
ABSTRACT
This study proposes an intelligent fault detection mechanism using artificial neural networks (ANNs) to detect faults on power system transmission lines. A prototype of Kaduna-to-Kano transmission line network was modeled in Simulink, and voltage and current data were extracted and trained using the Levenberg-Marquardt backpropagation algorithm. The results show that the ANN can detect both symmetrical and non-symmetrical faults, with validation plots and regression plots demonstrating its effectiveness. This technique is highly recommended for power system transmission line networks and can be extended to distribution networks.
Keyword: Artificial neural network, fault detection, power system, fault.
INTRODUCTION
Power systems, which provide power for residential, commercial, and industrial requirements, are the foundation of contemporary civilization. Transmission lines, which are in charge of sending electrical energy across long distances to end users, they are essential parts of power networks. These complex networks may, however, experience a variety of faults that might prevent them from functioning normally. System reliability, safety, and stability depend on comprehending these faults and putting in place efficient fault detection techniques [1]. abnormal connections or abnormal flow of current between two separate wires are known as faults. Faults may have a variety of sources, including inclement weather, human mistake, and malfunctioning equipment. Sometimes serious power system faults may harm individual pieces of equipment or the whole system. In addition, it affects the operational staff, starts fires, and may even be fatal [2].
Power systems are susceptible to a variety of faults. One of these factors is insulation failure, which may be brought on by mechanical force, pollution, or ageing. Short circuits or ground faults may result from faulty insulation, which permits current to flow in unwanted directions [3, 4]. When too much current flows through a low-resistance route, a short circuit may result. This might happen between two stages, three phases, or even between one phase and the ground. Such occurrences may endanger people as well as harm machinery and electricity cables. Electrical fires and overheating [5, 6]. Faults may also result from overvoltage circumstances such voltage surges, lightning strikes, or switching events. Elevated voltages strain apparatus and may cause insulation to fail [7, 8]. The efficiency of insulators might be decreased by dust accumulation. Dust accumulation increases the conductivity of insulators, which raises the possibility of failures [9, 10]. Line faults may be caused by broken conductors, such as falling power lines [11, 12]. These faults endanger safety and interfere with the power supply. Therefore, in order to avoid these faults and guarantee the grid’s safe and effective functioning, it is essential that electricity systems be regularly maintained and monitored. Finding anomalous circumstances, or faults, in the power network is the main goal.
Transmission lines, transformers, generators, and other parts may all have faults. Reduced downtime and cascaded failures are avoided with early identification of faults [13, 14]. For the last several decades, fault diagnosis and detection have been a busy study topic. Modern companies depend on fault identification and diagnosis to guarantee product quality and safety [14]. There are three types of fault diagnostic approaches that have been proposed: data-driven methods, qualitative model-based methods, and quantitative model-based methods [15, 14]. It becomes harder to create a mathematical model that accurately depicts the dynamic behaviour of a system as current processes get more complicated. Consequently, there is a growing interest in data-driven approaches, which only use process-derived data [15].
Reliability, security, and efficiency are ensured by quickly identifying and categorizing faults in power systems. Protecting the transmission line network is essential. Therefore, in order to provide the best protection and prevent system failure, appropriate steps must be implemented. To stop the transmission line from being damaged, the fault must be located precisely to allow for quick line isolation. On the other hand, feedback from fault detection may greatly facilitate fault identification, leading to quicker fault clearance and power restoration [13]. Scholars have investigated many techniques for identifying and categorising faults in transmission lines [16]. Using artificial neural networks (ANNs) is one efficient method [17, 18]. ANNs are effective instruments for classifying faults and recognising patterns. A strong fault detection system makes relaying operations efficient, reducing downtime and averting disruptions. Thus, the artificial neural network approach is used in this study to diagnose transmission line faults.
LITERATURE REVIEW
A power system is a complex network of interconnected electrical elements designed to generate, transmit, and distribute electric energy. A large-scale power system that supplies electricity to a significant area, including residential and industrial consumers, is referred to as a power grid or electrical grid. The power grid is a hierarchical structure comprising three primary components: generation, transmission, and distribution systems, which work in tandem to ensure reliable and efficient electricity supply [30]. Faults in a power system refer to unintended electrical connections between conductors, which can have devastating consequences. Various factors contribute to fault occurrences, including adverse weather conditions, human mistakes, and equipment malfunctions. These faults can significantly impact the power system, resulting in equipment damage, system-wide disruptions, and even fires, posing a significant risk to operating personnel and potentially leading to fatalities [31] Power systems often encounter dynamic changes in their operation, commonly exhibited as transmission line fault[20]. Fault usually occurs in a power system due to insulation failure, flashover, physical damage such as wire blowing together in the wind, an animal coming in contact with the wire. In power systems, faults are broadly classified into two categories: short circuit faults, also known as shunt faults, and open circuit faults, referred to as series faults. Short circuit faults are further subdivided into symmetrical and unsymmetrical faults. Symmetrical faults, although rare (approximately 5% of all faults), are the most severe, affecting all three phases equally. Unsymmetrical faults, on the other hand, are unbalanced and involve a short circuit with ground, manifesting as line to ground, line to line, and double line to ground faults. Line to ground faults are the most prevalent (70% of all faults), often caused by lightning strikes or conductors coming into contact with grounded structures. The effects of faults can be far-reaching, leading to damaging electrical equipment, causing fires or explosions, compromising system stability, and potentially resulting in complete shutdowns and significant financial losses. Furthermore, faults can lead to significant voltage and frequency reductions, causing loads like motors to feed power to the fault location, exacerbating the situation. The severity of these faults underscores the importance of swift fault detection and clearance to prevent prolonged interruptions in power supply. [21]. Remarkably, transmission line faults account for about 85% of these contingencies [24]. Transmission lines are a crucial component of power infrastructure, spanning vast distances to transmit bulk power across various terrains and geographic locations. However, this widespread expansion exposes them to diverse atmospheric disturbances, which can lead to faults and disrupt the reliable transmission of power. To prevent excessive power losses through the faulted section and ensure a swift return to stable operation, it is essential to identify and isolate the faulty line promptly, thereby enabling the restoration of normal power flow and maintaining the reliability of the overall power system [22]. In power systems, transmission line faults come in two main types: open circuit (series) faults and short circuit (shunt) faults. Short circuit faults can be identified by unusual current values, while open circuit faults show up as unusual voltage values. Short circuit faults can be further divided into two categories: symmetrical (affecting all three phases equally) and asymmetrical (affecting one or two phases). Symmetrical faults include triple line and triple line to ground faults, while asymmetrical faults include line to ground, line to line, and double line to ground faults. Understanding these fault types is crucial for reliable power system operation and maintenance [23].
The timely detection of faults is crucial from both economic and operational perspectives, as it enables proactive measures to mitigate potential disruptions to the power supply. Real-time fault detection is ideal, allowing for swift remedial action to be taken before minor issues escalate into major outages, thereby ensuring the reliability and efficiency of the power system [32]. Over the past decade, various techniques of fault diagnosis have been developed to ensure reliable and stable operation of power systems [20]. This research focuses primarily on the development of techniques specifically tailored to detect transmission line faults, while acknowledging the existence of other fault types that can affect overall power quality. By concentrating on transmission line fault detection, this study aims to enhance the reliability and efficiency of power transmission systems. There are two main types of fault diagnostic methods: methods based on processes and methods based on models. While process and traditional based approaches depend on empirical measurements to map inputs to desired outputs without previous mathematical estimate, model-based strategies use quantitative or qualitative models to characterise the system. Model-based techniques are less frequent in the setting of power systems because of their high computational burden and sensitivity to changes in parameters, which may result in a diagnosis that is inconsistent and takes a long time [25].
Process history-based models for pattern identification have become more and more popular. While these models are useful for identifying system faults, they may not fully represent the dynamic complexity of power systems. An important part of extracting meaningful information from empirical data is feature extraction. Direct measurement and transformation methods are the result of developments in power systems understanding and signal processing. Notably, wavelet and Fourier transforms are often used for feature extraction, successfully and precisely separating fault features.
Techniques using artificial intelligence (AI) improve the accuracy of fault categorization. AI accurately characterises the properties of power systems since it is adaptable. Some of these artificial intelligence techniques includes: Wavelet Transformed based Technique of fault detection and diagnosis of overhead transmission lines by implementing Discrete Wavelet Transform (DWT). Faults in transmission line of various categories have been created using MATLAB/Simulink. The current signals of each phase are obtained from sending end, and then decompose using DWT to obtain the details coefficients up to five levels. Furthermore, normalized values are calculated from the norm of detail coefficients. In order to detect and diagnose the faults on transmission lines normalized values of each phase are compared with threshold values of the system [36]. Fuzzy state-feedback control of uncertain nonlinear MIMO systems is also used to for unknown nonlinear multivariable systems for which the input-gains matrix is not necessarily symmetric and is characterized by non-zero leading principle minors. A linearly parameterized fuzzy system is used to appropriately model the uncertainties [37]. An Adaptive Neural Control for Unknown Nonlinear Time-Delay Fractional-Order Systems with Input Saturation which focuses on the adaptive neural control of a class of uncertain multi-input multi-output (MIMO) nonlinear time-delay non-integer order systems with unmeasured states, unknown control direction, and unknown asymmetric saturation actuator. The design of the controller follows a number of steps. Firstly, based on the semi-group property of fractional order derivative, the system is transformed into a normalized fractional order system by means of a state transformation in order to facilitate the control design. Then, a simple linear state observer is constructed to estimate the unmeasured states of the transformed system. A neural network is incorporated to approximate the unknown nonlinear functions while a Nussbaum function is used to deal with the unknown control direction. In addition, the strictly positive real (SPR) condition, the Razumikhin lemma, the frequency distributed model, and the Lyapunov method are utilized to derive the parameter adaptive laws and to perform the stability proof[38]. Support vector machines (SVMs) and artificial neural networks (ANNs) are two of the most effective pattern recognition techniques. Through supervised and unsupervised learning, ANNs and SVMs effectively generalise dynamic parameters [26]. Furthermore, by applying unsupervised learning to power systems, the quarter-sphere support vector machine (QS-SVM) provides a paradigm change [27].
Artificial Neural Networks (ANNs)
The applications of artificial neural networks (ANNs) in transmission line fault diagnosis are crucial for ensuring reliable and efficient power system operation. ANNs can learn complex patterns in data and detect faults with high accuracy, reducing the likelihood of false alarms and missed detections, and enabling real-time diagnosis and prompt corrective action to prevent power outages and equipment damage. Additionally, ANNs can adapt to changing system conditions, such as varying load patterns and environmental factors, ensuring accurate fault diagnosis in diverse scenarios [28]. By automating the fault diagnosis process, ANNs reduce the need for human intervention and enable swift response to faults, improving maintenance and reducing downtime. Furthermore, ANNs can identify potential maintenance needs, allowing for proactive scheduling and reducing economic losses caused by power outages and equipment damage. With their scalability and flexibility, ANNs can be integrated with other technologies, such as IoT devices and SCADA systems, making them an essential tool for modern grid management, and contributing to improved power system reliability, reduced outage times, and enhanced overall efficiency. Artificial neural networks, provide a solution for challenging pattern-oriented faults in classification and time-series (trend analysis) faults [29]. Neural networks offer a robust approach to modeling power systems, as they don’t require prior knowledge of data distribution or variable interactions, unlike traditional parametric statistical methods. This non-parametric nature enables neural networks to learn complex patterns in data, making them an attractive tool for power system analysis. Moreover, the increasing popularity of artificial neural networks in recent decades has been driven by their ability to handle complex data sets and provide accurate predictions, making them a key element in the advancement of artificial intelligence in power system engineering [29]. This is a result of the back-propagation technique, which allows modifications to be made to a network’s hidden neuronal layers during human training. An artificial neural network is highly helpful in applications needing power systems since it can be taught offline using actual data. A transmission line failure detection artificial neural network (ANN) with improved zone-reaching capabilities was shown [29].
Limitations
The application of Artificial Neural Networks (ANNs) in transmission line fault diagnosis has several limitations. One of the primary concerns is the quality and availability of data, which significantly impacts the performance of ANNs. Additionally, transmission systems are complex and dynamic, making it challenging to model and simulate faults accurately. As the size of the transmission system increases, the complexity of the ANN model also increases, making it difficult to train and implement [33].
Advantages
Despite the limitations, ANNs offer several advantages in transmission line fault diagnosis. They can learn complex patterns in data and diagnose faults with high accuracy and speed. ANNs are also flexible and can be trained to diagnose various types of faults, adapting to changing system conditions. Furthermore, ANNs can automate the fault diagnosis process, reducing the need for human intervention [34].
Disadvantages
However, ANNs also have some disadvantages. They require large amounts of data and computational resources to train, and their performance is heavily dependent on the quality of the data. ANNs can also be difficult to interpret, making it challenging to understand why a particular fault was diagnosed. Additionally, ANNs require significant computational resources, which can be a limitation in real-time applications. Finally, ANNs can suffer from overfitting, where the model becomes too specialized to the training data and fails to generalize well to new data [35].
METHODOLOGY MODELLING OF THE TRANSMISSION LINE NETWORK
The Kaduna to Kano 230 km 330 kV transmission line, a prototype of the case study transmission line network, is a sub-network of the total Nigerian power system transmission line network. A three-phase voltage source, a three-phase RLC load block, a three-phase Pi section line that acts as the transmission line, a three-phase voltage and current metre, and work areas make up this transmission line network, which was simulated using Matlab Simulink. We used a single-line power system network, which was formed by connecting these, for our investigation
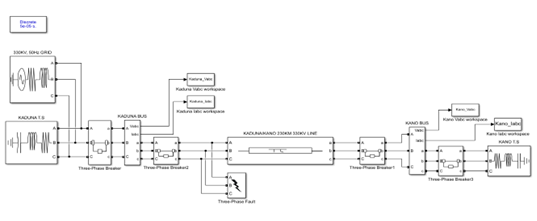
Fig. 1: modeled Kaduna to Kano transmission line
The system was simulated in a fault-free environment to determine the pre-fault currents, pre-fault voltages, single-line to ground fault current and voltage, line-to-line fault currents and voltage, and three-phase fault current and voltage. These pre-fault and fault currents and voltages were supplied into the artificial neural network model, which trained and generated results for both no-fault and fault scenarios.
Training of the Extracted Data Using Ann
Given consistent data and sufficient neurons in its hidden layer, a two-layer feed-forward network with sigmoid hidden neurons and linear output neurons (fitnet) may fit multi-dimensional mapping faults arbitrarily effectively. Unless memory is limited, the network will be trained using the Levenberg-Marquardt backpropagation method (trainlm). In that scenario, scaled conjugate gradient backpropagation (trainscg) would be used. Using regression analysis and mean square fault, the Neural Fitting software will assist you in choosing data, building and training a network, and assessing the network’s effectiveness.

Fig 2: Neural Network Architecture
The input ‘data’ is a 200001×7 matrix that contains 200001 samples of 7 elements, or static data. The ‘data’ target is a 200001×7 matrix that contains 200001 samples of 7 elements, or static data.
For this investigation, a neural network architecture with seven input data sets, ten hidden layers, seven output layers, and seven outputs was used.
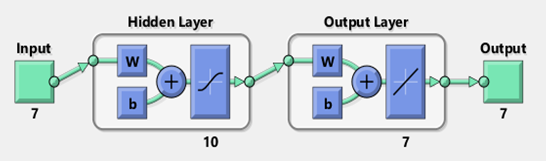
Fig 3: Neural network architecture with number of hidden layer and output layer
The input data set was trained using the Levenberg-Marquardt method, which normally needs more memory but less time. When a rise in the mean square fault of the validation samples indicates that generalisation is no longer improving, training automatically ends. The average squared difference between the objectives and the outputs is called the mean squared fault. It is preferable to have lower values. Zero indicates the absence of mistake. Regression The correlation between objectives and outputs is measured by R values. A connection is said to be close when the R value is 1, and random when it is 0.
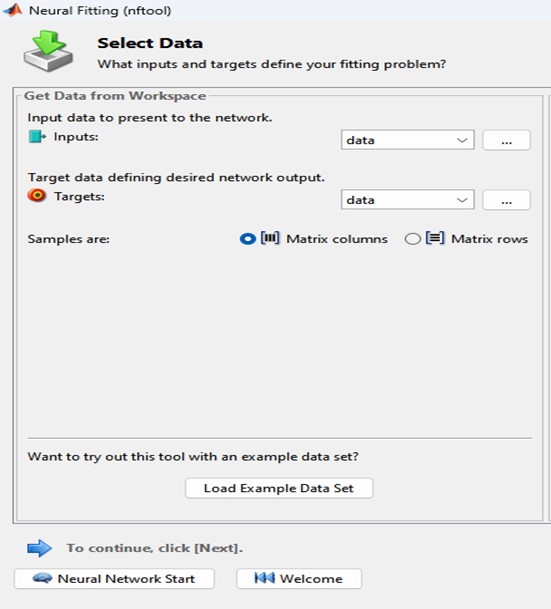
Fig. 4: Selection of Training Data for The Pre-Fault Steady State Voltage and Current Conditions
Validation data are used to measure network generalization, and to halt training when generalization stops improving.
Use of Ann for Fault Detection
We sampled the phase voltage and current on a per-unit basis, along with the objective values, and fed them into the input neurons of the selected ANN. The ANN was then trained to provide outputs for a variety of transmission line failures. The performance of the ANN fault detector depends on both the quality of the data used to train it and the accuracy of the measurements used as input.
RESULTS AND DISCUSSION
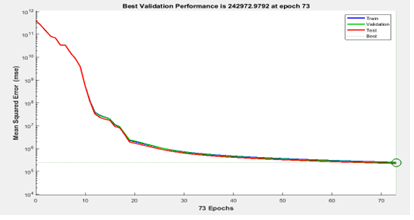
Fig. 5: Pre-fault steady state Artificial Neural Network Training data
The neural network’s capacity to learn from the data it is fed is shown by the best validation performance plot. It is provided with three types of data: training, validation, and test. The network’s weights, which function as knobs to regulate how the network interprets inputs, are adjusted throughout the training phase. The validation phase is intended to determine whether or not the network is learning effectively. The purpose of the test phase is to assess the network’s performance on fresh, unseen data. Two axes make up the plot: the vertical axis displays the fault, and the horizontal axis displays the number of epochs. An epoch is a single cycle in which the network is shown all of the training data. The degree to which the network’s outputs deviate from the targets—the right responses you want the network to generate—is measured by the fault. The network’s learning ability increases with decreasing inaccuracy. Three curves make up the plot: one for the test fault, one for validation fault, and one for training fault. The training fault illustrates how, as the network gains knowledge, its performance becomes better on the training set. The validation fault illustrates how, as the network learns, its performance varies on the validation data. The most crucial indicator of the network’s quality is the test fault, which displays the network’s performance on the test data. The graphic displays the best epoch of 73 as well as the best validation performance of 242972.9292. The network’s lowest validation fault during training represents its highest validation performance. The network’s greatest validation performance was attained during the best period.
The graph indicates that the network reached its peak validation performance at epoch 73, indicating that the network’s fault on the validation data set was at its lowest. It is also evident that the fault lines were gradually becoming smaller until epoch 73, indicating that the network was picking up new information quickly. Additionally, you can see that the value lines changed smoothly up until epoch 73, indicating that the network was learning quickly.

Fig. 6: Pre-fault steady state Artificial Neural Network Error Histogram
The distribution of the faults between the target values and the predicted values is shown by the fault histogram in the MATLAB neural network training result. The difference between the target values and the anticipated values—the neural network’s outputs—is used to compute the faults. We can assess how well the neural network matches the data and how much fault variation there is by looking at the fault histogram. The range of fault values is split into 20 equal intervals, each of which is represented by a vertical bar in the fault histogram of 20 bins. The number of samples or occurrences having an erroneous value during that period is shown by the height of the bar. The fault histogram aids in evaluating the neural network’s performance and spotting any faults. The quality of your neural network is shown by the fault histogram. If the bars are close to the zero fault line, your neural network is very accurate, even if it did make a few little mistakes. If the bars deviate significantly from the zero fault line, your neural network is not doing well and has produced significant mistakes. Your neural network performs better the closer the bars are to the zero fault line. The neural network from the training has a low fault rate, as can be seen from the above fault histogram plot, which shows that the fault histogram has the largest bin bars centred around the Zero fault line.
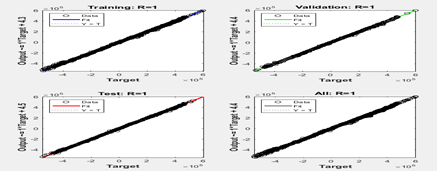
Fig. 7: Pre-fault steady state Artificial Neural Network Regression plot
The neural network regression plot in MATLAB illustrates how effectively a neural network can forecast values depending on input. Here, we used a neural network to forecast, using the voltage and current information, if a power system failure exists. The present signals and their failure state are the data that we utilised to train the neural network. The horizontal axis and the vertical axis are the two axes of the graph. The goal values, or anticipated or right values of the network we want to forecast, are shown on the horizontal axis. A line that extends from the bottom left corner to the top right corner of the graph is also present. The optimal connection between the goal and output values is shown by this line, which is known as the best fit line. All of the points will fall on this line if the goal and output values are precisely the same. Numerous dots are also strewn all across the graph, around the line. A single signal and its fault state are represented by each dot. The goal value and output value for that signal are shown by the dot’s location. A dot that is near the line, for instance, indicates that the neural network was quite successful in predicting the signal’s fault state. A dot that is far from the line indicates a very poor prediction of the signal’s fault state by the neural network. You can observe how well the neural network predicts by looking at the graph. In the figure above, the dots are perfectly aligned with the horizontal line, indicating that there is no fault situation.
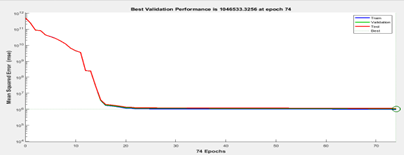
Fig. 8: Line to Ground Fault Detection results from the Artificial Neural Network Training data
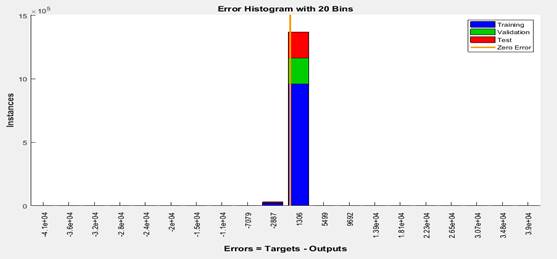
Fig. 9: Fault Histogram of Kaduna to Kano Line to Ground Fault
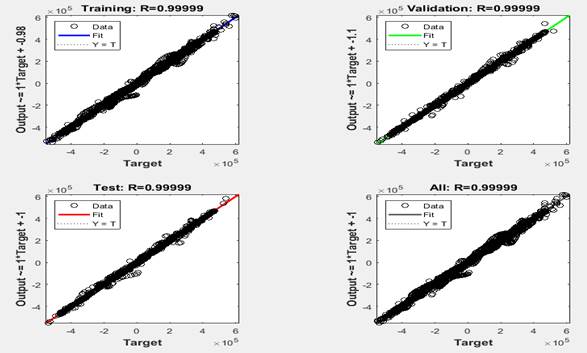
Fig.10: Regression Plot of Kaduna to Kano Line to Ground Fault
Line to Line Fault Detection results from the Artificial Neural Network Training data
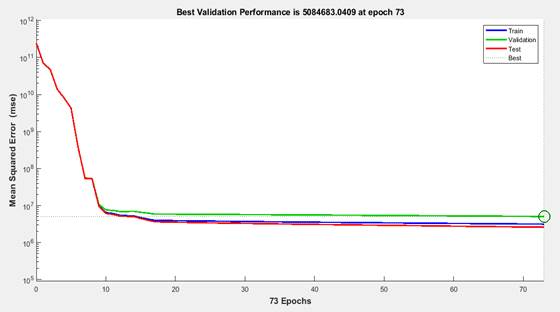
Fig. 11: Validation Plot of Line to Line Fault on Kaduna to Kano transmission line
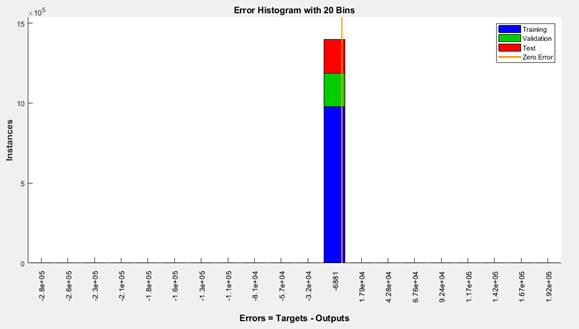
Fig. 12: Fault Histogram Plot of Line to Line Fault on Kaduna to Kano transmission line

Fig. 13: Regression Plot of Line to Line Fault on Kaduna to Kano transmission line
Line to Line to Ground Fault Detection results from the Artificial Neural Network Training data
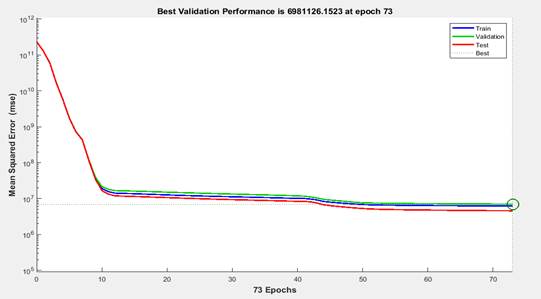
Fig. 14: Validation Plot of Line to Line to Ground Fault on Kaduna to Kano transmission line
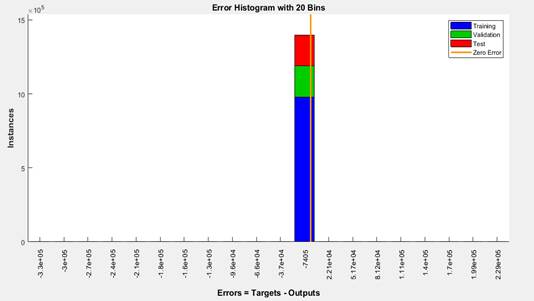
Fig. 15: Fault Histogram Plot of Line to Line to Ground Fault on Kaduna to Kano transmission line
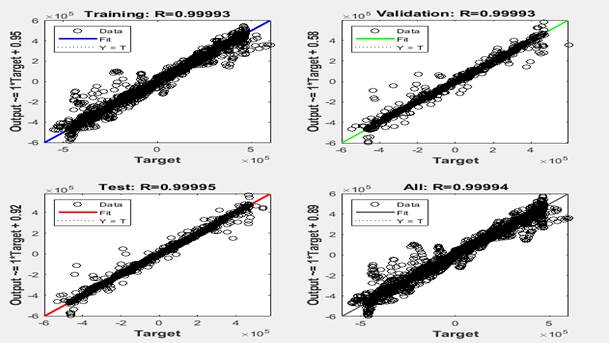
Fig. 16: Regression Plot of Line to Line to Ground Fault on Kaduna to Kano transmission line
Line to Line to Line Fault Detection results from the Artificial Neural Network Training data
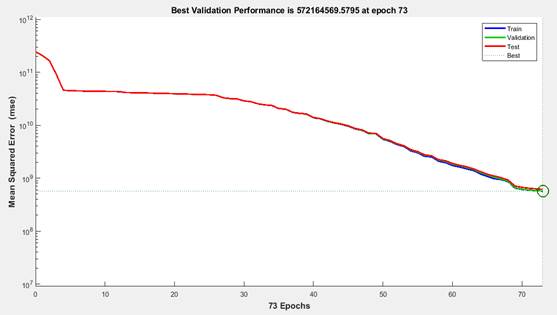
Fig. 17: Validation Plot of Line to Line to Line Fault on Kaduna to Kano transmission line
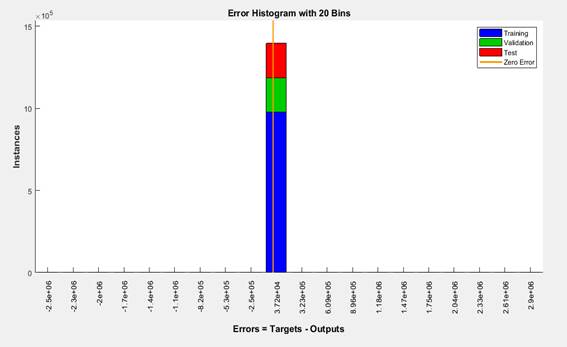
Fig. 18: Fault Histogram Plot of Line to Line to Line Fault on Kaduna to Kano transmission line
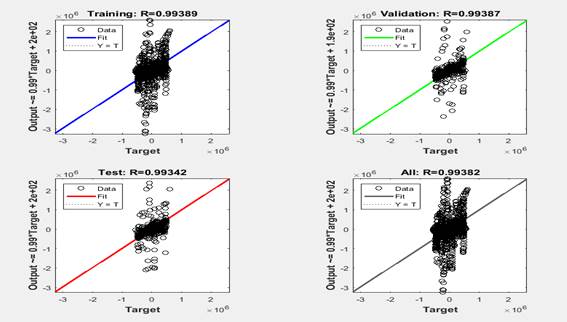
Fig. 19: Regression Plot of Line to Line to Line Fault on Kaduna to Kano transmission line
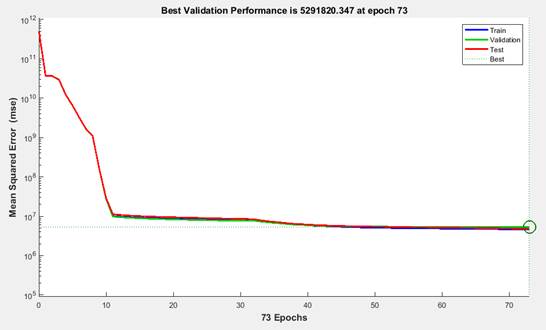
Fig. 20: Line to Line to Line to Ground Fault Detection results from the Artificial Neural Network Training data
CONCLUSION
This study utilized artificial neural network for the detection of fault on Kaduna to Kano power system transmission line. The fault current and voltages for different fault conditions were utilized as the neural network inputs. These current and voltage data were trained and the results presented. The results shown in this paper includes the prefault steady state validation plot, fault histogram, regression plot. The results for the faults detected through the use of the artificial neural network were also presented in the validation plots, fault histograms and the regression plots. The various fault conditions which includes the line to ground fault, line to line fault, line to line to ground fault, line to line to line to ground fault adopted the use of back-propagation neural network architecture. This simulation results obtained prove that artificial neural network strategy can be used in the detection of various fault conditions on the current day dynamic interconnected power system transmission line.
REFERENCES
- Khan, K. A., Quamar, M. M., Al-Qahtani, F. H., Asif, M., Alqahtani, M., & Khalid, M. (2023). Smart grid infrastructure and renewable energy deployment: A conceptual review of Saudi Arabia. Energy Strategy Reviews, 50, 101247. https://doi.org/10.1016/j.esr.2023.101247
- Technology, E. (2022, September 25). Types of Faults in Electrical Power System. electrical technology. https://www.electricaltechnology.org/2022/09/faults-in-electrical-power-system.html#google vignette
- Smith, J. (2019). Power System Insulation Failure: Causes and Effects. Journal of Electrical Engineering, 45(2), 123-130.
- Johnson, M., & Clark, R. (2020). The Impact of Contamination on Insulation Performance in Power Systems. IEEE Transactions on Power Systems, 35(1), 45-52.
- Lee, S., & Kim, H. (2018). Analysis of Short Circuit Faults in Power Systems. Electrical Power System Research, 110, 34-40.
- Patel, R., & Gupta, I. (2017). Short Circuit Faults: A Review. International Journal of Electrical Power & Energy Systems, 90, 100-110.
- Williams, T., & Taylor, P. (2021). Overvoltage Conditions in Power Systems: Causes and Mitigation Techniques. Journal of Power Sources, 480, 228-239.
- Davis, M., & Jones, A. (2022). The Effect of Lightning Strikes on Power System Stability. IEEE Transactions on Power Delivery, 37(2), 789-796.
- Zhang, Y., & Li, J. (2020). Dust Accumulation on Insulators in Power Systems: faults and Solutions. IEEE Transactions on Dielectrics and Electrical Insulation, 27(4), 1200-1208.
- Kumar, P., & Singh, B. (2019). Impact of Dust Accumulation on the Performance of Insulators in Power Systems. Electric Power Systems Research, 169, 105-112.
- Thompson, G., & White, R. (2021). Line Faults in Power Systems: Causes, Effects, and Remedial Measures. IEEE Transactions on Power Systems, 36(3), 1500-1507.
- Miller, J., & Davis, L. (2020). Safety Risks Associated with Fallen Power Lines. Safety Science, 130, 104827.
- Venkatasubramanian, V., Rengaswamy, R., Kavuri, S., & Yin, K. (2003). A review of process fault detection and diagnosis: Part I: Quantitative model-based methods. Computers & Chemical Engineering, 27(3), 293-311.
- Ge, Z., Song, Z., & Ding, S. X. (2013). Data mining and analytics in the process industry: The role of machine learning. IEEE Access, 1, 133-149.
- Kundur, P., Balu, N. J., & Lauby, M. G. (1994). Power system stability and control (Vol. 7). New York: McGraw-hill.
- Anderson, P. M., & Mirheydar, M. (1998). A low-order system frequency response model. IEEE Transactions on Power Systems, 13(1), 159-165.
- Zhang, Y., & Kezunovic, M. (2007). Transmission line boundary protection using wavelet transform and neural network. IEEE Transactions on Power Delivery, 22(2), 859-869.
- Kezunovic, M., & Rikalo, I. (1993). Detect and classify faults in transmission lines using artificial neural networks. International Journal of Engineering Intelligent Systems for Electrical Engineering and Communications, 1(3), 155-162.
- Aleem, S. A., Shahid, N., & Naqvi, I. H. (2014). Methodologies in Power Systems Fault Detection and Diagnosis. Journal of Control, Automation and Electrical Systems, 25(4), 367–384.
- S. A. Aleem, N. Shahid, and I. H. Naqvi, “Methodologies in power systems fault detection and diagnosis,” Energy Systems, vol. 6, no. 1, pp. 85–108, Jun. 2014, doi: 10.1007/s12667-014-0129-1.
- N. Kumari, S. Singh, R. Kumari, R. Patel, and N. A. Xalxo, “Power System Faults: A Review,” International Journal of Engineering Research & Technology (IJERT), vol. 4, no. 2, pp. 1-8, 2016.
- A. Mukherjee, P. K. Kundu, and A. Das, “Transmission Line Faults in Power System and the Different Algorithms for Identification, Classification and Localization: A Brief Review of Methods,” Journal of Institution of Engineers (India) Series B, Jan. 2021, doi: 10.1007/s40031-020-00530-0.
- J. Rajashekar and A. Yadav, “Transmission lines Fault Detection and Classification Using Deep Learning Neural Network,” 2022 Second International Conference on Advances in Electrical, Computing, Communication and Sustainable Technologies (ICAECT), Apr. 2022, doi: 10.1109/icaect54875.2022.9808029.
- A. S. Alhanaf, H. H. Balik, and M. Farsadi, “Intelligent Fault Detection and Classification Schemes for Smart Grids Based on Deep Neural Networks,” Energies, vol. 16, no. 22, p. 7680, Nov. 2023, doi: 10.3390/en16227680.
- S. A. Aleem, N. Shahid, and I. H. Naqvi, “Methodologies in power systems fault detection and diagnosis,” Energy Systems, vol. 6, no. 1, pp. 85–108, Jun. 2014, doi: 10.1007/s12667-014-0129-1.
- A. K. Abbas, N. A. Al-Haideri, and A. A. Bashikh, “Implementing artificial neural networks and support vector machines to predict lost circulation,” Egyptian Journal of Petroleum/Egyptian Journal of Petroleum, vol. 28, no. 4, pp. 339–347, Dec. 2019, doi: 10.1016/j.ejpe.2019.06.006.
- S. A. Aleem, N. Shahid, and I. H. Naqvi, “Methodologies in power systems fault detection and diagnosis,” Energy Systems, vol. 6, no. 1, pp. 85–108, Jun. 2014, doi: 10.1007/s12667-014-0129-1.
- H. Ma, W. Zhang, Y. Wang, Y. Ai, and W. Zheng, “Advances in corrosion growth modeling for oil and gas pipelines: A review,” Process Safety and Environmental Protection/Transactions of the Institution of Chemical Engineers. Part B, Process Safety and Environmental Protection/Chemical Engineering Research and Design/Chemical Engineering Research & Design, vol. 171, pp. 71–86, Mar. 2023, doi: 10.1016/j.psep.2022.12.054.
- Montesinos López, O.A., Montesinos López, A., Crossa, J. (2022). Fundamentals of Artificial Neural Networks and Deep Learning. In: Multivariate Statistical Machine Learning Methods for Genomic Prediction. Springer, Cham. https://doi.org/10.1007/978-3-030-89010-0_10.
- S. Qazi, “Photovoltaics for Disaster Relief and Remote Areas,” in Elsevier eBooks, 2017, pp. 1–30. doi: 10.1016/b978-0-12-803022-6.00001-0.
- Almobasher, Loiy & Habiballah, Ibrahim. (2020). Review of Power System Faults. International Journal of Engineering and Technical Research. 9. 61.
- S. Saha, M. Aldeen, and C. P. Tan, “Fault detection in transmission networks of power systems,” International Journal of Electrical Power & Energy Systems, vol. 33, no. 4, pp. 887–900, May 2011, doi: 10.1016/j.ijepes.2010.12.026.
- “Comparative Analysis of Application of Artificial Intelligence, Neural Networks and Control Systems in the Mining Industry: Advantages, Limitations and Prospects,” IEEE Conference Publication | IEEE Xplore, Jan. 29, 2024. https://ieeexplore.ieee.org/document/10468306/
- “A Comparative Study between Artificial Neural Networks and Optical Neural Networks,” IEEE Conference Publication | IEEE Xplore, Dec. 20, 2022. https://ieeexplore.ieee.org/document/10352460/
- “Comparative Analysis of Methods for Training Artificial Neural Networks Used in Diagnosing Coronary Heart Disease,” IEEE Conference Publication | IEEE Xplore, Jan. 29, 2024. https://ieeexplore.ieee.org/document/10468075/
- “Faults detection and diagnosis of transmission lines using wavelet transformed based technique,” IEEE Conference Publication | IEEE Xplore, Oct. 01, 2017. https://ieeexplore.ieee.org/document/8257776
- L. Merazka, F. Zouari, and A. Boulkroune, “Fuzzy state-feedback control of uncertain nonlinear MIMO systems,” May 2017, doi: 10.1109/icosc.2017.7958730.
- F. Zouari and A. Boubellouta, “Adaptive Neural Control for Unknown Nonlinear Time-Delay Fractional-Order Systems with Input Saturation,” in Advances in computer and electrical engineering book series, 2018, pp. 54–98. doi: 10.4018/978-1-5225-5418-9.ch003.