
Assessing the Factorial Validity of the Community of Inquiry Instrument (COI) in Filipino Students: A Confirmatory Factor Analysis
- Ma Erenita V. Bahian, maerenita.
- Danilo B. Pulma.
- Edward B. Bertulfo
- 157-168
- Dec 18, 2023
- Education
Assessing the Factorial Validity of the Community of Inquiry Instrument (COI) in Filipino Students: A Confirmatory Factor Analysis
*Ma Erenita V. Bahian, Danilo B. Pulma., Edward B. Bertulfo & Joel Maraviles,
Eastern Visayas State University-Ormoc Campus, Ormoc City, Philippines
Faculty of Education, Computer Studies and Engineering
*Corresponding Author
DOI: https://doi.org/10.51584/IJRIAS.2023.81114
Received: 06 November 2023; Revised: 15 November 2023; Accepted: 20 November 2023; Published: 18 December 2023
ABSTRACT
Numerous researchers have written extensively about the value of communities of inquiry. In order to structure and support the process of online teaching and learning, the framework highlighted aspects that are crucial for comprehending the characteristics of an online learning experience. The models and results produced by such investigations, notwithstanding efforts to examine the community of inquiry, were inconclusive. The present study evaluates the factorial validity of the Community of Inquiry Instrument. A structural equation modelling was conducted from July to September 2022 on a sample of 373 Filipino university students in Ormoc City, Philippines. A 34-item COI with three subscales: teaching presence, social presence and cognitive presence was the instrument used in the study, which were rated on a 5-point Likert scale from strongly disagree (1) to strongly agree (5). Exploratory and confirmatory factor analysis were performed using SPSS and AMOS, respectively. Results showed that Cronbach’s alpha values for each construct ranged from 0.822 to 0.917, of which the items were internally consistent. Results also illustrates that the hypothesized three-factor model that explains the 34 COI item responses was not a good fit. This may be an example of a complex model misspecification where the connection between the items and factors has been misrepresented and numerous exploratory factor analysis of the data failed to yield an interpretable solution. However, a 27-item, three-factor model turned to have a good fit ([X2 =654.764; df = 315; X2/df = 2.079; TLI=.913; CFI=.922; RMSEA=.054; SRMR=.021]. In conclusion, the 27 item COI is a valid and reliable measure for determining the students’ teaching, social and cognitive presences in virtual education.
Keywords: community of inquiry, factorial validity, confirmatory analysis, Filipino students
INTRODUCTION
The Community of Inquiry Theoretical Framework
Garrison et al. (2000) originally introduced theoretical framework of community of inquiry (CoI). The framework discovered aspects crucial in order to comprehend the dynamics of virtual learning experience also designing. Kozan and Caskurlu (2018); Olpak and Kiliç akmak (2016); Shea and Bidjerano (2009) supported online teaching and learning and also related research. According to Arbaugh et al., (2008), there are three interconnected elements of collaborative constructivist learning made up the CoI framework: teaching presence (TP), social presence (SP), and cognitive presence (CP). Also, Garrison et al., (2000), implied that educational experience appears at the crossing of these three presences, which are believed to be closely related to one another.
Cognitive Presence
The cognitive presence was termed a paradigm for development that articulates the dynamics of a valuable educational resource encounter termed as cognitive presence by Garrison et al. (2010). It was a measure of how well students in an inquiry community were able to generate definitions via consistent correspondence and it was a reflection of the investigation and study technique (Bangert, 2009; Garrison et al., 2000).
Social Presence
Garrison & Arbaugh, (2007); Kovanovi et al., (2018) stated that social presence has centered on significant issues that shape the vitual learning community’s social climate and in the degree of acknowledgment (e.g., learners’ capacity to recognize the community, meaningful conversation in a comfortable space, interpersonal relationship development) during the communication process among students. SP was instrumental in establishing a virtual learning environment that promoted rational reasoning (Bangert, 2009; Garrison et al., 2000). Several studies have found that the social presence had significant impact on students’ perceptions of learning in online courses as well as their satisfaction with the instructor and the online course itself (Caskurlu, 2018).
Teaching Presence
Olpak and Kiliç akmak (2016) and Shea & Bidjerano (2009) explained that teaching presence as the instructor planning, directing, and facilitating cognitive and social procedures to produce relevant personal learning and valuable learning outcomes. It also emphasizes students’ evaluations of the instructor’s actions. Growing understanding of the need of teaching presence for effective virtual teaching and learning, particularly when conversation and critical thinking are needed (Garrison et al., 2000). Critical thinking and meaningful learning benefited greatly from a community of inquiry. When all the components of this community were together, TP ought to have aided in fostering critical discourse and education in this setting. Moreover, Garrison (2011) stated” teaching presence corresponds to learning outcomes, learner requirements, and capabilities and serves as a component of a CoI.
The COI Instrument
The Community of Inquiry instrument (COI), a 5-point Likert type instrument was elaborated by Arbaugh et al. (2008) to assess the presence of students in virtual learning environments using a sole instrument. It includes 34 statements where participants responded on an scale 5-point scale. The three components of COI were teacher, social, presence, and cognitive presences. The Cronbach’s alpha of teacher presence was 0.94, social presence obtained was 0.91 while 0.95 for cognitive presence. Its use in numerous studies has demonstrated a degree of fair reliability and construct validity. However, the models and the results that were generated out of COI were not conclusive. For example, Arbaugh et al. (2008) found four factors in their study, but they asserted that their findings are consistent with the theoretical inferences of a three-COI component while acknowledging the possibility of a fourth factor or the possibility that the survey’s teaching presence could be further divided into subscales. Furthermore, this is similar to the results of Diaz et al. (2010), who claimed the fourth component as part of the teaching presence regardless of the fact that it was not one.
On the other hand, since the CoI instrument’s development, its improvement has been required frequently and has consequently been ongoing for the past ten years in different virtual environment (Arbaugh, et al., 2008; Kozan & Richardson, 2014; Kozan & Caskurlu, 2018; Dempsey & Zhang, 2019). Through exploratory, confirmatory, or both statistical methods, the instrument’s original correlated, three-factor structure has frequently been recovered and revalidated in refinement studies (Kovanovi et al., 2018; Garrison et al. 2010 and Swan et al., 2008).
As a move forward, there is a need to re-examine the COI items and their correspondent constructs. As a result, the study intends to evaluate the factorial validity of the Community of Inquiry on a sample population of Filipino students in order to promote wider adoption of the COI in Filipino society.
RESEARCH METHODOLOGY
Participants
Participants were students from Eastern Visayas State University – Ormoc Campus in Ormoc City, Philippines. There were 373 respondents from the 800 students through convenience sampling procedure participating in the study yielding a rate of response of 46.6%. The sample population has average age of 22.69 years old, its standard deviation was computed at 4.30. There were 173 female respondents which comprises 70.6% of the total sample population.
Even though the final sample size of 373 is small, Boomsma and Hoogland’s (2001) general recommendation of using samples larger than 200 is nonetheless followed. The greater the sample size, the more reliable the parameter values.
Instrumentation
The instrument used in this study was adopted from the 34-item COI used by Garrison (2011) implemented through a 5-point Likert scale. Three subscales make up the whole: TP with 13 items, SP with 9 items, 12 items on CP.
Procedures
The university’s ethics committee granted its clearance. Then, from July to September 2022, students were encouraged to take part in the study by completing an online survey through Google Forms. The explanatory statement and the information that participation was optional and anonymous were both given to the students. Participants filled out a questionnaire with the COI with a few brief demographic questions, which was given by a nonteaching staff member. Students took around 10 minutes to complete the scale, and by doing so, implied agreement was given. The application secured a database where it kept the data gathered from the study. After that, this data was directly transferred into SPSS 23 for additional analysis.
Data analysis
To look into the underlying constitution of the COI, an exploratory factor analysis was performed implementing principal component analysis (PCA) and varimax rotation method on the 34 items using SPSS version 23. AMOS version 18 was used to conduct a confirmatory study to evaluate the measurement model’s quality. Confirmatory factor analysis is a technique commonly used to assess the dimensionality and construct validity of scales or instruments. However, according to Byrne (2006), it assesses the number of variables (latent constructions) that most closely match the investigated model.
RESULTS
Data Screening
The data were analyzed concerning univariate and multivariate normality since maximum likelihood estimation is referring on the assumption that the observed variables are multivariate normal. There were no items with skew or kurtosis above the |3| or |8| (Kline, 2005) cutoffs, showing that univariate nonmorality was not a problem. The Mardia’s coefficient, a commonly used indicator of multivariate normality, was calculated for this study and its result was 682.74.
Since the computed value lower than the suggested value 1224, with the formula [p(p+2)], the multivariate normality conditions are met (Raykov and Marcoulides, 2008). As a result, the data were deemed sufficient to undergo confirmatory factor analysis.
Exploratory Factor Analysis
To probe the underlying structure of the COI, the 34 items were linked to a principal component analysis (PCA) using varimax rotation. Cattell (1966) scree test, the Horn (1965) parallel analysis, and the Kaiser (1960) requirement to keep eigenvalues greater than 1 (K1) were taken into account while selecting the several components. While less well-known than the K1 rule and the scree test, the parallel analysis is thought to be a more precise criterion to apply in calculating the number of components to keep (Henson & Roberts, 2006; Hayton, Allen, & Scarpello, 2004; O’Conner, 2000).
Taking into account that K1 rule looks at the components of which eigenvalues is greater than 1.0, while the scree test only considers significant differences between nearby pairs of plotted components. The K1 rule, however, only includes factors with eigenvalues higher than 1.0. The initial retrieved eigenvalues are compared to random data sets of equal size to the data acquired during the parallel analysis. When the eigenvalue of a random data component exceeds the size of the real dataset component, only the prior factors are maintained for further evaluation (O’Conner, 2000). It has been shown that this method is the most accurate for figuring out the right number of components to keep as both Catell’s scree test and Kaiser’s criterion has a possibility to exaggerate the number of components (Zwick & Velicer, 1986).
Six components with eigenvalues greater than 1.0 were found in the initial solution, accounting for 45.6% of the variance. Six factors were also found by examining the scree plot. However, the results of the parallel analysis using SPSS macro did not support the six-factor solution (O ‘Conner’s, 2000). Only the first three eigenvalues for a similarly sized randomly generated data matrix (373 respondents’ x 34 items) exceeded the threshold values. Table 1 contains information on the eigenvalues obtained by the Principal Components Analysis and including the reference values derived by the parallel analysis process.
Table 1. Comparison of Results from Principal Components Analysis (PCA) and Parallel Analysis
| Component Number | Eigenvalue generated from PCA | Criterion Value from Parallel Analysis | Decision |
| 1 | 11.2 | 1.68 | Accept |
| 2 | 2.29 | 1.58 | Accept |
| 3 | 1.94 | 1.52 | Accept |
| 4 | 1.29 | 1.47 | Reject |
| 5 | 1.2 | 1.41 | Reject |
| 6 | 1.1 | 1.37 | Reject |
A forced 3-factor solution was employed in an exploratory factor analysis employing the principal factor axis and direct oblimin rotation. Items having factor loadings of.40 or below were eliminated from further analysis, as suggested by Hair et al (2010). The findings indicate that the 34 items explained that 45.5% of the variance and that 5 of the 34 items did not meet the requirement for factor loading of at least 0.40. Hence,
29 items explaining 45.5% of the total variance and loaded on three factors (34 minus 5) were kept for further analysis (Table 2).
Table 2. Results of the Principal Factor Axis and Direct Oblimin Rotation
| Item Number | Item | Component | ||
| 1 | 2 | 3 | ||
| TP1 | The instructor clearly communicated important course topics. | 0.531 | ||
| TP2 | The instructor clearly communicated important course goals. | 0.752 | ||
| TP3 | The instructor provided clear instructions on how to participate in course learning activities. | 0.741 | ||
| TP4 | The instructor clearly communicated important due dates/time frames for learning activities. | 0.673 | ||
| TP5 | The instructor was helpful in identifying areas of agreement and disagreement on course topics that helped me to learn. | 0.788 | ||
| TP6 | The instructor was helpful in guiding the class towards understanding course topics in a way that helped me clarify my thinking. | 0.796 | ||
| TP7 | The instructor helped to keep course participants engaged and participating in productive dialogue. | 0.72 | ||
| TP8 | The instructor helped keep the course participants on task in a way that helped me to learn. | 0.759 | ||
| TP9 | The instructor encouraged course participants to explore new concepts in this course. | 0.76 | ||
| TP10 | Instructor actions reinforced the development of a sense of community among course participants. | 0.652 | ||
| TP11 | The instructor helped to focus discussion on relevant issues in a way that helped me to learn. | 0.652 | ||
| TP12 | The instructor provided feedback that helped me understand my strengths and weaknesses relative to the course’s goals and objectives. | 0.584 | ||
| TP13 | The instructor provided feedback in a timely fashion. | ..527 | ||
| SP3 | The instructor provided clear instructions on how to participate in course learning activities. | 0.714 | ||
| SP4 | The instructor clearly communicated important due dates/time frames for learning activities. | 0.772 | ||
| SP5 | The instructor was helpful in identifying areas of agreement and disagreement on course topics that helped me to learn. | 0.703 | ||
| SP6 | The instructor was helpful in guiding the class towards understanding course topics in a way that helped me clarify my thinking. | 0.733 | ||
| SP7 | The instructor helped to keep course participants engaged and participating in productive dialogue. | 0.699 | ||
| SP8 | The instructor helped keep the course participants on task in a way that helped me to learn. | 0.579 | ||
| SP9 | The instructor encouraged course participants to explore new concepts in this course. | 0.643 | ||
| CP1 | Problems posed in this course increased my interest in course issues. | 0.462 | ||
| CP3 | I felt motivated to explore content-related questions. | 0.475 | ||
| CP4 | I utilized a variety of information sources to explore problems posed in this course. | 0.486 | ||
| CP5 | Brainstorming and finding relevant information helped me resolve content related questions. | 0.58 | ||
| CP7 | Combining new information helped me answer questions raised in course activities. | 0.735 | ||
| CP8 | Learning activities helped me construct explanations/solutions. | 0.615 | ||
| CP9 | Reflection on course content and discussions helped me understand fundamental concepts in this class. | 0.678 | ||
| CP12 | I can apply the knowledge created in this course to my work or other no in cass related activities. | |||
| Total Variance Extracted | 11.2 | 2.29 | 1.94 | |
| % Variance Accounted | 33.1 | 6.75 | 5.71 | |
Factor 1- Teaching presence, Factor 2- Social presence, Factor 3- Cognitive presence
Confirmatory Factor Analysis
The effectiveness of the measurement model was assessed using maximum likelihood confirmatory factor analysis. congruent validity was created by assessing the significance of individual item loadings with t-values. Absolute fit indices evaluate how well the proposed mode matches the data while accounting for the model’s complexity, whereas incremental fit indices evaluate how well a specific model fits in comparison to a different baseline model. Hair et al. (2010) argued in favor of using fit indices from multiple categories. The standardized root mean residual (SRMR), Tucker Lewis index (TLI), comparative fit index (CFI), X2 statistic, and root mean square error of approximation (RMSEA) were all used in the investigation. For a model to be considered well-fitted, the TLI and CFI must both be greater than 0.90; the chi-square normalized by degrees of freedom (X2 /df) should not be greater than 3.00. (Carmines and McIver, 1981). The RMSEA should not be greater than 0.08 to be considered acceptable; values less than or equal to.05 would indicate a more accurate approximation (Kline, 2005). The SRMR value of a model that adequately matches the data is less than.05 (Byrne, 2006).
The CFA results demonstrated that the model fit for the 29 items, however, was not satisfactory [X2 = 933.144; df = 375; X2/df=2.488; TLI=.864; CFI=.874; RMSEA=.063; SRMR=.023]. By an examination at the modification indices, two items were removed for loading less than 0.50 (CP1 and CP3). Consequently, five more CFAs were conducted with three factors until all fit indices are acceptable. However, 6 error variances were correlated. An acceptable model fit was achieved using data from the remaining 27 items [X2 =654.764; df = 315; X2/df = 2.079; TLI=.913; CFI=.922; RMSEA=.054; SRMR=.021]. Cronbach’s alpha values for each construct ranged from 0.822 to 0.917, comparable to the findings drawn by Nunnally & Bernstein (1994), of which the items were internally consistent. The factor loadings of the remaining 27 items on the three constructs in the confirmatory factor model are displayed in Table 3. The list of the 27-item, 3 factor measure of COI is shown in the Appendix.
Table 3. Parameter and reliability estimate of 27-item COI
| Item | SFL | AVE | Alpha | CRa |
| Factor 1 | 0.461 | 0.915 | 0.917 | |
| 1. TP1 | 0.651 | |||
| 2. TP2 | 0.698 | |||
| 3. TP3 | 0.674 | |||
| 4. TP4 | 0.654 | |||
| 5. TP5 | 0.77 | |||
| 6. TP6 | 0.725 | |||
| 7. TP7 | 0.746 | |||
| 8. TP8 | 0.743 | |||
| 9. TP9 | 0.705 | |||
| 10. TP10 | 0.676 | |||
| 11. TP11 | 0.567 | |||
| 12. TP12 | 0.616 | |||
| 13. TP13 | 0.569 | |||
| Factor 2 | 0.416 | 0.834 | 0.832 | |
| 14. SP3 | 0.681 | |||
| 15.SP4 | 0.627 | |||
| 16. SP5 | 0.685 | |||
| 17. SP6 | 0.666 | |||
| 18. SP7 | 0.611 | |||
| 19. SP8 | 0.607 | |||
| 20. SP9 | 0.634 | |||
| Factor 3 | 0.4 | 0.822 | 0.822 | |
| 21. CP4 | 0.65 | |||
| 22. CP5 | 0.634 | |||
| 23. CP6 | 0.677 | |||
| 24. CP7 | 0.65 | |||
| 25. CP8 | 0.58 | |||
| 26. CP9 | 0.612 | |||
| 27. CP12 | ..613 |
Notes. SFL= standardized factor loading; a This is the critical ratio obtained by dividing the estimate of the covariance by its standard error
Convergent and Discriminant Validities
The congruent validity of a set of measurement items in regard to their respective constructs was assessed. Fornell and Larcker (1981) offered three techniques. For each construct, these are the extracted average variance, item reliability, and composite reliability. To assess item reliability, the factor loading of an item onto the underlying construct was used. A factor loading larger than 0.50, according to Hair et al. (2006), indicates that an item is significant. Table 3 shows that the factor loadings of all the items in the measure ranged from 0.569 (item 13) to 0.770 (item 5). Finally, the average variance extracted (AVE) test, a more conservative congruent validity test, compares the proportion of variation captured by the construct to the proportion of variation owing to measurement error. All AVEs are less than .50, which is still considered adequate when the composite reliability is higher than 0.60 (Fornnel & Larcker, 1981), and this suggests that
congruent validity is established.
When the variance between a construct and all other constructs in the model is less than the variance shared by the construct with its measurements, divergent validity is considered sufficient. The extracted average variance refers to the variance shared by a construct and its measures. The divergent validity of each construct was determined through the comparison of the square root of the AVE of the specific construct to the relative to the correlation between the construct and every other construct. All constructs were significantly associated, with moderate correlation coefficients, according to the inter-factor correlation matrix in Table 4. The average’s square roots have taken the place of the diagonal components. The square roots of the extracted average variance have been used in place of the diagonal elements. For the three factors, divergent validity is believed to be sufficient.
Table 4. Inter-factor Correlation Matrix
| F1 | F2 | F3 | |
| F1 | -0.679 | ||
| F2 | 0.523 | -0.645 | |
| F3 | 0.588 | 0.516 | -0.632 |
Model Comparison
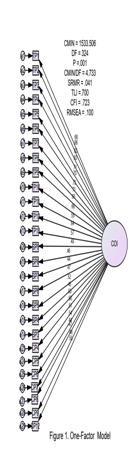
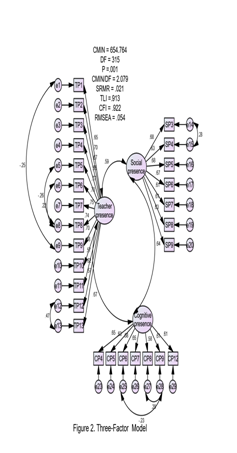
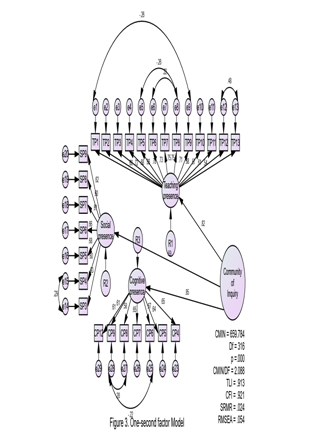
Testing various models when determining factorial validity is a common practice. A 1-factor model based on the 27 elements (Model 1) and one second-order model (Model 3) were examined in addition to the 3-factor model proposed in this study (Model 2). Support for Model 1 would imply that all 27 items are thought to fall under one factor, while support for Model 3 would imply that all three factors are related to one another also to a higher-order factor. To evaluate the three models mentioned above, several confirmatory factor analyses were done. Based on their fit indices, the model that fits the data the best will be selected. Table 5 demonstrates that that model 2 that is being presented for this study fits the data similarly to model 3. All items were designed to measure a higher order construct; hence this is a valid interpretation of the model (Community of inquiry). Model 1 unable to meet with the guidelines for an acceptable fit (Hair et al. 2010).
Table 5. CFA Results of the Three COI Models
| Model | χ 2 | χ 2 /df | TLI | CFI | RMSEA | SRMR | Model description |
| One-factor (M1) | 1533.506 | 4.733 | 0.7 | 0.723 | 0.1 | 0.041 | Not acceptable |
| Three-factor (M2) | 654.764 | 2.079 | 0.913 | 0.922 | 0.054 | 0.021 | Acceptable |
| Second- Order factor (M3) | 659.784 | 2.088 | 0.913 | 0.921 | 0.054 | 0.024 | Acceptable |
The competing models for the COI instrument are depicted in Figures discriminant validity1-3: a single-factor model (Figure 1), a correlated -factor model (Figure 2), and a second-factor model (Figure 3).
DISCUSSION
With the intention to assess the factorial validity of COI, a widely used tool among researchers, on a sample of Filipino students. The latest and current findings provide new insights into the possibility of a potential six factors. Earlier research proposed a fourth factor that might also function as a TP subcomponent as stated by Arbaugh et al., (2008) and Diaz et al., (2010). It appears, however, that they are based on the scree plots and eigenvalues. Parallel analysis was employed in the current work to compare three-factor vs. six-factor solutions while performing EFAs. The findings revealed that three factors fit the existing data better than six factors since measured eigenvalues were lower than random eigenvalues. This supports Shea and Bidjerano’s (2009) claimed that a three-factor structure would be better suited to the data than a six-factor one. These variations may have resulted from the application of various approaches. While others utilized principal axis factoring, we used PCA, which was also used by Shea and Bidjerano (2009). According to Brown (2006), the quantitative methods on which PCA relies are unrelated to the common factor model. In particular, PCA is more engaged with justifying the variance of the variables than EFA is with their intercorrelations (Brown, 2006). As a result, considering the differences between PCA and EFA, any future research must provide a complete explanation for selecting a certain statistical approach (e.g., Schmitt, 2011; Bandalos & BoehmKaufman, 2009; Field, 2009). In order to motivate future researches to contrast our goodness of fit indices with their own, we also offered a thorough presentation of them.
The parameters for the various model-fit indices were considered in the study to assess the model fit for the test factor. Acceptable RMSEA values have been suggested to be less than 0.08. [77]. Consequently, the RMSEA value of 0.054 represents an acceptable fit in this study. With a CFI and TLI values of 0.922, and 0.913, respectively, it is thought that this sample has an adequate level of fit. Based on this indicators, a 3-factor model was appropriate for this study. It has provided researchers and students a way to evaluate the COI and replicate it in other studies. However, this shows how a model might be evaluated in a different situation.
In general, factor loadings should be equal to or higher than 0.50 [63] for good congruent validity. The fact that every item has factor loadings above 0.50 indicates good congruent validity except for two items (CP1 and CP3) which were removed. Nonetheless, the critical ratio values in the COI and the three-factor Cronbach’s α have shown high congruent validity. All of the composite reliability indices for the same factor exceeded the accepted criteria of 0.70 [64]. In this analysis, the AVE of the three-factor model did not reach the 0.50 threshold. However, Fornel and Lacker [71] theory stated that a factor model is accepted if the AVE is less than 0.50 and the CR exceeds 0.60, which is true in this case.
The results from CFA suggested the hypothesized three-factor model would be better suited for COI, with all items contributing considerably to their respective factor. Each construct had a very good reliability. The structures in the COI differed sufficiently to show internal discrimination on the basis of the square root of the average variance produced.
An additional model test indicates that the proposed three-factor and a second-factor COI models suit students well. Therefore, the 27 item COI is a valid and reliable measure for determining the students’ teaching, social and cognitive presences in virtual education.
The current results should be regarded cautiously because of some limitations. First, the sample technique was convenient and only one university was used to draw participants. Generalizability is a problem as a result. This requires further study in other disciplines to support the ecological validity. Second, the sample used in this study is culturally different from Schraw and Bendixen (1994) and other studies that employed the COI to measure teaching, social and cognitive presences. It was possible that culture in this case may have served as a confounding variable. This study emphasizes how crucial cultural contexts are in the case of COI, and future research on the topic might incorporate additional validation involving participants from different cultures, communities and professions. Third, the courses were totally online. Adding blended learning environments to this research context, as well as in-person or in-class settings, may help shed further light on how to use the CoI survey. This aligns with latest recommendations for using the CoI Framework in contexts other than online discussions or multiple online courses (e.g., Archer, 2010). (Shea et al., 2010). Given all of these concerns, more research is required to fully understand the framework of the COI factor structure. Finally, it is possible to investigate the concurrent validity of the COI with comparable metrics.
CONCLUSION
The study of the factorial validity of the Community of Inquiry survey in Filipino students supports its application as a measurement tool in educational research. The construct validity through the exploratory factor analysis enables the identification of the teaching, social, and cognitive presences according to the theoretical framework supporting the instrument. However, the internal consistency analysis indicates a high reliability. Further, the empirical results demonstrated that the 27-item, three-factor model is the best structure for providing a valid and accurate description of the COI measure and conceptual framework. In light of this, the study recommended using the 27-item, three-factor model in COI-related online education research and practice.
REFERENCES
- Arbaugh, J.B., Cleveland-Innes, M., Diaz, S.R., Garrison, D.R., Ice, P., Richardson, & Swan, K.P.2(008). Developing a community of inquiry instrument: Testing a measure of the Community of Inquiry framework using a multi-institutional sample. The Internet and higher Education, 11(3-4), 133-136.
- Arbuckle, J. L. (2006). AMOS (version 7.0) [Computer software]. Chicago: Small Waters.
- Carmines, E. G., & McIver, J. P. (1981). Analyzing models with unobserved variables: Analysis of covariance structures. In George W. Bohrnstedt &Edgar F. Borgatta (Eds.), Social measurement: Current issues (pp. 65-115). Beverly Hills, CA: Sage Publications.
- Cattell, R. B. (1966). The scree test for the number of factors. Multivariate Behavioral Research, 1(2), 245-276.
- Choy, S. C., & Cheah, P. K. (2009). Teacher perceptions of critical thinking among students and its influence on higher education. International Journal of Teaching and Learning in Higher Education, 20(2), 198-206.
- Elliot, A. J., & McGregor, H. A. (2001). A 2×2 achievement goal framework. Journal of Personality and Social Psychology, 80, 501-519.
- Everson, H. T., & Tobias, S. (1998). The ability to estimate knowledge and performance in college: a metacognitive analysis. Instructional Science, 26, 65-79.
- Fornell, C., & Larker, D. F. (1981). Evaluating structural equation models with unobservable variables and measurement error. Journal of Marketing Research, 18, 39-50.
- Gardner, H. (1991). The unschooled mind: How children think and how schools should teach. New York: Basic
- Hair, Jr., J. E., Black, W. C., Babin, B. J., & R. Anderson, E. (2010). Multivariate data analysis, Seventh edition, Upper Saddle River, New Jersey: Prentice-Hall.
- Hu, L., & Bentler, P. M. (1999). Cutoff criteria for fit indexes in covariance structure analysis: Conventional versus new alternatives. Structural Equation Modeling, 6, 1-55.
- Karmiloff-Smith, A. (1992). Beyond Modularity: A Developmental Perspective on Cognitive Science. MIT Press, Cambridge (Mass).
- Kaiser, H. F. (1960). The application of electronic computers to factor analysis. Educational and Psychological Measurement, 20, 141-151.102.
- Kline, R. B. (2005). Principles and practice of structural equation modeling. (2nd Edition).
- New York: The Guilford Press. Kuhn, D. (1999). Metacognitive development. In L. Balter & C. S. Tamis-Le Monda (Eds.), Child psychology: A handbook of contemporary issues (pp.259-286). Ann Arbor, MI: Taylor and Francis.
- Kuhn, D., & Dean D. (2004). Metacognition: A bridge between cognitive psychology and educational practice. Theory into Practice, 43(4), 268-274.
- Lee, C. B., & Teo, T. (2011). Shifting pre-service teachers‟ metacognition through problem solving. The Asia-Pacific Educational Researcher, 20(3), 583-590.
- Lee, C. B., Teo, T., & Bergin, D. (2009). Children‟s use of metacognition in solving everyday problem: An initial study from an Asian context. Australian Educational Researcher Journal, 36(3), 89-104.
- Lee, C. B., Teo, T, & Chai, C, S. (2010). Profiling pre-service teachers‟ awareness and regulation of their own thinking: Evidence from an Asian country. Teacher Development, 14(3), 296-306.
- MacCallum, R. C., Browne, M. W., & Sugawara, H. M. (1996). Power analysis and determination of sample size for covariance structure modelling. Psychological Methods, 1(2), 130-149.
- Maruyama, G. M. (1998). Basics of structural equation modeling. Thousand Oaks, CA: Sage.
- Magno, C. (2010). The role of metacognitive skills in developing critical thinking. Metacognition Learning, 5, 137-156.
- Mayer, R. (1998). Cognitive, metacognitive, and motivational aspects of problem solving.
- Instructional Science, 26, 49-63 Noar, S. M. (2003). The role of structural equation modeling in scale Structural Equation Modeling, 10(4), 622-647.
- Nunnally, J. C., & Bernstein, I. H. (1994). Psychometric theory (3rd ed.). New York: McGraw-Hill.
- Raykov, T., & Marcoulides, G. A. (2008). An introduction to applied multivariate analysis. New York: Taylor and Francis.
- Royer, J. M., Cisero, C. A., & Carlo, M. (1993). Techniques and procedures for assessing cognitive skills. Review of Educational Research, 63, 201-243.
- Sperling, R. A., Howard, B. C., Miller, L. A., & Murphy, C. (2002). Measures of children‟s knowledge and regulation. Contemporary Educational Psychology, 27, 51-79.
- Veenman, M. V. J., Kok, R., & Blote, A. W. (2005). The relation between intellectual and metacognitive skills in early adolescence. Instructional Science, 33, 193-211.
- Veenman, M. V. J., Van Hout-Wolters, B., & Afflerbach, P. (2006). Metacognition and learning: Conceptual and methodological considerations. Metacognition Learning, 1, 3-14.
- Zohar, A., & David, A. B. (2009). Paving a clear path in a thick forest: A conceptual analysis of a metacognitive component. Metacognition Learning, 4, 177-195.