
Assessment of Heavy Metals Contamination In Surface Soil of Ishiagu, Southeastern Nigeria.
- Bridget Ozibo-Igwe
- Luke O. Anike
- 23-29
- Jun 28, 2024
- Environment
Assessment of Heavy Metals Contamination in Surface Soil of Ishiagu, Southeastern Nigeria.
Bridget Ozibo-Igwe1*, Luke O. Anike2
1Faculty of Physical Sciences, Alex Ekwueme Federal University, Ndufu-Alike, Ikwo, Ebonyi State, Nigeria.
2Faculty of Physical Sciences, Nnamdi Azikiwe University, Awka, Anambara State, Nigeria
*Corresponding Author
DOI: https://doi.org/10.51584/IJRIAS.2024.906003
Received: 11 May 2024; Revised: 23 May 2024; Accepted: 27 May 2024; Published: 28 June 2024
ABSTRACT
Identification and quantification of heavy metals contamination in soil is very important as far as human health and environmental quality protection are concerned. Heavy metals enter the soil through natural and anthropogenic sources but contamination concern is mainly associated with anthropogenic input which is capable of increasing the natural concentration to contamination and toxic levels. Heavy metals can migrate from contaminated soil to other components of the environment with the possibility of human exposure and severe health implication. This study investigated heavy metals contamination of soils in Ishiagu area using pollution indices. Soil samples were collected at various points within the study area at depths of 0-20cm. Collected soil samples were analyzed for total metal concentration using ICP-OES after Aqua regia digestion in Bureau Veritas laboratory, Canada. The result of the analysis showed that heavy metals content in Ishiagu soil varies with location and is in the order: Zn (5 – 1450), Ni(1 – 73 ) Cu (3 – 37 )Cr(6 – 64 )Fe (2800 – 80800 )Al (2200 – 27400 ). The average concentration of the metals in the soil of the study area is in the order: Fe>Al > Zn>Cr > Ni> Cu. Based on the calculated average contamination Factors (CFs), there is moderate contamination of Zn in the investigated soil while the contamination level of other heavy metals that include Cr, Ni, Cu, Al and Fe are low; mean values less than 1(CF<1).The Igeo values calculated for each location range from practically uncontaminated with Cr, Ni, Al, Fe and Cu in all the locations to moderately contaminated with Zn in mining areas. However, the average igeo values for all the metals indicate no contamination in the study area soil. The knowledge of soil contamination status is relevant for environmental management decision.
Key word: soil contamination, heavy metals, Ishiagu, Nigeria.
INTRODUCTION
Weathering of rock minerals causes local accumulation of heavy metals in soils. Igneous and metamorphic rock types constitute 95% of the earth’s crust, with sedimentary rocks making up the remaining 5% (Pettijohn FJ (1957)). Heavy metals substitute isomorphically for cations of similar ionic radius in rock forming silicate minerals which result in them becoming natural part of the soil formed from rock weathering. However, the natural concentrations of heavy metals in soils may increase as a result of anthropogenic activities such as mining, waste disposal, fuel burning and agricultural activities. Elevated heavy metals concentration can lead to the contamination of soil which has severe implication for the wider environment. Contaminated soil poses risk because metal contaminant can migrate from the soil to other components of the environment including humans. The exposure of humans to heavy metals has negative effect (Ngole-Jeme, V. M., & Fantke, P. 2017) as they deteriorate the blood system and organs such as the lungs, kidneys and liver. Heavy metals can affect the central nervous system, promote diseases such as Parkinson’s and Alzheimer’s, and cause mutation or cancer (Hooda 2010).
The assessment of soil contamination in Ishiagu is important to ascertain the impact that anthropogenic activities such as mining and quarry may have on the soil quality. Contamination factor and goeaccumulation index have been shown to be effective in determining soil pollution status (Sikakwe Greg. U., 2017).
The Study Area
Ishiagu is part of a sedimentary basin referred to as the Benue trough which is a rift basin in central West Africa that contains up to 6,000 m of Cretaceous – Tertiary sediments(Obaje, 2009). The area is also intruded in many places by Santonian intrusive rocks and mineralized in some parts by hydrothermal Pb-Zn ores (Kogbe, 1976). It is located within latitude 5º55′ and 6º00’N and longitude 7º29′ and 7º35’E and is in southeastern Nigeria. Fig 1 shows the geology of the area. One of the foremost colleges of agriculture in Nigeria is located in this area due to its vast agricultural potential. A number of ore mines are located at different parts of the area making heavy metals monitoring with respect to contamination in soils of the area important.
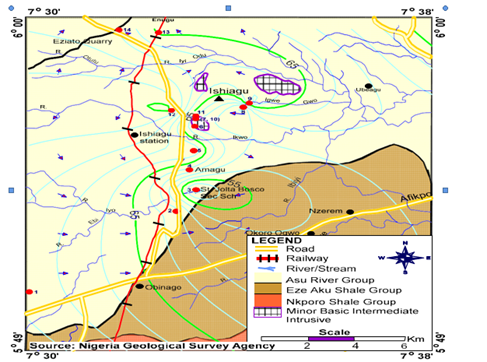
Fig. 1. Geological map of Ishiagu ( adopted from Obioha Y. E., 2018)
Climate and Soil
Ishiagu lies in the tropical climate region influenced by two seasons which are, 1) the rainy season from March to October and, 2) the dry season which lasts from November to February The two seasons result from two air masses that blow across Nigeria at different time of the year; the Maritime air mass and the Continental air mass. The maritime air mass also referred to as south western monsoon wind, from the Atlantic Ocean (moisture laden) brings rain between March and October of each year. The tropical continental air mass also referred to as the northeast trade wind, which is cold, dry and dusty, from Sahara desert causes harmattan from November to February. Ishiagu has an average temperature of 27oC (Duze and Ojo, 1982 as cited in Iyi E. C., Onyekwelu I.L. and Emenaha O.T., 2021) with an average annual rainfall of 1500mm – 2300mm (Ofomata G. E. 1965). The soil of the study area is red ferrasols (Areola, 1982), described by Eze and Chukwu (2011).as red-brown gravelly/pale clayey soils.
MATERIALS AND METHODS
Sample Collection and Laboratory Analysis
Samples were collected randomly and independently across the study area (Scholz et al., 1994). Soil samples were collected from cultivated areas covering mining and non mining sites, quarry sites and residential areas. A total of 45 soil samples were collected at depths of 0-20cm using steel hand auger. Large particles of stones were hand –picked from the sample and the silty –clay size put in a well labeled plastic container with cover. Geographical positioning system (GPS) was used to record the coordinate of each sample location at the point of collection in the field. The auger was properly cleaned after each sample collection to avoid mixing and contamination of the samples. Soil samples were air dried at room temperature and store in a plastic container at room temperature prior to analysis in the laboratory. The concentration of heavy metals in the samples was measured using inductively coupled plasma optical emission spectrometry (ICP-OES) after aqua regia digestion in Bureau Veritas laboratory, Vancouver, Canada. For each experiment, a run included blank, certified reference materials (CRM) and samples were analyzed in duplicate to eliminate any batch-specific error. The certified reference materials (STD DS11and STD OREAS 262) were analyzed to confirm analytical performance and good precision of the applied method. Reference materials were calibrated to an aqua regia digestion/ICP-ES determination against published values for a concentrated HCl and nitric acid (HNO3) digestion of the Canadian Certified Reference Materials Project (CCRMP).
Data Analysis
Contamination factor (CF)
The contamination factor is also called the single-factor pollution index; The CF is the ratio obtained by dividing the concentration of each metal in the soil by the baseline or background value (Taylor, S. R., and McLennan, S. M., 1985).Taking the background value as the baseline value, the contamination factor can be used to reflect the degree of human-caused disturbance on the soil, and if taking the environmental quality standard for soils or soil screening value as the baseline value, it can be used to assess the degree of contamination and evaluate the impact of soil environmental quality on human life(Tomlinson, D.L.; Wilson, J.G.; Harris, C.R.; Jeffrey, D.W 1980). Contamination factor is calculated using equation (1).
CF=Cm/CB…………………………………………………………………………(1)
Where CM represents the measured concentration of the elements studied and CB is the average geochemical background concentration of the metal in crust (Taylor, S. R., and McLennan, S. M., 1985).
The classification of contamination is shown in table 1.
Table 1. Categories of soil contamination based on contamination factor (Kumar and Edward, 2009)
| CF | Category of contamination |
| CF< 1 | Low contamination factor |
| CF= 1 – 3 | Moderate contamination factor |
| CF= 3 – 6 | Considerable contamination factor |
| CF > 6 | Very high contamination factor |
Geo-Accumulation Index (Igeo)
Geoaccumulation index is the most popular index for pollution evaluation based on single heavy metals in soils (Men, C.; Liu, R.; Xu, F.; Wang, Q.; Guo, L.; Shen, Z. 2018). It is a quantitative measure of the extent of metal accumulation in soil proposed by Muller (1969). This index (Igeo) is calculated by computing the base 2 logarithm of the measured total concentration of the metal over its background concentration according to Muller, (1969) in equation (2).
Igeo = log2(Cm/(1.5 X Bm))…………………………………… (2)
Where Cm is the concentration of metal in the soil samples, and Bm is the geochemical background value of the metal. The classification of geoaccumulation is as contained in table 2.
Table2. Geoaccumulation index classification (Muller, 1969).
| Igeo value | Class | Soil quality |
| Igeo ≤0; | 0 | Practically uncontaminated |
| 0< Igeo < 1; | 1 | uncontaminated
to moderately contaminated |
| 1 < Igeo < 2; | 2 | Moderately contaminated |
| 2 < Igeo < 3; | 3 | Moderately to heavily contaminated |
| 3 < Igeo < 4; | 4 | Heavily contaminated |
| 4 < Igeo < 5; | 5 | Heavily to extremely contaminated |
| Igeo > 5. | 6 | Extremely contaminated |
RESULTS
Table 3. Statistical summary of some heavy metals in Ishiagu soils.
| Minimum | Maximum | Mean | Median | Std. Deviation | Coefficient of variation(CV) | Skew | |
| Zn | 5 | 1450 | 162.64 | 57 | 340.981 | 2. 096 | 3,064 |
| Al | 2200 | 27400 | 11374.22 | 10100 | 5426.550 | 0.48 | 0,742 |
| Cr | 6 | 64 | 21.67 | 16 | 15.071 | 0. 69 | 1,6 |
| Ni | 1 | 73 | 15.00 | 12 | 12.801 | 0.85 | 2,575 |
| Cu | 2 | 37 | 11.18 | 10 | 7.929 | 0.709 | 1,973 |
Heavy Metals Level in Soils of the Study Area
The concentration of all the heavy metals varied across the study location. The sequence of variation is in the order: Zn >Ni>Cu>Cr>Fe>Al. The metal with the highest concentration variation, considered as exceptionally high, is Zn and is related to anthropogenic input (mining). Fe exhibited moderate variation while the variation of Al concentration is the least; suggestive of a natural occurrence (geogenic) and the least impacted metal. The Coefficient of variation (CV) of Al, Cr, Cu, and Ni are all below 1(table 3); implying principally natural source (soil parent material) for these metals. The distribution of the 6 considered heavy metals are right-skewed, which indicate that the mean values are typically greater than the median values. The range of concentration of the metals are: Zn (5 – 1450), Ni (1 – 73), Cu (3 – 37), Cr (6 – 64), Fe (2800 – 80800 ) and Al (2200 – 27400 ). Al, Cr and Cu did not exceed background values (Taylor and McLennan, 1995) and FAO/WHO standards for soil in all the locations while Zn and Fe, concentrations are higher than background and WHO permissible limits in locations where mining activities exist and below these standards in non-mining areas.
Table 4. Average values of geochemical indices
| Metals | Zn | Cr | Ni | Cu | Fe | Al |
| CF | 2.3 | 0.3 | 0.3 | 0.4 | 0.4 | 0.1 |
| Igeo | -0.9 | -2.8 | -2.5 | -2 | -2 | -3.9 |
Contamination Factor
Zn CF ranged from 0.07 to 20.42 with an average value of 4.48, indicating low to considerable contamination of Zn in the investigated soil. Other heavy metals that include Cr (0.07 to 0.75), Ni (0.02 to 1.66), Cu( 0.12 to 1.48), Fe (0.03 to 0.9) and Al(0.02 to 0.3) all have mean value less than 1(CF<1) signifying low contamination of these metals in soils of Ishiagu.
Geoaccumulation Index (Igeo)
The igeo values for the metals are shown in table 4. The range for the different metals are as follow: Zn (-0.007 to 3.8), Cr (-0.99 to -4.41), Ni (-6.04 to 0.15), Cu (-4.23 to -0.02), Fe ( -0.7 to -5.6) and Al (-6 to -2.4) . Individual heavy metals contamination status of soil in the study area shows that the soil is uncontaminated with Cr, Ni, Cu, Fe and Al while Zn caused heavy contamination in parts of the study area. The area heavily contaminated with Zn is where there is mining activity in the northwest and southwest part of the study area. Nevertheless, the average Igeo values for all the metals investigated show no contamination in the soil of the study area.
CONCLUSION
This study provided understanding of the contamination status of Ishiagu soil with respect to heavy metals using geochemical indices. It was observed that the concentration of heavy metals in the soils varied widely across the study area due to anthropogenic influences. Al, Cr and Cu did not exceed background values and FAO/WHO standards for soil in all the locations while Zn and Fe, concentrations are higher than background and WHO permissible limits in locations where mining activities exist. Generally, the average CF values indicate no contamination of soil with Cr, Cu, Al, Ni and Fe while there is moderate Zn contamination.
REFERENCES
- Areola, O.M, Onweluzo, F.A. and Omotaso O. (1 999). Exam focus Geography, Ibadan University Press PLC.
- Blaser, P., Zimmermann, S., Luster, J., Shotyk, W., (2000). Critical examination of trace element enrichments and depletions in soils: As, Cr, Cu, Ni, Pb, and Zn in Swiss forest soils. Science of the Total Environment 249, 257e280.
- Bradl, H. B. (2005). Sources and Origins of Heavy Metals. In Heavy Metals in the Environment; origin,interaction and remediation, (ed. H. B. Bradl).
- Ezeh H.N and Chukwu. E.,(2011)Small scale mining and heavy metals pollution of agricultural soils: The case of Ishiagu Mining District, South Eastern Nigeria.Journal of Geology and Mining Research Vol. 3(4) pp. 87-104,
- Ezepue, M.C. (1984). The geologic setting of lead-zinc deposits at Ishiagu and Abakiliki, Southeastern Nigeria. Journal of AfricaEarth Science, 2, 97-101.
- Fahad Ahmed, Fakhruddin A. N. M., Toufick Imam M. D., Nasima Khan, Tanzir Ahmed Khan, Md. Mahfuzur Rahman and Abu Tareq Mohammad Abdullah (2016). Spatial distribution and source identification of heavy metal pollution in roadside surface soil: a study of Dhaka Aricha highway, Bangladesh. Ecological Processes. DOI 10.1186/s13717-016-0045-5
- FAO (2001). Food and Agriculture Origanization. Lecture Notes on the Major Soils of the World. In World soil resources reports – 94, (ed. P. Driessen).
- Hooda, Peter(Ed) (2010).Trace Elements in Soils. Hoboken, NJ, USA: Wiley Blackwell.
- Iyi C., Onyekwelu I.L., Emenaha O.T., (2021). Pollution Status Evaluation and hydrogeochemical Facies Characterization of Surface and Groundwater Resources in Ishiagu Mining District, Southeastern Nigeria. Journal of Environment and Earth Science. ISSN 2224-3216 (Paper) ISSN 2225-0948 (Online)Vol.11, No.2, 2021
- Jiao, X., Teng, Y., Zhan, Y., Wu, J., Lin, X., (2015). Soil heavy metal pollution and risk Assessment in Shenyang Industrial District, Northeast China. PLoS One 10, 01-09.
- Kogbe, C.A., (1976). Paleogeographic history of Nigeria from Albian times. In: Kogbe,
- C. A. (Ed.), Geology of Nigeria. Elizabethan Publishers, Lagos, pp. 237–252.
- Men, C.; Liu, R.; Xu, F.; Wang, Q.; Guo, L.; Shen, Z (.2018). Pollution characteristics, risKassessment, and source apportionment of heavy metals in road dust in Beijing, China. Sci. Total Environ. 612, 138–147. [CrossRef] [PubMed]
- McLean, J.E, and Blendsoe, B.E. (1992) Groundwater Issue: Behaviour of metals in soils. U.S. Environmental ProtectionAgency EPA/540s-92/018..
- Mohsen Nowrouzi & Alireza Pourkhabbaz (2014). Application of geoaccumulation index and enrichment factor for assessing metal contamination in the sediments of Hara Biosphere Reserve, Iran, Chemical Speciation & Bioavailability, 26:2, 99-105, DOI: 10.3184/095422914X13951584546986
- M uller, G., 1 969. Index of geoaccumulation in sediments of the Rhine River. Geo. Journal, 2, 1 09- 1 1 8.
- Obaje, N. G. (2009). Geology and Mineral Resources of Nigeria. Springer Dordrecht Heidelberg London New York.
- Obioha Y. E., (2018) Ba-Pb Mineralization In Ugwuajirija Ishiagu Area, Lower Benue Trough, Southeastern Nigeria: Geochemical Global Journal Of Pure And Applied Sciences Vol. 24, 2018: 161-170. Doi: Https://Dx.Doi.Org/10.4314/Gjpas.V24i2.6
- Ofomata G. E. (1965). Nigeria in Maps:Eastern States, Nigeria. Ethiope Publishing House, Enugu. 98pp
- Pettijohn FJ (1957) Sedimentary rocks. Harper Bros, New York, N.Y., 2nd edn 718 pp .
- Rodríguez-Barroso M. R. , García-Morales J. L. ,Coello Oviedo M. D., Quiroga Alonso M.(2010). An assessment of heavy metal contamination in surface sediment using statistical analysis. Environ Monit Assess (2010) 163:489–501 DOI 10.1007/s10661-009-0852-6
- Scholz, R.W., Nothbaum, N., and May, T.W. (1994). “Fixed and Hypothesis-guided soil sampling methods – principles, strategies, and examples.” Environmental Sampling for Trace Analysis, VCH Publishers, New York, 335-345.
- Sikakwe Greg. U., (2017) Geochemical Mapping Of Metal Contamination and Distribution Topsoil, Western Oban Massif Southeastern Nigeria. British Journal Of Environmental Sciences.Vol.5, No.5, Pp. 1-17 October 2017
- Taylor, S. R and McLennan, S. M., 1985. The Continental crust. Its composition and evolution. Blackwell, Oxford 312p.
- Tomlinson, D.L.; Wilson, J.G.; Harris, C.R.; Jeffrey, D.W. Problems in the Assessment of Heavy-metal Levelsin Estuaries and the Formation of a Pollution Index. Helgol. Meeresunters1980, 33, 566–575. [CrossRef]
- World Health Organization (WHO) (2001). Environmental Health Criteria.