
Assessment of Potable Water Quality from Boreholes and Rainwater Reservoirs in Etsako Communities in Edo State, Nigeria.
- Ideriah, T. J. K.
- Osiriamhe, G.
- Bull, S
- Okafor, C. C.
- 178-198
- Apr 7, 2024
- Physical Education
Assessment of Potable Water Quality from Boreholes and Rainwater Reservoirs in Etsako Communities in Edo State, Nigeria.
1Ideriah, T. J. K.,2Osiriamhe, G., 2Bull, S, 2Okafor, C. C.
1Institute of Pollution Studies, Rivers State University, Nkpolu Oroworukwo, Port Harcourt
2 Department of Chemistry Rivers State University, Nkpolu Oroworukwo, Port Harcourt
DOI: https://doi.org/10.51584/IJRIAS.2024.90319
Received: 02 February 2024; Accepted: 04 March 2024; Published: 07 April 2024
ABSTRACT
The quality of water obtained from fifteen stations consisting of boreholes and rainwater reservoirs in Etsako, Edo state, were assessed in this study. The levels of physico chemical, microbial Properties were determined using standard methods recommended by the American Society for Testing and Materials for physico chemical properties and spread plate count method for microbial content. Water Quality Indices were determined using an adopted mathematical model. The results showed that the mean pH levels ranged from (4.3±0.1 – 7.2±0.1), Turbidity (0.6±0.00 – 2.0±1.3 NTU), Conductivity (17.5±0.5 – 307.5±21.5 µS/cm), TDS (12.5±0.5 – 216.0±15.0 mg/l), Salinity (0.01±0.00 – 0.19±0.05 ‰), Total Hardness (1.2±0.5 – 64.5±3.9 mg/l), Alkalinity (6.0±2.0 – 80.0±56.0 mg/l), Chloride ion (1.0±0.00 – 10.3±5.9 mg/l), Sulphate (1.0±0.00 – 9.5±4.0 mg/l), Nitrate (0.00 – 2.46±1.15 mg/l), Phosphate (0.00 – 0.69±0.02 mg/l), Total Heterotrophic Bacteria (3.00±2.00 – 2.458×10⁴±2.44×10⁴ cfu/ml), Total Coliform Bacteria (0.00 – 7.5±4.5 MPN/100ml), Faecal Coliform Bacteria (0.00 – 3.00±0.01 MPN/100ml), pH levels of water in the areas were within set limits in most stations. Water Quality Indices showed that the water in the study area ranged from poor to Unsuitable for drinking. The results from this study show that water in the study area is poor for drinking purposes and can pose health hazards to the population if consumed without proper treatment. Thus, regular monitoring, adequate treatment as well as alternative source of drinking water were recommended.
Key words: Potable, Water Quality, Boreholes, Rainwater, Reservoirs, Edo, Nigeria
INTRODUCTION
Nature is full of water, which makes up a significant portion of the earth’s ecosystem and covers around 75% of the planet’s surface. It is found as surface water in bodies of water including lakes, streams, rivers, ponds, shallow aquifers, oceans, seas, ice caps, and glaciers as well as groundwater (when it builds up in the ground), which is received as spring water, well water, and borehole water (Chandra et al., 2012). All naturally occurring water contains small amounts of atmospheric gases including N2, O2, and CO2 (Borne, 1998). Water, which is composed of the two components hydrogen and oxygen, is the most widely used solvent since it can dilute many compounds. Water also has excellent heat absorbing properties and plays a major role in the physiology of both flora and fauna (plant and animals) and also in their metabolic activities (Golterman, 1998).
In many processes, particularly those involving intricate chemical compounds like amino acids, water is a key component. It is essential to manufacturing, industrial, and agricultural processes, particularly irrigation. Since life cannot survive without water and the majority of manufacturing enterprises cannot run without it, water is a crucial natural resource. The existence of trustworthy water supplies is a crucial prerequisite for the development of a stable community (Erahet al., 2002). Water pollution from human activities frequently renders such water unfit for usage. Water pollution is a change in water quality that makes it unstable or unsafe for recreational activities, industry, agriculture, fishing, and human and animal health. However, the level of contamination of water was modest before to the onset of industrialization. Modern activities including manufacturing processes contaminated the source of drinking water. A common illustration is the placement of chemical industries along river banks, where effluent is discharged into the river. Streams and rivers get polluted when sewage is dumped into water bodies, as is done in the Lagos lagoon (Okonkwo et al., 2009).
The use of pesticides, herbicides, and fertilizers in agricultural processes results in the production of harmful compounds that are discharged into water sources as effluents, where they contaminate water bodies (Obi et al., 2007). Similar to this, the waste water from textile factories contains organic dyes that introduce various ions into the water and change its chemical composition (Olowe et al, 2005). Oil spills contaminate bodies of water and create a layer that prevents oxygen from reaching the water’s surface. As a result, the water becomes anaerobic, which kills fish and other aquatic life (Edward, 1980). The introduction of specific ions or chemicals into water during oil drilling operations frequently contaminates ground water supplies, lowering the quality of the water. Poisonous ions are clearly present in contaminated surface and ground water. However, some ions that are added to bodies of water may interact with other substances to create insoluble compounds that might cause considerable injury when ingested. Despite the fact that natural water is never pure, groundwater sources are thought to be the cleanest. However, subsurface contamination from local groundwater sources into surface water sources happens (Hutton, 1981).
The largest freshwater reserve, outside of the ice caps, is provided by groundwater, which is a crucial resource from a global standpoint. The amount of freshwater being withdrawn from the ground today accounts for about 26% of the total global outflow (VanderGun, 2012). Nearly half of the world’s drinking water comes from groundwater, and 43 percent of the world’s consumptive consumption for irrigation (Siebert et al., 2010). It is crucial for industry and as a source of energy. Groundwater is the sole trustworthy source of water in arid and semiarid areas of the planet. Groundwater supports groundwater-dependent ecosystems and significantly contributes to base-flow in rivers.
One benefit of using groundwater for drinking water supplies is that it is naturally shielded from many toxins. For instance, unique soil, climate, aquifer structure, and groundwater flow characteristics may favor de-nitrification, which would naturally attenuate high concentrations of nitrates and other pollutants with anthropogenic origins. People in water-scarce areas will depend more on groundwater during droughts and as a result of climate change due to its ability as a buffer and resilience to sudden shocks. However, climate change may have an impact on both the amount and quality of groundwater, thus it is important to include this when conducting groundwater evaluations.
Because of the pressure that human activities and climate change place on groundwater resources, an assessment of its quality is necessary. However, because groundwater is an invisible resource, most people don’t think about it. For the sake of maintaining food supply, preserving ecosystems, and safeguarding human health, our groundwater resources must be protected. Since modern water treatment is not viable from an economic standpoint, many regions and nations rely on naturally pure groundwater. Therefore, it’s crucial to understand the hazards to this resource and where to find clean groundwater.
1.2 Justification of Study
Etsako is located in the northern part of Edo State, and the inhabitants depend solely on groundwater (boreholes) and rainwater (collected in reservoirs) as their only sources of water for drinking and other purposes. Increased population over the years has led to an increase in anthropogenic activities such as farming, indiscriminate waste disposal, dumpsites, and human waste, which has led to the pollution of the groundwater in the study area. Most common disease cases in the study area include diarrhea, hepatitis A, cholera, typhoid, dysentery, and skin diseases, which are traceable to the quality of groundwater as these
diseases are waterborne.
Therefore, in an attempt to protect the health and well-being of the people in the study area, it is important to evaluate the quality of the water to reduce the rate of morbidity and mortality in the study area.
MATERIALS AND METHODS
Description of the Study Area
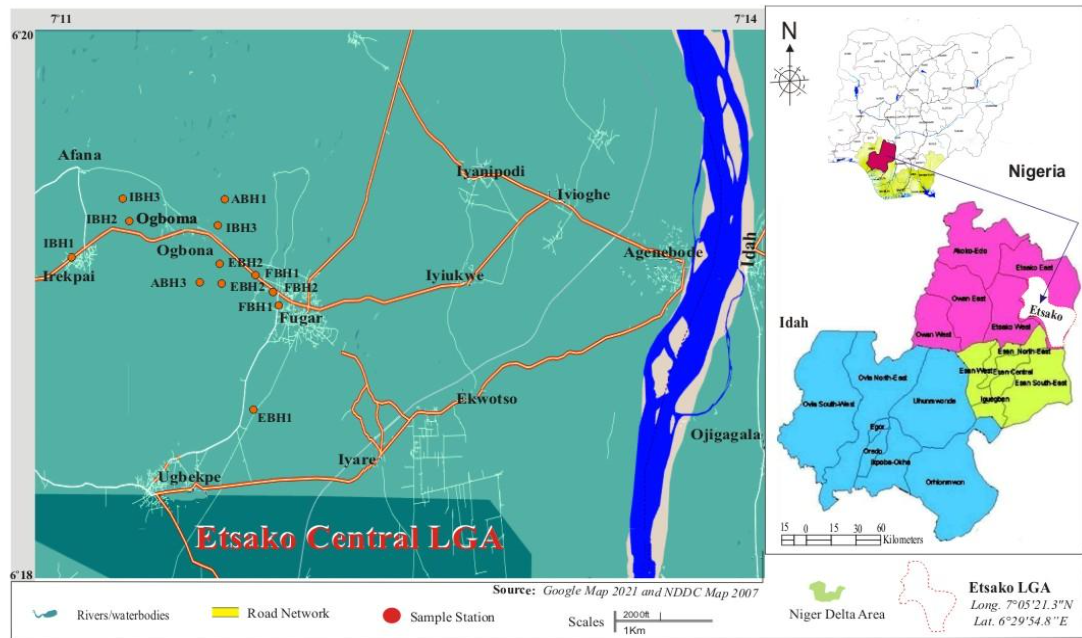
The investigation was conducted in some communities in Northern part of Edo State. It has a land area of 2800 km2 and a population 589,000 people (NPC, 2006). It is located on latitude 7′.0057″N and longitudes E 06′.4503″ (see Fig.3.1). The research area has two different seasons: the rainy season (February to November) and the dry season (December to January). The geography of the study area is primarily undulating, and it is located at an altitude of 704 meters above sea level. It has a double rainfall maxima region and a wet semi-equatorial climate, with the main rainy season falling between March and July. The period from September through November is known as the ‘small rainy season’. A typical monthly temperature of roughly 21 °C characterizes the year-round high temperatures. During the rainy season, humidity is high. An average of 84.16 percent humidity is present. The cultivation of crops like mangoes, oranges, plantains, vegetables, cassava, yams, etc. is ideal for this climatic environment. However, it must be emphasized that due to climate change, existing trends in the district’s climatic conditions are growing unpredictable. However, this has had an impact on agricultural activity. The majority of the research area’s vegetation is of the semi-deciduous rain forest variety. As a result, the land is rich in fertility and is appropriate for agricultural ventures. Cassava, rice, maize, cocoa, citrus, oil palm and other food and cash crops are commonly planted there. Secondary forests have rapidly supplanted primary forests as a result of unsustainable practices like shifting cultivation, the slash-and-burn technique of farming, illicit mining, and illegal logging.
Fig. 3.1: Map of Study Area
3.2 Sample collection
At various locations in the study area, samples were collected from residential reservoir wells and boreholes.
All water sample containers where reviewed for the right kind, volume, integrity, temperature, preservation, and holding period.
One- to two-liter plastic bottles were used to collect samples. The bottles were properly cleaned and rinsed with diluted distilled water, and a little amount of the water that would be evaluated before samples were taken. All samples taken were immediately and meticulously labeled with the name and code of the location and transported to the laboratory. The water samples were filtered using Whatman filter paper, acidified with strong HNO3 to keep the pH at 2, and then stored in a dark area. Heavy metals and microbiological content samples were brought to the laboratory in an icebox and kept there in a refrigerator at 4⁰C.
3.3 Estimation of Water Quality Parameters
An approach suggested by the American Public Health Association (APHA) in 1995 was used in the investigation. A multimeter was used to take measurements in the field of pH, specific conductivity, water level, turbidity, and temperature
3.3.1 Determination of Total Dissolved Solids (TDS)
To determine the total dissolved solids, present in the water samples, electrical conductivity was tested using a probe and a meter that apply a voltage between two electrodes. After placing the electrodes in water, the conductivity was determined by measuring the voltage drop. The voltage drop was due to resistance brought on by charged ions in the water.
3.3.2 Determination of chloride (Cl–) ion
This was determined by placing 100ml of the water sample in a 250ml beaker. The pH was adjusted to the range of 7-10 by gradually adding H2SO4, 1ml of K2CrO4 was added as indicator and the solution was titrated with 0.14M silver nitrate to give a pinkish yellow end point.
3.3.3 Determination of nitrate (NO3–)
Water sample (10ml) was transferred into 25ml volumetric flask. Then 2ml of Brucine reagent (dimethoxystrychnine-C23H26O4N2.2H2O) was added, followed by the addition of 10ml of concentrated H2SO4. The content was mixed for about 30 seconds and allowed to stand for 30 minutes. The flask was air cooled for 15 minutes, made up to the mark, and the absorbance was measured by portable datalogying spectrophotometer model DR/2023 at the wavelength of 470nm. Standard nitrate solution was prepared by dissolving 0.8g of KNO3 in 500cm3 of distilled water. 0.5cm3 of chloroform was added in order to preserve it. Aliquots having concentrations range of 0.01-2.0M of (NO3–) were prepared from stock solution and used to obtain a calibration curve. The absorbance obtained for each sample was compared to the calibration curve and the concentration of nitrate in each sample was obtained.
3.3.4 Determination of sulphate (SO42-)
The water sample (15ml) was measured into 50ml volumetric flask and 5ml of distilled water was added. 1ml of gelatinous reagent (Gum acacia) was added and made up to the mark with distilled water that formed barium sulphate turbidity. The content was thoroughly mixed and allowed to stand for 30 minutes. The optical density (OD) corresponding to the absorbance of the barium sulphate was measured using a HACH DR/2010 portable datalogying spectrophotometer at a wavelength of 420nm. Reading was taken at intervals of 30 seconds over a period of 4 minutes and the maximum reading resolved. A calibration curve was prepared using analytical grade anhydrous potassium sulphate (K2SO4) that covered the range of 0.01-1.6mg/l SO42-. From the calibration plot, the level of sulphate ion equivalent to the observed optical densities (absorbance of the test and blank solution) were read off and the level of sulphate (SO42-) ion in the sample obtained.
The Brucine method was used to estimate the concentration of nitrate ions, the turbi dimetric method was used to determine the level of sulphate, the Stannous chloride method was used to estimate the level of phosphate, the Argentometric method was used to determine the level of chloride, and the calcium ions were calculated using ethylenediaminetetraacetic acid (EDTA).
3.3.5 Determination of total alkalinity
Total alkalinity of water, usually due to the bicarbonate, carbonate and hydroxide components, was determined by titrating aliquots of the water sample against 0.020 M HCl using a mixed indicator-bro mocresol and green methyl indictor
3.4 Determination of Heavy Metals Concentrations
The research samples were gathered, and an atomic absorption spectrophotometer (AAS) was used to analyze samples for heavy metals. The sample was aspirated into a flame where it atomized to count the amount of heavy metals. A monochromator and detector were used to quantify the amount of light energy that was absorbed after the light beam was directed through the flame. A certain lamp’s ability to create a certain amount of light and have that light then be absorbed by a flame directly relates to how much of that element is present in the sample.
3.5 Microbial Content Analysis
The pour-plate method, sometimes referred to as a conventional plate count, was used in this work to conduct a heterotrophic plate count (HPC). The technique was employed to calculate the concentration of culturable, live heterotrophic bacteria in water. An aliquot (0.1) must be aseptically transferred onto a sterile petri dish or glass as part of the operation. Then, sterile, nutritious agar was added once it had cooled. The mixture was after that given time to settle and harden before being incubated for 48 hours at 37⁰C. On the plate, the formed bacterial colonies were counted and multiplied by the appropriate dilution’s reciprocal.
3.6 Water Quality Index (WQI)
The weighted numerical water quality index was used to assess the suitability for drinking purpose. In the method, water quality rating scale, relative weight and overall water quality index was calculated using the equation.
![]()
Where; qi represents the quality rating scale, Ci indicates the concentration of the i parameter and standard value of i -parameter respectively
Therefore, the relative weight was computed as
![]()
Such that the standard value of the ith parameter is inversely proportional to the relative weight
The overall water quality index (WQI) was determined using the equation below;
![]()
Where; qi = quality rating of ith water quality parameter, wi = unit weight of ith water quality parameter =1
In this study, the National Sanitation Foundation water quality approach (NSF-WQI) of United State was adopted. The National Sanitation Foundation water quality NSF-WQI includes the following nine parameters of quality; total of dissolved solid (TDS), turbidity, pH, Nitrate, Phosphates, Coliforms, Dissolved Oxygen, BOD and temperature.
WQI- NSF is a positive integer ranging between 0-100; where, indicates the weighing factor for each parameter, is the sun-index of the quality parameter which can be obtained from the conversion curve. Curves that convert parameters determine by values ranging between 0-100 (Ichwena et al, 2016).
RESULTS
Physicochemical properties
The results of physicochemical properties in groundwater samples from the study are shown in Figs. 1 – 8.
Mean pH levels ranged from 4.3±0.1 – 7.2±0.1; Temperature levels were between 29.2±0.7 and 29.5±1.0 ˚C; Turbidity levels ranged from 0.60±0.00 – 2.0±1.3 NTU; Conductivity levels ranged from 17.5±0.5 – 307.5±21.5 µS/cm; Salinity levels ranged between 0.01±0.0 and 0.19±0.05 ‰; Total Dissolved Solids (TDS) levels were between 12.5±0.5 and 216.0±15.0 mg/L; Total Hardness levels ranged from 1.2±0.5 – 64.5±3.9 mg/L; Alkalinity levels were between 6.0±2.0 and 80.0±56.0 mg/L; Chloride levels ranged from 1.0±0.0 and 10.3±5.9 mg/L; Sulphate levels were between 1.0±0.0 and 9.5±4.0 mg/L; Nitrate levels ranged from 0.000±0.000 to 2.460±1.150 mg/L; Phosphate levels were between 0.000±0.000 and 0.690±0.020 mg/L; Calcium levels ranged from 0.375±0.235 to 18.070±10.650 mg/L; Magnesium levels ranged between 0.053±0.013 and 6.735±0.245 mg/L; Sodium levels were from 0.644±0.289 to 10.59±2.015 mg/L; Potassium levels ranged from 0.289±0.134 to 15.655±2.540 mg/L; Bicarbonate levels were between 6.0±2.0 and 80.0±56.0 mg/L and Carbonate levels ranged from 0.000±0.000 to 2.218±0.776 mg/L.
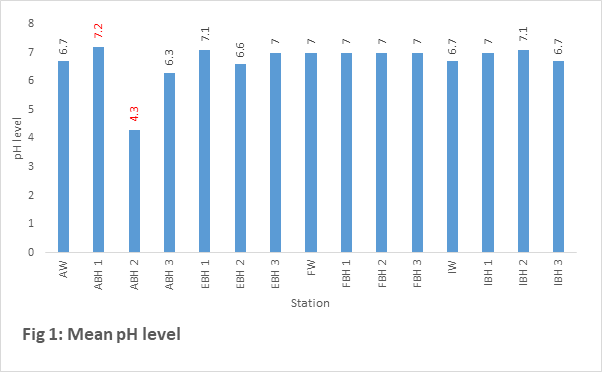
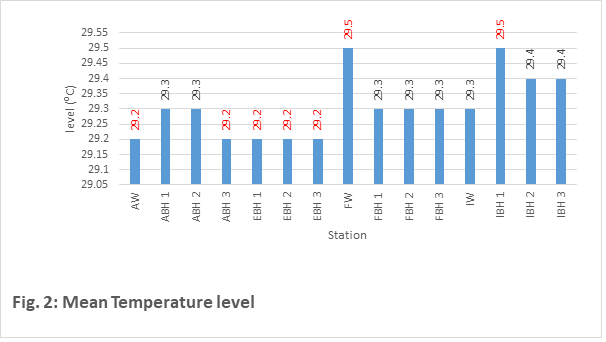
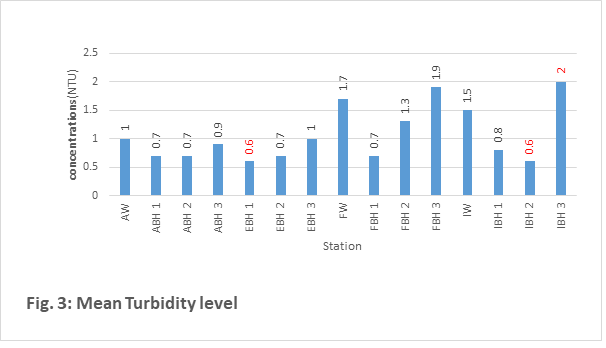
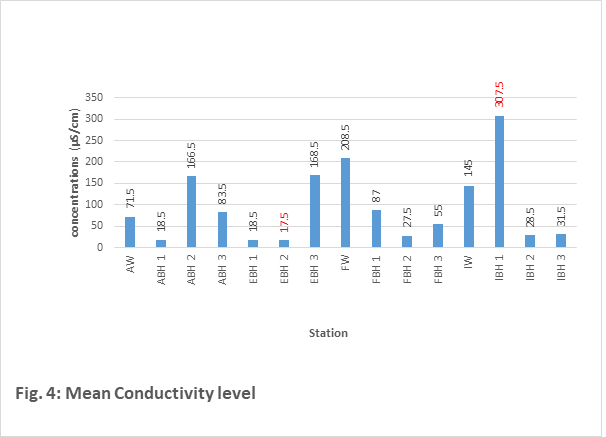
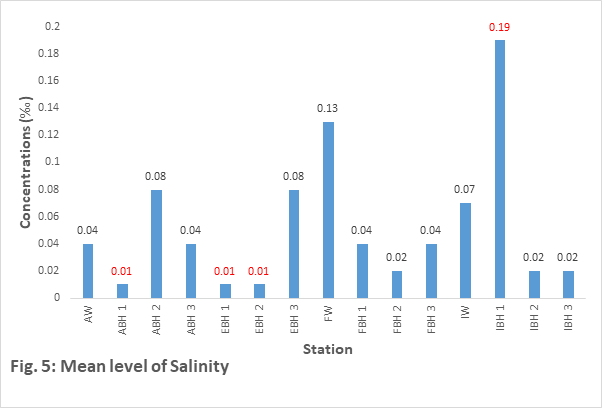
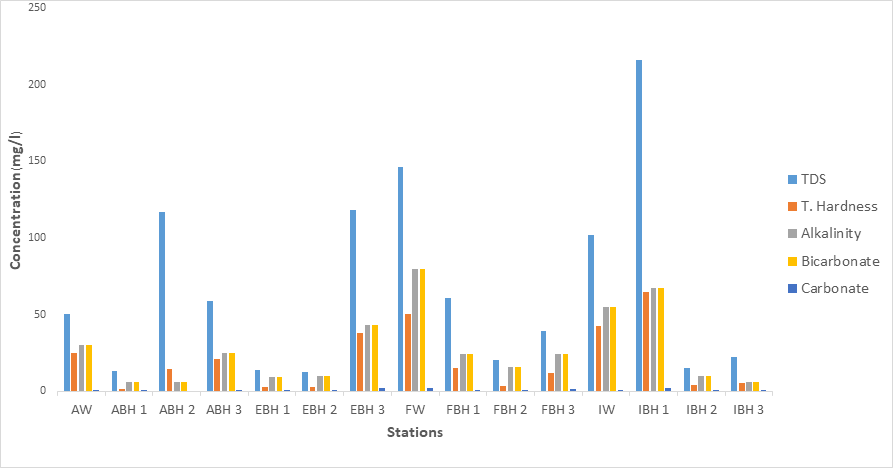
Fig. 6: Variations in Levels of some Physicochemical Parameters
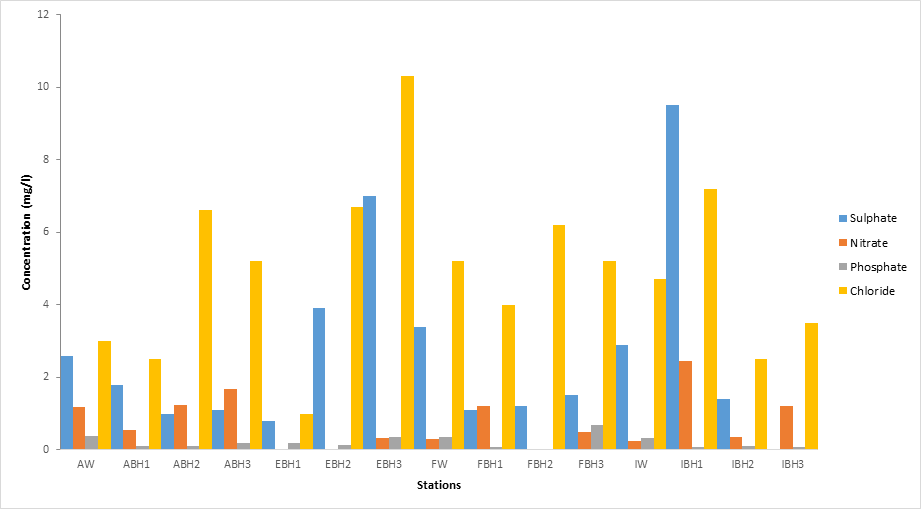
Fig. 7: Variations in Levels of some Physicochemical Parameters
Microbial Analysis
Results of microbial analysis of the water samples are shown in Table 1.
Mean Feacal Coliform Bacteria (FCB) count was between 0.00±0.00 and 3.00±0.00 MPN/100mL; Total Coliform Bacteria (TCB) count ranged from 0.00±0.00 to 7.50±4.50 cfu/mL while Total Heterotrophic Bacteria (THB) count ranged between 3.00±2.00 and 2.705×10⁴±2.695×10⁴cfu/mL
Table 1: Mean Levels of Microbial Parameters
| Stations | FCB MPN/100ml | TCB cfu/ml | THB cfu/ml |
| AW | 0.00 | 2.00±0.13 | 1.58×10²±1.10×10² |
| ABH1 | 0.00 | 4.00±0.18 | 3.5×10²±1.5×10² |
| ABH2 | 0.00 | 0.00 | 1.69×10²±1.01×10² |
| ABH3 | 0.00 | 0.5±0.03 | 5.67×10²±5.32×10² |
| EBH1 | 0.00 | 0.00 | 0.3×10±0.2×10 |
| EBH2 | 0.00 | 3.50±0.11 | 1.95×10²±0.00 |
| EBH3 | 0.00 | 0.00 | 1.12×10²±1.07×10² |
| FW | 0.00 | 7.50±4.5 | 2.458×10⁴±2.44×10⁴ |
| FBH1 | 0.00 | 0.00 | 4.35×101±4.0×101 |
| FBH2 | 0.00 | 0.00 | 2.90×10³±2.89×10³ |
| FBH3 | 3.00±0.01 | 6.00±0.22 | 3.47×10²±3.42×10² |
| IW | 0.00 | 2.50±0.24 | 2.705×10⁴±2.695×10⁴ |
| IBH1 | 0.00 | 0.00 | 1.8×101±1.6×101 |
| IBH2 | 0.00 | 0.00 | 0.8×10±0.00 |
| IBH3 | 0.00 | 0.00 | 2.5×10²±9.0×101 |
Water Quality Index
Water quality index (WQI) levels in the study area are shown in Fig. 8. Results showed that WQI levels fell between 187.27 and 530.92 across all the sample stations.
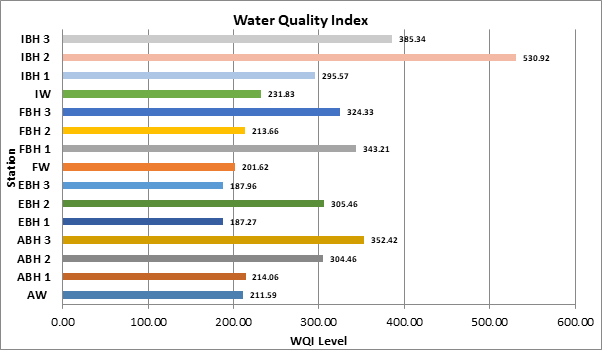
Fig. 8: Water Quality Index
| STATION | WQI |
| EBH 1 | 187.27 |
| EBH 3 | 187.96 |
| FW | 201.62 |
| AW | 211.59 |
| FBH 2 | 213.66 |
| ABH 1 | 214.06 |
| IW | 231.83 |
| IBH 1 | 295.57 |
| ABH 2 | 304.46 |
| EBH 2 | 305.46 |
| FBH 3 | 324.33 |
| FBH 1 | 343.21 |
| ABH 3 | 352.42 |
| IBH 3 | 385.34 |
| IBH 2 | 530.92 |
DISCUSSION
Physicochemical Properties
Water samples physicochemical property levels were compared to acceptable limits established by the US EPA (2004), NSDWQ (2015), and WHO (1996).
With the exception of samples from stations ABH2 (4.3) and ABH3 (6.3), the mean pH levels of the water samples were all within the permissible range of 6.5 to 8.5 set by the WHO and USEPA. The lower pH value obtained in some stations is in agreement with those obtained for similar study in Kenya by Wanyiokeet al., (2021); the study recorded pH as low as 4.78 both in dry and rainy season. The low pH is attributed to geological underground properties supported by very low levels of plant supporting parameters associated with agricultural fertilizers such as chloride, nitrate, sulphate and total phosphate. Also it could be attributed to the presence of decomposition of waste materials from dumpsites around the communities with emission of landfill gases (Adoki, 2012).
The water sample temperatures were within the permitted ranges set by the NSDWQ. Temperature affects the reduction in solubility of gases in water, how strong taste and colors are, and how quickly chemical reactions occur (Olajire and Imeppeoria, 2001). In general, cool water is safer to drink than warm water since heat encourages the growth of microbes, which can lead to problems with flavor, odor, color, and corrosion (WHO, 2011).
The water turbidity levels were all less than the WHO-acceptable limit of 5.0 NTU. The result is similar with those obtained by Ayubaet al., (2016) when they conducted similar study. Turbidity is a significant parameter in the examination of drinking water and is associated with the population of pathogenic microorganisms in the water that may originate from soil runoff (WHO, 2011).
Electrical conductivity levels in all water samples evaluated in the research region were less than the NSDWQ permissible limit of 1000 µS/cm. this was also in agreement with electrical conductivity recorded at Gboloko area by Ayubaet al., (2016). Electrical conductivity measures the degree of ions present in water, which greatly affects taste and may have a significant impact on user’s acceptance of the water.
The USEPA and NSDWQ have established a 500 mg/L TDS standard that is acceptable in drinking water. TDS levels at every location were below the permitted threshold, according to the analysis. TDS affects taste of drinking water if present at levels above the standard limits. According to Otobo (1995), “the concentration and relative abundance of ions in waters is variable and highly depends on the nature of the bedrock, precipitation, evaporation and crystallization processes”
The greatest salinity reading was 0.190‰ at Station IBH1, and neither the WHO nor the US EPA nor the NSDWQ have established salinity standards. Salinity and electrical conductivity levels as well as TDS typically work together (Amangabaraet al., 2012). High salinity levels in water and soil may lead to corrosion of equipment and infrastructure like fences, roads, and bridges, poor health or death of native vegetation, a decline in biodiversity due to the predominance of salt-resistant species, the potential alteration of ecosystem structures, and a decrease in crop yields due to the poor growth and health of salt-sensitive crops (Water Quality Australia, 2018).
The NSDWQ has established 150 mg/L as the permissible level for total hardness in drinking water. The total hardness levels in each water sample were below the permissible range. Ayubaet al., (2016) also obtained similar result in a study carried out at Gboloko area, central Nigeria. Although hard water does not represent a health risk, it can be an inconvenience when used for various household tasks like washing and cleaning. Hardness is a crucial factor in minimizing the negative effects of toxic substances in water (Bhatt et al., 1999); also, regular consumption of soft water has been associated to cardiovascular disorders (Miroslav and Vladimir, 1999).
All of the water samples had alkalinity levels below the WHO-acceptable guideline of 120 mg/L for drinking water. The levels of alkalinity in this study are similar to result obtained by Ayubaet al., (2016). Alkalinity is a measurement of the presence of weak acids and their salts in water or of a body of water’s ability to neutralize acids.
Chloride levels in every water sample examined in the research region were within the 250 mg/l permissible limit set by the NSDWQ and USEPA. Ayubaet al., (2016) recorded similar result their study at Gboloko area in central Nigeria. Chloride is mostly created when hydrochloric acid salts, including table salt (NaCl) and NaCO2, dissolve, and is then added to other substances like sewage, seawater, and industrial waste. It is crucial for the human body’s metabolism function as well as other critical physiological processes. A high chloride concentration hurts developing plants and metallic pipelines and structures (Meride and Ayenew, 2016).
The NSDWQ and WHO permissible limits for sulphate in water samples are 100 mg/l and 250 mg/l, respectively. The maximum sulphate level was 9.5 mg/l at Station IBH1. This indicates that all samples analyzed had sulphate within acceptable limit set by WHO and NSDWQ. The low Sulphate concentrations recorded could be due to the absence of anthropogenic activities that influences its concentration in water bodies. Sulphates naturally occur in groundwater via sulphides dissolution by percolating water, passing through the interstratified materials, such as pyrite, producing sulphate ions (Olobaniyi and Owoyemi, 2006).
Nitrate levels recorded in the water samples were below the standard limits of 10 mg/l set by USEPA and 50 mg/l set by NSDWQ and WHO. The highest level of 2.46 mg/l was recorded at station IBH1. Ayubael al., (2016) recorded high nitrate levels in a similar study carried out in Gboloko area in central Nigeria which is not in agreement with the result of this study. Prolonged exposure to nitrite and nitrate at levels above the maximum acceptable concentration could cause such problems as diuresis, increased starch deposits and hemorrhaging of the spleen (Reimannet al., 2003).
Calcium levels in the water samples fell below the acceptable limit of 50 mg/l by WHO for drinking water, with the highest level of 15.993 mg/l recorded at station IW. The acceptable limits for magnesium are 50 mg/l and 20 mg/l as set by WHO and NSDWQ respectively. All samples fell below these set limits. The highest level of 6.735 mg/l was recorded at station at IBH1. Ayozie (2020) reported similar results with low calcium and magnesium levels below the respective permissible limits when he carried out a similar study in Rumuola, Rumuigbo and Rumuokwuta communities. Leoni et al., (1985), in studies carried out in Abruzzo, Italy, reported an inverse relationship between the hardness (Calcium and Magnesium ions content) of drinking water and cardiovascular diseases. It has also been reported that calcium and magnesium in drinking water may help protect against gastric, colon, rectal cancer, and pancreatic cancer, and magnesium may help protect against esophageal and ovarian cancer (Pallav, 2013).
The recorded potassium levels in the water samples were all below the acceptable limit of 200 mg/l set by NSDWQ. The highest and lowest potassium levels of 15.655 mg/l and 0.289mg/l were recorded at station IBH1 and ABH1 respectively.
The highest bicarbonate levels of 80.0 mg/l was recorded at FW and the lowest level of 6.0 mg/l were recorded at ABH1, ABH2 and IBH3 respectively, while the lowest and highest carbonate levels of 0.00 mg/l and 2.21 mg/l were recorded at stations ABH2 and IBH1 respectively. Edetet al (2011) reported a HCO3–level of 71.50 mg/l within the Niger Delta area. There is no set limit for bicarbonate and carbonate by WHO and NSDWQ. According to Davis and Dewiest (1966), bicarbonate rarely exceeds 40 – 400 mg/l in water. Bicarbonate helps to buffer lactic acid generated during exercise and also reduces the acidity of dietary components (Mason, 2001).
Microbiological content
Except for station FBH3, which had an FCB value of 3.0 MPN/100ml above the NSDWQ permissible limit of 0.00 MPN/100ml, all water samples examined indicated no presence of Faecal Coliform Bacteria, indicating no danger of faecal contamination. Total Coliform Bacteria were detected in the water at stations AW (2.0 cfu/ml), ABH1 (4.0 cfu/ml), ABH3 (0.5 cfu/ml), EBH2 (3.5 cfu/l), FW (7.5 cfu/ml), FBH3 (6.0 cfu/ml), and IW (2.5 cfu/ml) which were above the safety limit of 0.00 MPN/100ml. Except for stations EBH1 and IBH2, which had THB counts of 3 and 8 cfu/ml, which are below the safety limit of 10 cfu/ml, all water samples showed Total Heterotrophic Bacterial (THB) counts over the NSDWQ safety level.
Water Quality Index
The Water Quality Index values obtained for the water samples in the study area showed that stations EBH1 (187.27) and EBH3 (187.96) had their water quality rated as POOR for drinking; FW (201.62), AW (211.59), FBH2 (213.66), ABH1 (214.06), IW (231.83) and IBH1 (295.57) had their water quality rated as VERY POOR for drinking; ABH2 (304.46), EBH2 (305.46), FBH3 (324.33), FBH1 (343.21), ABH3 (352.42), IBH3 (385.34) and IBH2 (530.92), had their water quality rated as UNSUITABLE for drinking.
CONCLUSION
The results from this study found pH levels were within set limits except for stations ABH2 and ABH3. Levels of TDS, Turbidity, salinity and Conductivity were all within standard limits. Most of the stations had Feacal Coliform Bacteria (FCB) count within standard limits. Some stations recorded high levels of lead, chromium and manganese while nickel and iron levels were all below permissible limits. The Water Quality Index classified water in the area as ranging from Poor to Unsuitable for drinking purposes.
This study recommends that in addition to monitoring the communities should seek for an alternative source of drinking water or properly treat their sources.
REFERENCES
- Abbaspour, G.,Alcamo J. Doll P, Henrichs T, Kaspar F, Lehner B, Rosch T. (2000). A contaminated site investigation: comparison of information gained from geophysical measurements and hydro geological modeling. 40- 2000. 365-380.
- Adekunle I.M., Adetunji M.T., Gbadebo A. M and Banjoko O.B. (2007). Assessment of Groundwater Quality in a Typical Rural Settlement in Southwest NigeriaInt. J. Environ. Res. Public Health, 4(4), 307-318.
- Adesuyi, A. A., Nnodu, V. C., Akinola, M. O., Njoku, K. L. and Jolaoso, A. O. (2015). Groundwater quality assessment in Eliozu community, Port Harcourt, Niger Delta, Nigeria. International Journal of Scientific and Technology Research, (4)12.
- Adoki, A. (2012). Soil and groundwater characteristics of a legacy spill site. Journal of Applied Science and Environmental Management, (16): 103-113
- Agbaire P.O. and Oyibo P.I. (2009). Seasonal variation of some Physico-chemical properties of borehole water in Abraka, Nigeria. African Journal of Pure and Applied Chemistry Vol. 3 (6), pp. 116-118.
- Akpoveta O.V., Okoh B.E., and Osakwe S.A. (2011). Quality Assessment of Borehole Water used in the Vicinities of Benin, Edo State and Agbor, Delta State of Nigeria. Current Research in Chemistry, 3: 62-69.
- Albretsen, J. (2006). The toxicity of iron, an essential element. Veterinary Medicine, 82–90.
- Amangabara, G.T. and Ejenma, E. E. (2012). Groundwater quality assessment of Yenagoa and environs, Bayelsa State, Nigeria between 2010 and 2011.Resources and Environment, 2(2): 20-29.
- American Public Health Association (APHA) (1998). Standard methods for the examination of water and wastewater. American Public Health Association, American Water Works Association, and Water Pollution Control Federation. 19th edition, Washington, D.C.
- American Public Health Association (APHA) (1998). Standard Method for the Examination of Water and Waste water.20th Edition. Section 4500 B-Cl, E- SO4 2
- Anaele F, G. (2004). Determination of some heavy metals in Orechromisnicoticus, clariasgariepinus and synontis, spp. from the coastal water of Ondo State, Nigeria. Pakistan Journal of Index Research, 45:17-19.
- Angulo, F. J., Maybeck, M. & Stanley D.W. (1997). A community waterborne outbreak of Salmonellosis and the effectiveness of a boil water order. American Journal of Public Health 87: 580-58
- APHA (1992). Standard Methods for the examination of water and wastewater, 18th edition. American Public Health Association, American Water Works Association Water Pollution control federation published by the American Public Health Association, Washington DC, USA.
- APHA (1995) Standard of water for the Examination of water and waste water; 19thedn. American Public Health Association, Washington DC.
- Asaolu, C. M. A. (2002); Environmental chemistry and toxicology, foludex press Ltd Ibadan, Nigeria p. 218.
- Atekwanna E.A., Estella A.A., Rebecca S. R. (2004). The relationship of Total Dissolved Solids measurements to bulk electrical conductivity in an aquifer contaminated with hydrocarbon. University of Missouri-Rolla. USA
- Ayozie, C. (2020). Hydrogeochemical characteristics and quality assessment of groundwater in some communities in Obio-Akpor local government area, Rivers State. Unpublished MSc Dissertation; Department of Chemistry, Rivers State University, Nkpolu-Oroworukwo, Port Harcourt.
- Ayuba, R., Omonona, O. V and Onwuka, O. S., (2016). Assessment of groundwater quality of Lokojabasement, Gboloko area north-central Nigeria. Journal of Geological Society of India 82: 413-420.
- Ayuso, R. A. and Foley, N. K. (2016). Pb-Sr isotopic and geochemical constraints on sources and processes of lead contamination in well waters and soil from former fruits orchards, Pennsylvania, USA: a legacy of anthropogenic activities. Journal of Geochemical Exploration, 170, 125-147.
- Baranowski, T. & Stables, G. (2000) Process evaluations of the 5-a-day projects. Health Education and Behavior, 27, 157–166
- Beauchamp, J. (2003). Qualité et Pollution DesEauxSouterraines, CoursUniversité de Picardie Jules Verne, Retrieved from: www.U-Picardie.fr/beauchamp/cours, pp: 10.
- Bekhit H.M., El-Kordy M.A., Hassan A.E., (2009). Contaminant transport in groundwater in the presence of colloids and bacteria: Model development and verification. Irrigation and Hydraulics Department, Cairo University. Journal of Contaminant Hydrology 108 (2009) 152-167.
- Bhargava, D. S. (2014). Use of a water quality index for river classification and zoning of the Ganga. Environmental Pollution, 6:51-67.
- Bhatt, L. R., Lacoul, H. D., Lekhak, H and Jha, P. K. (1999). Physicochemical characteristics and phytoplankton of Taudaha Lake, Kathmandu. Pollution Research 18(4), 353-358.
- Bodoczi, A. (2010). The Seasonal Quantitative Distribution of Coliform Germs in TheArieş River (Romania) Water Affected by Pollution
- Borne, R. A. (1998); the Chemistry of our Environment, J Wiley & Sons, Inc., NY. 2nd Ed. Pp. 187-189.
- Bowen, H. J. M. (1985). In D. Hutzinger (ed), The Handbook of Environmental Chemistry, Vol. 1 Part D: The natural environment and biogeochemical cycles, Springer-Verlag, New York. pp. 1-26.
- Breder, R. (1988), Environment Toxin Vol. 299 157-167
- British Geological Survey (BGS), (2003). Technical Report
- Burton, G. A., Jr., and R. E. Pitt, (2002). Storm Effects Handbook: A Toolbox for Watershed Managers, Scientists, and Engineers.Lewis Publishers, Boca Raton, FL.
- Calow Roger, C., Alan M. McDonald, Alan L. Nicol and Nick Robins S. (2011). Groundwater Security and Drought in Africa.Linking Availability, Access and Demand.
- Campbell, B. C. (1977). Renal insufficiency associated with excessive lead exposure. British Medical Journal, 1;482-485
- Chandra, S; Singh, A.; Tomar, P. K. (2012). Assessment of water quality values in Porur Lake Chennai, HussainSagar Hyderabad and Vihar Lake Mumbai, India. Chem. Sci. Trans., 1: 508-515.
- Chapman, D. (1996). Water Quality Assessments. A guide to use biota, sediments and water in environmental monitoring, Second Edition. University Press, Cambridge.
- Chapman, D. and V. Kimstach, (1996). Selection of Water Quality Variables. Water Quality Assessments: A Guide to the use of Biota, Sediments and Water in Environmental Monitoring. Chapman edition, 2ndEdn. E & FN Spon, London, pp: 595.
- Chen, J., Huang, Q.W., Lin, Y.L., Fang, Y., Qian, H., Liu, R.P., Ma, H.Y. (2019). Hydrogeochemical characteristics and quality assessment of groundwater in an irrigated region, Northwest China. Water, 11(96), 13 -25.
- Chitsazan, M., Dorraninejad, M. S., Zarasvandi, A. and Maizaii, S. Y. (2011) Occurrence, distribution and sources of heavy metals in deep groundwater wells in Maydavood area, southwestern Iran. Environmental Geology, 58, 727-737.
- Chris, W.P. (2012). Water Quality: Alkalinity and Hardness. University of Florida.
- Christiansen, C.M., Riis, C., Christensen, S.B., Broholm, M.M., Christensen, A.G., Klint, K.E.S., Wood, J.S.A., Bauer-Gottwein, P., Bjerg, P.L., (2008). Characterization and quantification of pneumatic fracturing effects at a clay till site. Environmental Science & Technology.42 (2), 570– 576).
- Clampham, W. B. Jr. (1973). A natural Ecosystem. Macmillan Publishing Co. Inc. New York. pp. 42-235.
- Clark, M.A. and Barret, E.L. (June 1987). The pHs gene and Hydrogen Sulphide Production of Salmonella typhimurium. Journal of Bacteriology 169 (6) 2391-2397
- Cooper, W. C. and Gaftey, W. R. (1975). Mortality of lead workers. Journal of occupational medicine, 17:100-107.
- Davis, A and Ashenberg, D. (1989). The aqueous geochemistry of the Berkeley Pit, Butte, Montana, U.S.A Appl. Geochem Vol. (4) 23-36.
- Davis, S. N. and Dewest, R. J. M. (1966). Hydrology. John Wiley and Sons, Inc. London.
- Dennis, N. (2002). Natural Variations in the Composition of Groundwater. Groundwater Foundation, Springfield Oregon
- Dinius, S.H. (2007). Desidn of an index of water quality. Water Resources Bulletin, 23(5): 833-843.
- Drever, J.I., (1982). The Geochemistry of Natural Waters. Prentice-Hall, Inc., Englewood
- Duffus, J. H. (1980) Resource and Environmental Science Series EwardAmold Publication Ltd, London, England. Environmental toxicology. 164pp
- DWAF, (1996). White paper on National water policy. Pretoria, South Africa.
- EconomyWatch.com. (2015). The Economic Statistics management profile (ESM). URL:http://www.economywatch.com/economicstatistics/Sudan/Populatio Growth Rate/ accessed on 25th July 2015 at 12:07 pm.
- Edet, A., Nganje, T. N., Ukpong, A. J., Ekwere, A. S. (2011). Groundwater chemistry and quality of Nigeria: A status review. African Journal of Environmental Science and Technology, 5, 1152-1169.
- Edwards, D.D. (1980) Troubled water in Milwaukee. ASM News 59, 342–345
- Efe S.I., Ogban F.E., HorsfallM.Jnr., and Akporhonor E.E. (2005). Seasonal variations of physicochemical characteristics in water resources Quality in western Niger Delta Region Nigeria J. Appl. Sci. Environ. Mgt. 9(1): 191-195.
- Elinge, C. M., Itodo, A. U., Peni, I. J., Birnin-Yauri, U. A. and Mbongo, A. N. (2011). Assessment of heavy metals concentrations in borehole waters in Aliero Community of Kebbi State. Advances in Applied Science Research, 2, 279-282.
- Ellap, H. and Komur, A. (2007). Evaluation of water quality parameters for the Mamasin dam in Aksaray city in the Central Anatolian part of Turkey by means of artificial neural networks. Springer-verlag
- Emier, U, (1998). Curr.Opin.Struct.Biol. 8,749. In Nickel to the fore by Thauer, R.F. of the Max Planck Institute for Terrestrial Microbiology, D-35043 Marburg Germany. Science Vol.293, Aug 2001.wwwsciencemag.org.
- EPA (2000) Guidance for assessing chemical contaminant data for use in fish advisories, vol. 2, risk assessment and fish consumption limits 3rd ed. Washington DC, 150pp.
- EPA, US (1986). EPA Method: 130.2: Hardness, Total (mg/L as CaCO3) (Titrimetric, EDTA). Methods for the Chemical Analysis of Water and Wastes (MCAWW) (EPA/600/4-79/020).
- EPA, US (2012), Ground Water Rule (GWR). Water.epa.gov. Retrieved on 04/06/2012. 11:00 am
- Erah PO, Akujieze CN, Oteze GE (2002). A quality of ground water in Benin City: A baseline study on inorganic chemicals and microbial contaminants of health importance in boreholes and open wells. Trop. J. Pharm. Res. 1(2): 75-82.
- Fakayode, S.O. (2005). Impact Assessment of industrial Effluent on Water Quality of the Receiving Alaro River in Ibadan Nigeria. AjeanRagee 10:1-13
- FAO, (1995). Land and Water Development. Technical Paper Series, No. 1. Rome, Italy.
- FAO/WHO (1987) Joint FAO/WHO Expert Committee on Food Additive. Toxicological evaluation of certain food additives and contaminants. Cambridge. Cambridge University Press, 233-255 (WHO Food Additives Series, No 21).
- FEPA (1991). Guidelines and standards for environmental pollution in Nigeria
- Forstner, S.S.D., Ventura, M. and Hirata, R. (1983); Groundwater Pollution: An Executive Overview of the Latin America-Caribbean Situation in Relation to Potable Water Supply. Pan American Centre for Sanitary Engineering and Environmental Sciences, Lima.
- GESAMP (1974) Joint Group of Experts of the Scientific Aspects of Marine Pollution. Supplement of the Report of the Sixth session. Review of Harmful substances. United Nation and Educational Scientific and Cultural Organization. Paris 26 pp,
- Gleick Peter H. (1993). Water in Crisis. A guide to the World’s Fresh Water Resources. Pacific Institute for studies in Development, Environment and Security Stockholm Environment Institute.
- Goldewijk, K.K. (2000). Three Centuries of Global Population Growth: A Spatial referenced population Density. Database for 1700-2000. Environmental Assessment Agency (MNP), Bithoven, The Netherlands.
- Golterman, H. L; Clymo, R. S and Ohnstad, M. A. M. (1998). Methods for Physical and Chemical Analysis of Fresh water 2nd.Billing and Sons limited Great Britain, pp 125.
- Golterman, H.I. (1978); Methods for Physical and Chemical Analysis of Fresh Waters, Billing and Sons Ltd. U.S.A. 2nd Ed. P.25
- Gonzalez-Villalva, A, Fortoul. T. I., and Avila-Costa, M. R. (2006). Thrombocytosis induced in mice after subacute and sub-chronic V2O5 inhalation. Toxicol Ind. Health Apr. 22 (3):113-116.
- Grabow, W.O.K. (2000). The Safety of Water Disinfection Chem. and Microbe. Risks. Radisson Denville Resort, Miami Beach, Florida. USA, 15-17 November.
- Granick, J. L (1973) Studies of lead poisoning II. Correlation between the ratio of activated to inactivated delta-aminolevulinic acid dehydratase of whole blood and the blood lead level. Biochemical medicine, 8:149-159.
- Ground work (2002) http:///www.groundwork.org.za/chemical profiles.htm
- Gustafsson, J. (2003). The monitoring programme for the impacts of the road salting on groundwater.289, ISBN 952-11-1512-2.
- Hamil, L. and Bell, F.G. (1986). Ground water Resource Development. Butterworths 8, 255-275.
- Hammon, H. Ginzbury, I. Boulerh cha, M. (2011). Two relaxation-times Lattice Bottzmann Schemes for solute transport in unsaturated water flow, with a focus on stability, Advances in water Resources 34(2011) 779-793
- Hans, G, Seiler, H and Sigel, A. S (1987). Handbook on toxicity of inorganic compounds. Marcel Dekker, New York.
- Harlan, W.R. (1985) Blood lead and blood pressure. Relationship in the adolescent and adult US population. Journal of the American Medical Association, 253:530-534.
- Hem, J. D. (1989) Study and interpretation of the chemical characteristics of natural water, 3rd ed. U.S. Geological Survey water-supply paper 2253. Government Printing Office.
- Hillel, R. and Rabideau, A.J. (2000). Approximate analysis of the containment of contaminated sites prior to remediation, Water science and Technology, 42 (1-2), 319-324.
- Hodges, L. (1977). Environmental pollution, 2nd Ed, Holt Rinehart and Winston, New York.
- Homsby, A.G. (1999). How Contaminants reach groundwater. Soil and water science Department, University of Florida, Gainesville, 32611.
- Horton, R. K. (2005). An index number system for rating water quality. Journal of Water Pollution Control Federation.37(3): 300-306.
- Hutton, M. (1987); Human Health Concerns of Lead, Mercury and Arsenic, Hutchinson, E.C. and Meama, K. M., Eds. Lead, Mercury, Cadmium and Arsenic in the Environment; Wiley scope, 2nd Ed. Pp. 85-94.
- IARC (1980) Some metals and metallic compounds. Lyon, 325 (IARC Monographs on the Evaluation of Carcinogenic Risks to Humans, Vol. 23).
- IARC (1987) Overall evaluations of carcinogenicity: an updating of IARC Monographs volumes 1-42. Lyon, 139-142 (IARC Monographs on the Evaluation of Carcinogenic Risk to Humans, Suppl. 7).
- Ibiebele, D. D.; Powell, C. B; Isoun, M. and Selema, M. D. (1983). Establishment of baseline data for complete monitoring of petroleum related aquatic pollution in Nigeria. Proceedings of an international seminar on petroleum and the Nigeria environment pp.159-164.
- Ichwana I., Syahrul S., Wirda N., (2016). Water Quality Index by using National Sanitation Foundation Water- Water Quality Index (NSF-WQI) Method at KruengTamiang Aceh, International Conference on Technology, Innovation and Society (ICTIS).
- Ideriah, T. J. K. (2015). Assessment of groundwater Quality for Multipurpose Use in Parts of Andoni Rivers State. Indian Journal of Research,4(10): 34-41
- Jan, D. Gerry, G. and Michael W. (1993). Developing and managing Community water supplies, Wood Oxford Development Guidelines No. 8, UK.
- Jarup, L. (2003). Hazards of heavy metal contamination. British Medical Bulletin, 68, 167-182.
- Jeffrey, P. (2000). Perspectives on alternative water sources in Europe and Middle East, School of water Sciences, Crainfield University, Bedfordshire MK430AL UK
- Jerome, O. N. (1998). Vanadium content in Mt. Fuji groundwater and its relevance to the ancient biosphere by Tatsuo Hamada in Vanadium in Environment. Part I: Chemistry and Biochemistry. John Vilen and Sons Inc. pg. 97-123.
- John, D.E. and Rose J.B. (2005). Review of factors affecting microbial survival in ground water. Environ. Sci. Technol., 39: 7345-7356
- Kang, H. K.; Infante, P. R., and Carra, J. S. (1980). Occupational lead exposure and cancer. Science, 20 (1):935-936.
- Kapoor, A., Viraraghavan, T. (1997). Nitrate removal from drinking water review. J. Environ. Eng. 123 – 4.371–380.
- Kinniburg, D.G. and Edmunds, W.M. (1986). The susceptibility of UK ground waters.
- Kobayashi, K.; Himeno, S., and Satoh, M. (2006). Pentavalent vanadium induces hepatic metallothionein through interleukin-6-dependent and independent mechanisms. Toxicology.Dec.7; 228 (2-3):162-170.
- Koekemoer, R. (2009). Community Participation in the Planning of water Services delivery in rural Community in Limpopo Province a minor dissertation submitted in partial fulfillment of the requirements for the degree Master of Arts in Social Impact Assessment, Faculty of Humanities, University of Johannesburg.
- Krauskopf, K.B., and Bird, D.K. (1994). Introduction to Geochemistry, 3rd ed. McGraw-Hill, New York, 640p
- Krishnan, J. R. (2008). Investigation on Hydrobiology and Water Quality Parameters of Periyar Lake, Thekkady, Kerala (PhD Thesis), Mahatma Ghandi University, Kerala, India
- Kwakye-Nuako, G., Borketey, P.B., Mensah-Attipoe, I., Asmah, R.H., Ayeh-Kumi, P.F. (2007) Sachet Drinking Water in Accra: The Potential Threats of Transmission of Enteric Pathogenic Protozoan Organisms. Ghana Med J. 2007;41(2):62–7.
- Landrigan, P. J. (1989). Toxicity of lead at low doses. Br. J. Ind. Medicine, 46:593
- Lenn Tech (2009). Iron and water: reaction mechanisms, environmental impact and health effects. Retrieved from www.lenntech/ironandwater.html
- Leoni,V., Fabiani, L. and Ticchiarelli, L. (1985). Water hardness and cardiovascular mortality rate in Abruzzo, Italy. Archives of Environmental Health, 40, 274–278.
- Lester, M. L.; Horst, R. L and Thatcher, R. W. (1986). Protective effects of zinc and calcium against heavy metal impairment of children’s cognitive function. Nutrition and behavior, 3:145.
- Lloyd, J. A., and Heathcote, J. A. (1985) Natural inorganic hydrochemistry in relation to groundwater: An introduction. Oxford Uni. Press, New York.
- Longe, E. O. and Balogun, M. R. (2010). Groundwater quality assessment near a municipal landfill, Lagos, Nigeria. Research Journal of Applied Science, Engineering and Technology, 2(1), 39-44.
- Lopez, J. M and Lee, G. F. (1977). Water, Air and Soils Pollution Vol. (8) 373.
- Lu, X.X. (2004). Vulnerability of water discharge of large Chinese rivers to environmental changes: an overview Adv. Water ResourDoi:10.1007/s10113-004-0080-0
- Maine Geological Survey, MGS, (2012). Seasonal Variations.URL: http://maine.gov/doc. Retrieved 04:06:2012, 5:15pm
- Markovac, J. and Goldstein, G. W. (1988). Picomolar concentrations of lead stimulating brain protein kinase C. Nature, 334:71-73.
- Mason, A. (2001). Bicarbonates in groundwater. http://pub.usgs.gov/wri/wri024045/htms/report2.htm
- McDonald A. T and Kay D. (1986). Water Resources Issues and Strategies.
- McMichael, A. J. (1986). Port Pirie cohort study: environmental exposure to lead and children’s abilities at the age of four years. New England Journal of medicine, 319:468-475.
- McMichael, A. J. and Johnson, H. M. (1982). Long-term mortality profile of heavily-exposed lead smelter workers.Journal of occupational medicine, 24:375-378.
- Meride, Y. and Ayenew, B. (2016). Drinking water quality assessment and its effects on resident health in Wondo Genet campus, Ethiopia. Environmental Systems Research, 5, 1.
- Miranda- Rios, M. Luna-Pabello, V.M. Orta de Vela’squez, M.T. and Barrera-Godinez J.A. (2011). Removal of Escherichia coli from biological effluents using natural and artificial mineral aggregates. Mexico D.F.04510.
- Miroslav, R. and Vladimir, N.B. (1999). Practical environmental analysis. Royal Society of Chemistry, U.K.
- Mitchell B. (1990). Integrated Water Management. International Experiences and Perspectives. Publisher: New Delhi CBS PUB. Great Britain.
- Mochammad, S., Azizah, R., Sumantri, A., Shaharuddin, M. S., Zainul, A. Z. and Mohd, T. L. (2021). Analysis of heavy metals (cadmium, chromium, lead, manganese and zinc) in well water in East Java Province, Indonesia. Malaysian Journal of Medicine and Health Science, 17(2):146-153.
- Moore, M. R. (1988). Hematological effects of lead. Science of the total environment, 71:419-431
- National Groundwater Association (NGA) (2008). 601 Dempsey Road, Westerville, Ohio. 614-898-7791. http://www.H2O-ngwa.org/pubaff/bacq_a.html,
- Nigerian Standard for Drinking Water Quality (NSDWQ) (2015). Nigerian Industrial Standard, ICS
- Nriagu, J. O. (1979). Copper in the environment. Part 1: Ecological Cycling. Part 11: Health Effects. Wiley and Sons, Inc. New York.
- Obi C. N., Okocha C. O. (2007) Microbiological and Physicochemical of Selected Bore-hole Waters in World Bank Housing Estate, Umuahia, Abia State, Nigeria. J. Eng. Applied Sci. 2(5):920-929.
- OECD (Organization for Economic Co-operation and Development). (1975) Cadmium and the Environment. Toxicity, Economy, Control, Paris, 88pp.
- Okonkwo IO, Ogunjobi A A, Kolawale OO, Babatunde S, Oluwole I, Ogunnusi TA, Adejoyi OD, Fajobi EA (2009). Comparative Studies and Microbial Risk Assessment of a Water Samples Used for Processing Frozen Sea foods in Ijora- Olopa, Lagos State, Nigeria. EJEAF Che. 8(6): 408415.
- Olajire, A. A. and Imeppeoria, F. E. (2001). Water quality assessment of Osun River: Studies on inorganic nutrients. Environmental Monitoring and Assessment, 69, 17–28.
- Olobaniyi, S. B. and Owoyemi, F. B. (2006). Characterization by factor analysis of the chemical faces of groundwater in the deltaic plain sands aquifer of Warri, Western Niger Delta, Nigeria. African Journal of Science and Technology (AJST), Science and Engineering, 7(1), 73–81.
- Olowe O. A., Ojurongbe O, Opaleye O. O., Adedosu O. T., Oluwe R. A., Eniola K. I. T (2005) Bacteriological Quality of Water Samples in Osogbo Metropolis. Afr. J. Clin. Exper. Microbial. 6(3): 219-222.
- Otobo A. J. T. (1995). The ecology and fishery of the pygmy Herring Sierratherissa Leonensis in the Nun River and Taylor Creek of the Niger Delta. (PhD Thesis, University of Port Harcourt).
- Pallav, S. (2013). Potential health impacts of hard water. International Journal of Preventive Medicine, 4(8), 866–875.
- Parker, B.L., Chapman, S.W., Guilbeault, M.A. (2008). Plume persistence caused by back diffusion from thin clay layers in a sand aquifer following TCE source zone hydraulic isolation. Journal of Contaminant Hydrology. 102 (1–2), 86–104.
- Parsons, M. L and McElfresh, P.M. (1972) ″Comparison of Theoretical and Experimental Limits of Detection in Atomic Absorption Spectrometry using Air-acetylene and Nitrous Oxide-Acetylene flames. Appl. Spectroscopy, 26, 972.
- Patterson, J. W.; Minear, R. A., Gasca, E and Petropoulou, C. (1998).Industrial discharges of metals to water. In H. E. Allen, A. W. Garrison and G. W. Luther III (eds). Metals in surface Water. Ann Arbor Press, Chelsea Ml. pp.37-66.
- Piper, A. M. (1944). A graphic procedure in the geochemical interpretation of water analyses. American Geophysical Union Transactions. 25, 914 – 928.
- Progress on Sanitation and Drinking-water: 2010 Update. Publications of the World Health Organization can be obtained from WHO Press, World Health Organization, 20 Avenue Appia, 1211 Geneva 27, Switzerland
- Qin, X.S. and Xu, Y. (2011). Analyzing urban water supply through an acceptability-index-based interval approach
- Rajana A. (2010). Physicochemical Analysis of some Groundwater Samples of Kotputli Town Jaipur, Rajasthan India. Vol. 1, No.2, 111-113
- Ray, S.; Coffin, J.; Anthony M.; Maxwell V. O. (1977). Ecological effects of cadmium pollution in the aquatic environment. A review Fisheries and Marine Service Technical Report No. 734.Canadian Dept. of Fisheries and the Environment. Halifax, Nova Scotia, 18pp.
- Reimann, C., Bjorvatn, K., Frengstad, B., Melaku, Z., Teklehaimanot, R. and Siewers, U. (2003). Drinking water quality in the Ethiopian section of the East African rift valley: Data and health aspects. Science and Total Environmental Journal, 311, 65–80.
- Ress, N. B, Chou, B. J. and Renne, R. A. (2003). Carcinogenicity of inhaled vanadium pentoxide in F344/N rats and B6C3FI mice. Toxicol Science, Aug 74 (2) 287-296.
- Robert, L. P, Shields, L., Thomas, C .and McWilliams, I. G. (1968). Modern Methods of Chemical Analysis .2nd edition. John Willey and Sons. New York.
- Robins, R. G; Berg, R. B.; Dysinger, D. K.; Duaime, T. E; Metesh, J.; Diebold, F. E.; Twidwell, L. G.; Mitman, G. G.; Chatham, W. H., Huang, H. H., and Young, C. A. (1997). Chemical, physical and biological interactions at the Berkeley Pit. Butte, Montana. Tailings and Mine Waste 97. Bakeman, Rotterdam.
- Roger, B., Casidey, R., & Frey, R. (1998). Water Hardness: Inorganic reactions Experiments Department of Chemistry, Washington University, St. Louis.
- Rosenbom, A.E., Therrien, R., Refsgaard, J.C., Jensen,K.H., Ernstsen, V.,Klint, K.E.S. (2009). Numerical analysis of water and solute transport in variably-saturated fractured clayey till. Journal of Contaminant Hydrology. 104 (1–4), 137–152.
- Sanden P., Bergstrom S., and Gardelin, M. (1986). Modelling Groundwater Levels and Quality, SMHI, 601 76 Norrkoping.
- Scibior, A.; Zaporowska, H. and Ostrowski, J. (2006). Selected hematological and biochemical parameters of blood in rats after subchronic administration of vanadium and /or magnesium in drinking water. Arch Environ Contam Toxical Aug.51 (2):287-295.
- Shafique N.A., Fulk F., Autrey B.C., and Flotemersch, J. (2001). Hyperspectral Remote Sensing of water Quality parameters for large rivers in the Ohio River Basin.
- Siebert, S., Burke, J., Faures, J. M., Frenken, K., Hoogeveen, J., Döll, P., & Portmann, F. T. (2010). Groundwater use for irrigation – a global inventory. Hydrol. Earth Syst. Sci., 14(10), 1863–1880. https://doi.org/10.5194/hess-14-1863-2010
- Silliman, S. and Rodak, C. (2011). Probabilistic risk analysis and fault trees: Initial discussion of application to identification of risk at a wellhead. Adv. Water Resource. Vol. 21, No. 2, 229–237.
- Singh, B. (2011). Seasonal Variation of Coliforms and Nitrate in Groundwater Quality in Kanpur Metro. India. International Journal of Research in Chemistry and Environment Vol. 2 Issue 2 April 2012(207-209) ISSN 2248-9649
- Singh, S.; Mosley, L. M.; Victoria C.; Yacob B. (2012). Trace metal levels in drinking water on Viti Levu, Fiji Islands. South Pacific Journal of Natural Science.21 pp 31–34
- Sirila E.R., Maxwell, R.M., Nacarre-Sitchler, A.K. and McCray, J.E. (2010). A quantitative methodology to assess the risks to human health from carbon dioxide leakage into ground water. Adv water resource.
- Smith, D. G. (2005). A better water quality indexing system for rivers and streams. Water Research Journal.24(10): 1237-1244.
- Snyder, J. D., &Merson, M. H. (1982). The Magnitude of the Global Problem of Acute Diarrheal Disease: A Review of Active Surveillance Data. Bulletin of the World Health Organization. 1982; 60:605–13
- Soazo, M. and Garcia, G. B. (2007). Vanadium exposure through lactation produces behavioral alterations and CNS myelin deficit in neonatal rats. Neurotoxic Teratol July-Aug. 29 (4) 503-510.
- Spalding R.F., and Exner M.E. (1993). Occurrence of nitrate in groundwater a review. J. Environ. Qual. 22 3392–402.
- SPIDER International Ltd, (1995). Water Resources Atlas of the River Nile Basin, for the Canadian International Development Agency. Burundi, Egypt, Eritrea, Ethiopia, Kenya, Rwanda, Sudan, Tanzanian, Uganda and DRC.
- Stumm, W. and Morgan, J.J. (1996). Aquatic Chemistry, 3rd edition. Wiley-Inter-science, New York, 1022 pp.
- Suthra,. S. Bishnoi, P., Singh, S. Mutiyar, P. K., Nema, A.K. and Patil, N.S. (2009). Nitrate contamination in groundwater of some rural areas of Rajasthan, Department of Civil engineering, Indian Institute of Technology New Delhi India
- Talafre J. and Knabe F. (2009). United Nations World Water Assessment Programme Special Report, Climate Change and Water, an overview from the world water Development Report 3: Water in a changing World, UNESCO.
- Thompson, K. C and Reynolds, R. I. (1978). Atomic Absorption Fluorescence and Flame Emission Spectroscopy. A practical Approach, 2nd ed. Wiley, New York.
- Tukura, M. I., Ayinya, G., Ibrahim, I. G. and Onche, E. U. (2014). Assessment of heavy metals in groundwater from Nasarawa State, Middle Belt, Nigeria. American Chemical Science Journal, 4, 798-812.
- U.S.EPA (1986). Quality Criteria for water.PA 44015-86-601.Office of water, Regulations and Standards, Washington. DC.
- Udosen, E. D (1992) Aqua-terrestrial environmental pollution studies of inorganic substance from two industrial firms in Akwa Ibom state. PhD Thesis, Department of Chemistry, University of Calabar. p577.
- Udosen, E. D, Ibok, U. J. and Udoidiong, O. M. (1998). Heavy metals in fishes from some streams Ikot Ekpene Area of Nigeria. Journal of Tech. Research 1. pp. 61-68
- United Nations Environment Programme (2010). Clearing the water. A focus on water quality solutions. UNON, Publishing Services Section, Nairobi, United Nations Development Programme (UNDP). (2002). Statement by UNDP Administrator Mr. Mark Malloch Brown.
- United State Geological Survey (USGS), (2012). http://www.usgs.gov, 08/ 06/2012 11:45AM.)
- US EPA Risk Assessment Guidance for Superfund (RAGS) (2004). Human Health Evaluation Manual Vol. 1, [Internet]. Washington, D.C.: United States Environmental Protection Agency, Part E: Supplemental Guidance for Dermal Risk Assessment. Available from: https://www.epa.gov/risk/risk-assessment-guidance-superfund-rags-part-e.
- Van Der, G. (2012) Groundwater quality for drinking and irrigation purposes and potential health risks assessment: a case study from semiarid region of south India. Expo Health 11:109–123. https://doi.org/10.1007/s12403-018-0288-8
- Vanclooster, M. (2005). Effective approaches for modeling Groundwater load of surface applied chemicals, Department of environmental Sciences and Land use planning, Universite Catholique de Louvain Croix du sud 2, Belgium.
- Victor, E. A. and Fortune, A. A. (2020). Geostatical modelling of groundwater quality at Rumuola community, Port Harcourt, Nigeria. Asian journal of Environment and Ecology, 12(1), 37-47
- Vladimir, N. (2003). Water Quality, Diffuse pollution and watershed management. Second Edition. John Wiley and sons, Inc. Boston.
- Wanyioke, M., Ng’etich, J. K., Munyao, T., Lutta, S., Kiplagat, A. and Kundeyo, C. (2021). Potential use of Kilibwoni bubbling spring water, Nandi county, Kenya. Journal of Water Resources and Ocean Science, 10(4), 68-77
- Water Aid Annual Report (2008). Annual Report 2008/09
- Water and Sanitation Trust Fund (WSTF), (2009). Annual Report UN Water Habitat.
- Water Global Annual Assessment of Sanitation and Drinking- water (WGAASD) (2010).
- Weiwei, S., Dawen, Y., Heping, H. and Kenji, S. (2009). Water Resources Allocation Considering the water use flexible limit to water shortage: A case study in the Yellow River Basin of China. Water Resource Management (2009) 23:869-880
- WHO (1984). Guideline for drinking water quality Vol. 2. Health criteria and supporting information. World Health Organisation Geneva.pp.63-315.
- Wittmann E., P. Cote, Medici, C. Leech J. and Turner, A. G (1998). Treatment of hard borehole water containing low levels of Pesticide by Nano filtration. Desalination 119(1998) 347-352.
- World Health Organization (2000). Disinfectants and disinfectant by products. (Environmental health criteria 216). Geneva: world health organization
- World Health Organization (2005). Guidelines for Drinking-water Quality, World Health Organization, Geneva.
- World Health Organization (2006). In Water, Sanitation and Health World Health Organization.
- World Health Organization (WHO) (1996). Guidelines for Drinking-Water Quality – Second Edition – Volume 2 – Health Criteria and Other Supporting Information. WHO, Geneva, Switzerland.
- World Health Organization (WHO) (2011). Guidelines for Drinking-Water Quality. 4th Edition, World Health Organization, Geneva.
- World Health Organization (WHO), (1985). Guidelines for Drinking Water Quality. Vol. 1. World Health Organization. Geneva, p.129.
- World Health Organization (WHO), (1989). World Health Organization Guidelines for Drinking Water Quality. Vol. 1. World Health Organization. Geneva, p.129.
- World Health Organization (WHO), (2010). World health statistics: Health status indicators, World health, Health services – statistics, Mortality, Morbidity, Life expectancy, Demography Statistics. ISBN 978 92 4 156398 7 (NLM classification: WA 900.1). Publications of the World.
- Worle-Knirsch, J. M, Kern, K. and Scheleh, C. (2007). Nano particulate vanadium oxide potentiated vanadium toxicity in human lung cells. Environ Science Technol. Jan. 1, 41 (1): 331-336.
- Zemansky, G.M. (2000). Interpretation of Groundwater chemical quality data. Compass environmental, Inc., 3000W. 19th Court, Lawrence Kansas 66047-2300
- Zerner, B. (1991). Bioorg. Chem, 19, 116.In Nickel to the Fore by Thaur, R. F of the Max Planck Institute for Terrestrial Microbiology, D-35043 Marburg, Germany Science Vol 293 Aug. 2001.www.sciencemag.org.