
Computational Modelling of the Nigeria’s Daily Crude Oil Prices During the Russia – Ukraine War.
- Victor-Edema
- Uyodhu Amekauma
- 245-258
- Feb 20, 2024
- Education
Computational Modelling of the Nigeria’s Daily Crude Oil Prices During the Russia – Ukraine War.
Victor-Edema1, Uyodhu Amekauma2
Department of Mathematics/Statistics Ignatius Ajuru University of Education, Port Harcourt1,2
DOI: https://doi.org/10.51584/IJRIAS.2024.90123
Received: 30 December 2023; Revised: 12 January 2024; Accepted: 16 January 2024; Published: 20 February 2024
ABSTRACT
The study on the computational modelling of Nigeria’s crude oil prices during the Russia – Ukraine war was conducted to determine and select an appropriate model that best describes the functional behaviour of crude oil prices in Nigeria during the Russia – Ukraine war. The research data was the daily price of crude oil prices and the time under review collected from the Central Bank of Nigeria website, and spanned the period from February 24, 2022, to June 13, 2023. The total observations summed up to three hundred and eighteen days (318). Six models were estimated for the study namely; linear, quadratic, cubic, log-linear, linear-log, and log-log models. Nevertheless, the Log-linear Model, which had the values (S= 0.045; R2 = 67.6%; F = 660.29; p=.000), and the smallest accuracy measures (MAE = 0.030; MSE = 0.002; MAPE = 0.034), is adjudged as the best-fit model among the six built regression models. As a result, the Log-linear estimation has the most impact on the crude oil prices of Nigeria during the period of the Russia –Ukraine war under review. The study hereby recommends forecasting crude oil prices using the log-linear model.
KEYWORDS: Russia-Ukraine war, Crude oil price, least square, regression, linear, non-linear,
INTRODUCTION
On 24, February 2022, Ukraine was invaded by Russia after Russia announced a “special military operation” to demilitarize and de-nazify Ukraine. The invasion was due to the escalation of the war (Russo-Ukrainian) that started in 2014 and has also caused food shortages and increased the prices of crude oil and natural gas globally. Due to Russia’s position as the third-largest petroleum and liquid fuels producer globally, and also a major exporter of crude oil, the geopolitical risk associated with the further invasion of Ukraine by Russia has contributed to higher crude oil prices. The February 24, 2022, Russian invasion of Ukraine has led to other negative effects, the increase in the price of crude oil (Afolabi, 2022). This is as a result of Russia being one of the OPEC (Organization of Petroleum Exporting Countries) big weights. Though the major reason behind the invasion is political, its effect has cut across other works of human endeavours, especially the oil industry locally and abroad. This effect has not only affected Russia and Ukraine, but also other oil-producing countries like Nigeria as seen in the daily fluctuations of oil prices here in Nigeria (Azeez, 2022). It is against this backdrop that this study is carried out to estimate the functional model that best describes the behaviour of Nigeria’s crude oil prices during the Russia- Ukraine war. This research work aims to find the appropriate model to describe the behaviour of Nigeria’s crude oil prices during the Russia-Ukraine war. The objectives are to determine the pattern of the prices of Nigeria’s crude oil during the period under consideration, examine if the period of the war affected the crude oil prices of Nigeria, and select the appropriate model to describe the behaviour of Nigerian’s crude oil prices within Russia-Ukraine war period.
Finally, this research will serve as a resource material for students who will carry out similar research and in knowing how to analyze the data. It will help organizations in their weekly, monthly, and annual budgets for crude oil products like fuel, diesel, etc. It will also be a yardstick for making policies that will improve the daily production of crude oil. The research is limited to data on the price of crude oil collected from February 24, 2022, to June 13, 2023, and linear, quadratic, cubic, log-linear, linear-log, and log-log regression models.
LITERATURE REVIEW
Bagchi and Paul (2023) examined the effects of the steep surge in crude oil prices during the Russia-Ukraine war and observed structural breakpoints in the dataset for the entire price returns during the period under review. The study identified the most remarkable long-memory effects running from Brent crude oil prices to all the stock price returns.Zhang et al. (2024) studied the impact of the Russian-Ukraine war on crude oil prices and posited that the war increased the volatility of oil prices and significantly changed their trend. Back in Nigeria, the experience is not different. According to Afolabi (2022), the war and sanctions have led to sharp rises in the prices of crude oil to over $100 per barrel, far beyond the budget benchmark of $62 per barrel, on which the 2022 national budget of Nigeria is based. The prices of oil were reported to have fluctuated between $139 to $110 per barrel within the five weeks of the crisis (Azeez 2022).
Ibrahim et al. (2017), in their work, “the impact of oil prices shocks on the Nigerian Economy”, used the General Methods of Moment (GMM). Using data from 1981 to 2012, found out, after appropriate checks, that oil price shocks unimportantly delay economic growth while oil price itself significantly improves during it. An increase in oil prices benefits oil-exporting countries like Nigeria due to the significant positive effect oil prices have on economic growth. Ji and Guo’s (2015) studied the short-term impact of the Libya war to identify the period the war affected prices between 20 February 2011 and 2 May 2011. They created an index in which they used to know when public concern about the Libya war reached its height. Afterward, they found out that prices rose by 10% during these periods. Zhang et al. (2009), studied the Persian Gulf War and the Iraq War in 1991 and 2003 respectively, and found that oil prices were high during the war outbreak and then returned to their normal levels before the war outbreak, using the empirical mode decomposition based-event model, which involves breaking down the oil price time series into intrinsic mode functions with different time scales. Hendrix (2014), carried out tests on the conjecture in a sample of 153 countries within the period of 1947 – 2007. Afterward, he found strong evidence of a contingent effect of oil prices on interstate disputes, with an increase in oil prices associated with significant increases in dispute behaviour among oil-exporting states, while having either a negative or null effect on dispute behaviour in non-exporting states. Udoma et al. (2008), reveal that militancy, terrorism, and crude oil prices have a negative effect on Nigerian government revenues. He used the Autoregressive Distributed Lag (ARDL) model to examine the effect of global oil prices, militancy, and terrorism on government revenue. Antonio and Linus (2019) used an event study mode to find out the significance of the Ukraine war events. The findings obtained are; that the events that affected daily oil prices were scarce and occurred during specific phases of the conflict and West Texas info mediate price was more affected than Brent. Umar and Abdulhakeem (2018), opined that oil prices have been highly volatile since the end of World War II. The volatility has become even more serious in recent times. This has implications for the economics of oil export by countries, particularly oil-dependent countries like Nigeria. The paper examined the impact of these fluctuations on the macroeconomics of Nigeria. Using the VAR model, the impact of crude oil price changes on four key macroeconomic variables was examined. The results show that oil prices have a significant impact on real GDP, money supply, and unemployment. Its impact on the fourth variable; the consumer price index is not significant. This implies that three key macroeconomic variables in Nigeria are significantly explained by exogenous and highly volatile variables. Hence, the economy is vulnerable to external shocks. Consequently, the macroeconomic performance will be volatile, and macroeconomic management will become difficult. Diversification of the economy is necessary to minimize the consequences of external shocks.
Aderoju (2017), examined oil dependence and civil conflict in Nigeria focusing on the economic dynamics of resource-induced conflicts. It identifies two dimensions of oil-related civil conflict in the country. The first is the violent rent-seeking political violence that oil availability generates between the various ethno-regional groups; the second is the Niger Delta crisis. The former is linked to excessive government dependence on oil revenues, an institutionally unstable revenue allocation system, weak political institutional arrangements, lack of effective agencies of restraints to demand transparency and accountability on the part of political officeholders, failure to translate oil wealth to sustainable growth and increased standard of living or a larger majority of Nigerians, and a defective property right structure in relation to mineral resource endowment, violence in the Niger delta area Is attributed, in the main, too weak institutional arrangements manifesting in poorly-conceived laws, lack of enforcement, “regulatory capture”, and marriage of interest between the state and oil companies which often encourage the state to use repressive measures against host communities in cases of dispute. There are also the looting and secession incentives as well as the rent-seeking contest that oil availability and the allure of ownership creates among local participants. Three factors (educational attainment, income level, and asset possession) consistently explain the propensity to general violence among individuals in the region in the ordered and multinomial regressions on civil disobedience. The paper concludes with a discussion of some measures that may be used to break the “conflict trap” and overcome the corrupting influence of oil dependence in Nigeria.
Kabiru et al. (2022), carried out an analysis of the influence of crude oil prices on the standard of living in Nigeria by using additional variables as supporters, such as crude oil income, inflation, and exchange rates. According to data availability, the utilization data used in this study is the annual time series data from 1981 to 2019. The main findings are: there is a long-term equilibrium connection among the series, crude oil price has a negative impact on the standard of living, and crude oil revenue negatively affects the standard of living. They concluded that despite the abundance of oil in the country, its effects have affected the standard of living of Nigerians positively. Adenekan et al. (2020), examined the nexus among oil price, exchange rate, and stock market performance, using the VAR-based technique. The Johansen cointegration test revealed the absence of a long-run relationship among the variables. The Granger causality tests showed a unidirectional relationship running from crude oil price to shares and a bidirectional relationship between crude oil price and exchange rate. Shocks to the crude oil market had a positive impact on shares in the first two periods, but minimal beyond these periods. However, a one standard deviation innovation to the exchange rate had a negative impact on shares, implying that exchange rate instability may bring about uncertainty in the stock market. In most cases, each variable’s shocks are the major drivers of whatever movements are observed in the respective trends in the variable. Their findings show that the estimations using the vitality series also mimic the results from the return series. This implies that there are inherent structural or institutional rigidity in the transmission mechanism of oil price and exchange rate developments to the stock market.
Energy Information Administration (2020), claims that crude oil is created from the remains of algae and plankton in prehistoric times that fell into the seabed about 400 million years ago. They were mixed with mud and buried by layers of sediment. Crude oil is the main ingredient for creating various transportation fuel products such as petroleum, aircraft fuel, diesel, gasoline, and oil for heating and electricity generation. In addition, crude oil can produce products other than its main products, such as asphalt, paraffin, and lubricating oil(oil). Crude oil is also used for chemicals such as fertilizers, insecticides, soap, perfume, and vitamin capsules. Nigeria’s annual budget is usually based on higher crude oil prices. It leads to measures of spending cuts or additional financial sources to match the decline in revenues caused by unfavourable changes in crude oil prices on the world market (International Energy Agency, 2021). Nigeria is Africa’s largest crude oil-producing region, producing around 2 million barrels per day. In 2014 Nigeria output more than 1.9 million barrels of crude oil per day, thus ranking as the 11th largest oil producer in the world. This statement is supported by the fact that Nigeria could produce 2 million barrels per day in 2015 and 2019 (International Energy Agency, 2021). Meanwhile, crude oil contributes 10% of the country’s GDP. Crude oil accounts for about 57% of government revenue and more than 80% of total exports. It suggests that any increase in export earnings can significantly affect the economy. In it’s “Global Economic Prospects” statement released in 2020, the World Bank predicts Nigeria’s energy sector will experience a contraction of 10.6% by the end of 2020. This decline prompted the government’s budget to be reversed and passed by parliament on June 10, 2020. It brought the benchmark crude oil price from $57 per barrel to $25, while officials also approved an additional $5.5 billion in loans to help fund the new budget deficit (International Energy Agency, 2021). Tehranchian et al. (2017), posited that fluctuations in crude oil production prices in Nigeria since 2005 can be attributed partly to OPEC’s inability to set an acceptable benchmark and security problems connected to violent militant groups in the country, especially in crude oil exploration sites such as the Niger Delta region. Nigeria has the continent’s second-largest proven crude oil reserves.
According to EIA, the country’s security concerns and other commercial risks have slowed crude oil exploration operations. Nigeria’s state-owned National Petroleum Corporation (NNPC) regulates and grows the country’s oil and gas sector. NNPC primarily relies on multinational oil firms to fund its development and supply expertise. The country’s significant on-shore crude oil production operations are run as joint ventures between the NNPC and private oil companies, with the NNPC as the predominant owner. Production-sharing contracts are commonly used to organize expensive, sophisticated off-shore crude oil developments. It can change the conditions of these contracts to give overseas operators sufficient incentives. Chevron, Exxon Mobil, Shell, Total, and Eni are among the world’s top oil firms with operations in Nigeria. Therefore, the excessive power failure from the national grid has made production, manufacturing industries, and households depend more on petroleum products to produce goods and services. Furthermore, these have made its price movement a strong determinant of national living standards.
The fluctuation in crude oil prices is creating economic anxiety and panic among households in Nigeria. It is because the crude oil prices of petroleum products can negatively affect the standard of living. Sani et al. (2020), examined the impact of oil price shocks in Nigeria. A non-linear Autoregressive Distributed Lag (NARDL) approach was applied to quarterly data spanning 1991 Q1 to 2018 Q4. Results from their analysis showed that oil price increases led to an increase in headline, core, and food measures of inflation in Nigeria. However, a decline in oil price resulted in a decline in the marginal cost of production and culminated in moderation of domestic inflation. Conflitti and Luciani (2017), state that oil price hikes may have an inflationary effect in four ways – an increase in production costs, higher inflation expectations, demand for higher wages by workers to compensate for the increase in energy prices, and an adverse supply shock if real wages do not decrease sufficiently, thus triggering an employment adjustment. However, it can have a deflationary effect through a demand shock as higher oil prices tend to reduce net disposable income, hence consumption and investment. Zivkov et al. (2019), also found that the pass-through of oil prices to inflation was relatively slow in eleven Central and Eastern European countries (the Czech Republic, Poland, Hungary, Slovakia, Lithuania, Latvia, Estonia, Bulgaria, Slovenia, and Croatia) during the 1996 – 2018 period. An increase in oil price by 100 percent was followed by a rise in inflation of 1 – 6 percentage ratios tended to have the highest and most consistent pass-through effects in the analysis. Choi et al. (2018), showed that a 10 percent increase in global oil inflation, would, on average, increase domestic inflation by about 0.4 percentage points, with the effect vanishing after two years. They revealed that the effect is asymmetric, with positive oil price shocks having a larger impact on inflation than negative ones. Viktor (2018), examined the relationships between oil shocks and consumption for the small democratic economy of Norway. His choice of selecting an oil-exporting country was somewhat unique since many of the world economies are oil-importers and the research made up until now is focusing on these economies. He ended up analyzing the short-run effects of oil shocks on households’ consumption by using a Vector Autoregressive Model, Granger-causality test, and an Impulse response function. The results suggested that there is a granger causality between oil shocks and consumption. Also, for Norway, he found out that shock due to increased crude oil prices has a positive effect on household consumption.
This research work emphasized the use of the Least Square Method (LSM) method of solving regression analysis to build a non-linear model for the price of crude oil during the Russia – Ukraine war and see the model that best describes the data.
MATERIALS & METHOD
Nature and Source of Data
The research data is the daily crude oil price in Nigeria from February 24, 2022, to June 13, 2023. The data was collected from the day Russia invaded Ukraine, that is, February 24, 2022. The research data was sourced from the statistical bulletin of the Central Bank of Nigeria. The data have two variables: Y(t) which is the price of crude oil and t the period(time).
Model Estimation
The functional model of daily crude oil prices of Nigeria during the Russia-Ukraine War (RUW) is the Least Square Method (LSM). Therefore, regression models were applied to measure the functional model of daily crude oil prices in Nigeria. The model comprises of six (6) models, namely: linear model, quadratic model, cubic model, log-linear model, linear-log model and log-log model. For models with log transformations, the price Y(t) was transformed or the time, t as the case may be.
In order to establish the functional model of daily crude oil prices of Nigeria during the Russia-Ukraine war, the least square method was applied through regression models. The LSM models below have the following variables; which is the daily price of crude oil and , the period (time). The models are as follows;
Linear model (Model A) as seen in Esemokumo and Victor-Edema (2021) is
![]()
has a dependent variable that is a continuous variable, while the independent variable can take any form (continuous, discrete, or indicator variable)
Quadratic model (Model B)
![]()
With this model, the effect of the independent variable (t) is allowed on the dependent variable to change. As the value of the t increases, the impact of the dependent variable increases or decreases.
Log-Log model (Model C)
![]()
In this model, both the dependent and independent variables are transformed by the natural logarithm. In order to use the model, both y and t must be greater than zero, because the logarithm is defined only for positive numbers. The parameter β2 is the elasticity of y with respect to t.
Log- linear model (Model D)
![]()
In this model, only the dependent variable is transformed by the logarithm. The dependent variable must be greater than zero to use this form. A one-unit increase in t leads to (approximately) a 100 x β2% change in Y.
Models B, C, and D are as seen in Onu and Victor-Edema (2021).
Linear – log model (Model E) as seen in Jeroen (2015)
![]()
In this model, the variable t is transformed by the natural logarithm. This, we can say that a 1% increase in t leads to a β2/100 unit change in Y.
Cubic model (Model F) as seen in Amir et al. (2012).
![]()
This model uses a cubic function to model real-world situations. They can be used to model three-dimensional objects to allow you to identify a missing dimension or explore the result of changes.
Assumptions of the simple linear regression model
- The value of
 for each value of , is
- The average value of the random error e is E(e) = 0 since we assume that

- The variance of the random error

- The covariance between any pair of random errors,

- The variable is not random and must take at least two different values
Least Squares Estimation
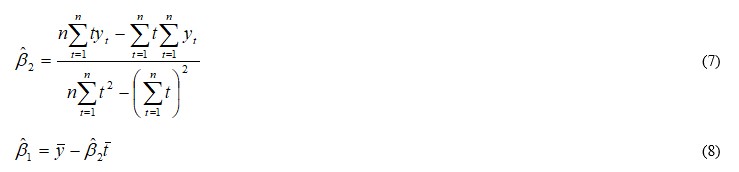
If ![]() are the least squares estimates, then
are the least squares estimates, then
![]()
![]()
The Normal Equations
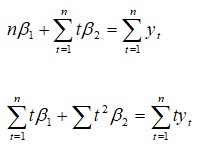
Least Squares Estimators
Time Plot
The time series plot, is a data visualization tool that illustrates data points at successive intervals of time. Each point on the chart corresponds to both a time and quantity that is being measured.
Generally, the horizontal axis of the chart or graph is used to plot increments of time and the vertical axis pinpoints values of the variable that is being measured. When values are connected in chronological order by a straight line that creates a series of peaks and valleys. The steps involved in interpreting a time series plot include: determining the minimum and maximum of the plot, determining if the data is consistent over time or changing from period to period, and summarizing the information, to include minimum, maximum, trends, and outliers.
Test of Normality
The normality of the data will be tested using the Jarque-Bera test.
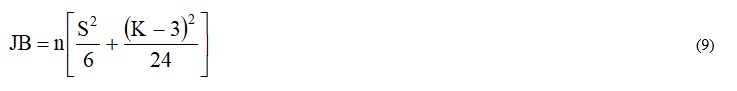
where, n= sample size, S = Skewness coefficient, and K= Kurtosis coefficient. For a normally distributed variable, S=0 and K= 3, therefore, the Jarque-Bera test of normality is a test of joint hypothesis that S and K are 0 and 3 respectively. This means that the value of the Jarque-Bera statistic is expected to be zero (0) under the null hypothesis that the residuals are normally distributed. The Jarque-Bera statistic stated above follows the chi-square distribution with two (2) degrees of freedom. If the computed P-value of the Jarque-Bera statistic in an application is sufficiently low, which will happen if the value of the statistic varies different, from 0, they can reject the hypothesis that the residuals are normally distributed. But, if P-value is reasonably high, which will happen if the value of the statistic is close to zero (0), we do not reject the normality assumption (Gujarati & Porter, 2009).
Unit Root Test
The stationarity of the functional model of daily crude oil prices of Nigeria during Russia–Ukraine was tested using the Kwaitkowski-Phillips-Schmidt-Shin (KPSS) test. KPSS test figures out if a time series is stationary around a mean or linear trend, or is a non-stationary due to unit root, (Kwaitkowski et al. 1992). A stationary time series is one where statistical properties like mean and variance are constant over time. The test is based on a linear regression. It breaks up a series into parts: a deterministic trend![]() , a random walk
, a random walk![]() , and a stationary error
, and a stationary error![]() , with the regression equation:
, with the regression equation:
![]()
Test of Significance
It has become a standard practice to report the outcome of a statistical hypothesis using the P-value. The P-value of a test can be determined by comparing the P-value to the chosen level of significance. P-value Rule: Reject the null hypothesis when the P-value is less than or equal to the level of significance that is, if P ≤ reject Ho, if P >, then, do not reject (Hill et al. 2012).
Coefficient of Determination R2
This is a number between 0 and 1 that measures how well a statistical model predicts an outcome if is given as; R2 = (R)2, whereR2, is the coefficient of determination and (R)2is the correlation coefficient.
MODEL SELECTION
Mean Square Error
The best model was selected with the minimum Mean Squared Error (MSE) value from the evaluated models.
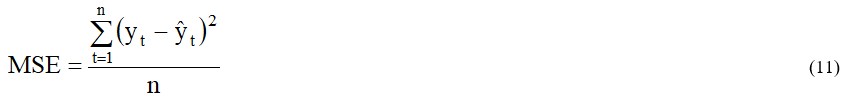
![]() is the observed value
is the observed value
![]() is the corresponding predicted value
is the corresponding predicted value
n= the number of observations.
RESULTS AND DISCUSSION
Test of Normality
The normality of the data was tested using the Jarque-Bera test, Doornik-Hansen test, and Shapiro-Wilk W.
Table I: Test for Normality
| Variable | Jarque-Bera Test | Doornik-Hansen Test | Shapiro-Wilk W. | Lilliefors Test | ||||
| Parameter | P | Parameter | p | Parameter | p | Parameter | p | |
| Yt | 5.91247 | 0.0420 | 8.23826 | 0.0163 | 0.9436 | 1.17e-009 | 0.1165 | 0.000 |
| T | 19.0808 | 7.19e-005 | 32.6766 | 8.02e-008 | 0.9547 | 2.38e-008 | 0.0584 | 0.010 |
| Log(Yt) | 345.191 | 1.10e-075 | 102.495 | 5.54e-023 | 0.9180 | 3.56e-012 | 0.0878 | 0.000 |
| Log(t) | 329.523 | 2.77e-072 | 243.321 | 1.46e-053 | 0.8332 | 7.59e-018 | 0.1534 | 0.000 |
Table I showed that the both the actual and log transformed data sets are normally distributed with their respective p-values greater than .05. This implies that the data are significant at 5% alpha level.
Time Plot
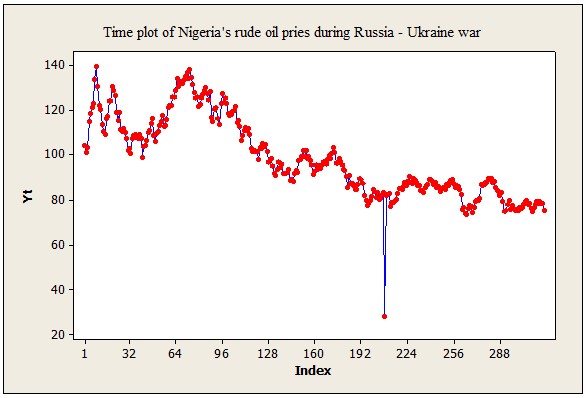
Figure 1: Time plot of Nigeria’s crude oil prices during Russia – Ukraine war (February 24,2022 – June 13, 2023).
The plot of Nigeria’s crude oil prices covering the period under observation: February 24, 2022 – June 13, 2023 is shown in Figure 4.1. The price ranges from $28.11 to $139.41. The overall trend was downwards, with natural fluctuations occurring during the time period. As the stock price at $28.11 was abnormally low, the value should be further investigated to determine if the price at that day is an outlier.
Unit Root Test
The unit root test of the data was tested using the KPSS test.
Table II: KPSS Test on the Actual and Transformed Data
| Variable Statistics | Test Statistic (without trend) | P-Value | Stationary |
| Price (Yt) | 4.32494 | 0.0000 | No |
| Time (t) | 5.39909 | 0.0000 | No |
| First difference of Yt | 0.05314 | 1.0000 | Yes |
| First difference of Ln(Yt) | 0.03517 | 1.0000 | Yes |
| Second difference of Ln(t) | 0.09527 | 0.923 | Yes |
Sources: Author’s Work (2022)
10% 5% 1%
Critical values: 0.348 0.462 0.741
Table 3 shows that the series were all stationary at 5% level of significance after first and second difference.
Estimation of the Parameters of the Regression Models
Table III: Estimation of the Linear Model
| Model (A) | Parameter | R2(%) | F | P | Remark |
| 124.1 | 71.2 | 781.26 | 0.000** | Significant | |
| -0.1614 |
Footnote: **= Significant at p< 0.05
The required estimated linear model is
![]()
For the linear relationship between time and price of crude oil, table 4 summarized parameter estimates, F-value, p-value, and coefficient of determination of the Durbin method, accordingly. Similarly, the findings of the acquired parameters revealed that there is a linear significant relationship between time and price at 5% alpha level.
Table IV: Estimation of the Quadratic Model
| Model (B) | Parameter | F | P | Remark |
| 125.2 | 390.95 | 0.000** | Significant | |
| -0.1826 | ||||
| -0.000067 |
Footnote: **= Significant at p< 0.05
The estimated quadratic model is
![]()
For the quadratic relationship between time and price of crude oil, table 5 summarized parameter estimates, F-value, p-value, and coefficient of determination of the Durbin method, accordingly. Similarly, the findings of the acquired parameters revealed that there is a significant quadratic behavioural relationship between time and price of crude oil at 5% alpha level.
Table V: Estimation of the Cubic Model
| Model (C) | Parameter | F | P | Remark |
| 114.3 | 342.07 | 0.000** | Significant | |
| 0.2237 | ||||
| -0.003113 | ||||
| 0.000007 |
Footnote: **= Significant at p< 0.05
The required estimated cubic model is
![]()
For the cubic relationship between time and price of crude oil, table 6 summarized parameter estimates, F-value, p-value, and coefficient of determination of the Durbin method, accordingly. Similarly, the findings of the acquired parameters revealed that there is a significant cubic behavioural relationship between time and price of crude oil at 5% alpha level.
Table VI: Estimation of the Log-Log Model
| Model (D) | Parameter | F | P | Remark |
| 2.252 | 264.89 | 0.000** | Significant | |
| -0.1283 |
Footnote: **= Significant at p< 0.05
The required estimated Log=Log model is
![]()
For the log-log relationship between time and price of crude oil, table 7 summarized parameter estimates, F-value, p-value, and coefficient of determination of the Durbin method, accordingly. Similarly, the findings of the acquired parameters revealed that there is a significant log-log transformed behavioural relationship between time and the price of crude oil at a 5% alpha level.
Table VII: Estimation of the Log-Linear Model
| Model (E) | Parameter | F | P | Remark |
| 2.099 | 660.29 | 0.000** | Significant | |
| -0.000713 |
Footnote: **= Significant at p< 0.05
The estimated Log-Linear model is
![]()
For the log-linear relationship between time and price of crude oil, table 8 summarized parameter estimates, F-value, p-value, and coefficient of determination of the Durbin method, accordingly. Similarly, the findings of the acquired parameters revealed that there is a significant log-linear transformed behavioural relationship between time and price of crude oil at 5% alpha level.
Table VIII: Estimation of the Linear-Log Model
| Model (F) | Parameter | F | P | Remark |
| 158.9 | 298.74 | 0.000** | Significant | |
| – 29.19 |
Footnote: **= Significant at p< 0.05
The estimated Linear-Log model is
![]()
For the linear-log relationship between time and price of crude oil, table 9 summarized parameter estimates, F-value, p-value, and coefficient of determination of the Durbin method, accordingly. Similarly, the findings of the acquired parameters revealed that there is a significant linear-log transformed behavioural relationship between time and price of crude oil at 5% alpha level.
Comparison of the Six Identified Regression Models
Table IX: Regression Analysis Summary of the Parameter Estimates
|
MODELS |
PARAMETER ESTIMATES | ||||||||||
| MAE | MSE | MAPE | R2 | S | F | P | |||||
| Model (A) | 124.1 | -0.1614 | 6.968 | 88.776 | 7.345 | 71.2% | 9.452 | 781.26 | 0.000 | ||
| Model (B) | 125.2 | -0.1826 | 0.000067 | 6.903 | 88.523 | 7.241 | 71.3% | 9.453 | 390.95 | 0.000 | |
| Model (C) | 114.3 | 0.2237 | –0.0031 | 0.000007 | 6.682 | 72.222 | 7.141 | 76.6% | 8.552 | 342.07 | 0.000 |
| Model (D) | 2.252 | -0.1283 | 0.040 | 0.004 | 0.044 | 45.6% | 0.059 | 264.89 | 0.000 | ||
| Model (E) | 2.099 | -0.0007 | 0.030 | 0.002 | 0.034 | 67.6% | 0.045 | 660.29 | 0.000 | ||
| Model (F) | 158.9 | – 29.19 | 8.990 | 158.458 | 9.324 | 48.6% | 12.628 | 298.74 | 0.000 | ||
Footnote: **= Significant at p< 0.0
Table IX displayed the six identified regression models along with their parameter estimates, model selection criteria, and model accuracy measures.
DISCUSSION
Nigeria’s crude oil prices during the period under review show a downward pattern with a minimum daily price of $28.11 and a maximum daily price of $139.41. The period of the war significantly affected the price of Nigeria’s crude oil for the six models namely; linear, quadratic, cubic, log-log linear, log-linear, and linear-log, used in the study. The Log-linear Model (E), which has the lowest S value (S= 0.045; R2 = 67.6%; F = 660.29; p<.05), the smallest accuracy measures (MAE = 0.030; MSE = 0.002; MAPE = 0.034), is adjudged as the “best” fit model among the six built regression models. As a result, model (E) which is the Log-linear estimation is the best, as it has the most impact on the crude oil prices of Nigeria during the period of the Russia –Ukraine war. It seems reasonable to conclude that the best model to use for forecasting the average daily price of crude oil in Nigeria during the Russia – Ukraine war is the Log-linear model. This finding agrees with the submissions of Kabiru et al. (2022) and Sani et al. (2020) that crude oil prices during the Russia-Ukraine war impacted the Nigerian economy.
CONCLUSION
The six identified regression models for the price of crude oil in Nigeria during the Russia –Ukraine war were compared to determine the best-fit model that had more effect on the crude oil prices of Nigeria during the period of the war as shown in Table IX above. A summary analysis of parameter estimates, MAE, MSE, MAPE, p-values, S, R2, and F-values for the models is also shown in Table IX for linear model (A), quadratic model (B), cubic model (C), log-log linear model (D), log-linear (E), and linear-log (F). It is noteworthy to state that all of the model parameters’ estimations were significant at 5%, which appears not to be skewed. The Log-linear Model (E), which had the lowest S value, and the smallest accuracy measures, hence is adjudged as the “best” fit model among the six built regression models. As a result, model (E) which is the Log-linear estimation is the best, as it has the most impact on the crude oil prices of Nigeria during the period of the Russia –Ukraine war. Finally, the study recommends that more work should be done by fitting exponential trend on the research data and also by using other transformations like power transformation, inverse power transformation, square root transformation, inverse square root transformation, etc. to get a detailed behavioural pattern of the research data.
CONTRIBUTION TO SCHOLARSHIP
This work was able to identify that the Log-linear estimation is the best, as it has the most impact on the crude oil prices of Nigeria during the period of the Russia –Ukraine war.
REFERENCES
- Adenekan, A. T., Hilili, M. J. & Okereke A. N. (2020). Oil price, exchange rate and stock market. Central Bank of Nigeria Economic and Financial Review, 58(4), 63.
- Aderoju O. (2017). Oil-dependence and civil conflict in Nigeria. PhD dissertation carried out in the Department of Economics and Statistics, University of Benin.
- Afolabi, A. (2022) How will the Russian-Ukraine crisis impact Nigeria’s financial market? Stears Business February https://www.stearsng.com/premium/article/how-will-the-russia-ukraine-crisis-impact-nigerias-financial-markets
- Amir, F., Pooya, M. & Rahim, F. (2012). A simple method to solve quartic equation. Australian Journal of Basic and Applied Sciences, 6(6):331-336.
- Antonio, J. Gbrook. G. & Linus, A. H. R. (2019). External effects of the war in Ukraine: The impact on the price of oil in the short-term. International Journal of Energy Economics and Policy, 9(2), 267-276.
- Azeez, W. (2022) CPPE: How Russia’s invasion of Ukraine will affect Nigerian economy. The Cable, March 1 https://www.thecable.ng/cppe-how-russias-invasion-of-ukraine-will-affect-nigerian-economy\\
- Central Bank of Nigeria (2023). https://www.cbn.gov.ng/rates/crudeoil.asp
- Choi, S., Furceri, D., Loungani, O., Mishra, S. & Poplawski-Ribeiro, M. (2018). Oil prices and inflation dynamics: evidence from advanced and developing economies. Journal of International Money and Finance, 82(3), 71-96.
- Conflitti, C. & Luciani, M. (2017). Oil price pass-through into core inflation. Bank of Italy.
- Doornik, J. A., & Hansen, H. (2008). An Omnibus Test for Univariate and Multivariate Normality. Oxford Bulletin of Economics and Statistics, 70, 927-939. https://doi.org/10.1111/j.1468-0084.2008.00537.x
- Energy Information Administration (2020). Crude oil prices rise above $100 per barrel after Russia’s further invasion into Ukraine.
- Esemokumo, P. A. & Victor-Edema, U. A. (2021). Effect of outliers in simple linear regression data. International Journal of Statistics and Applied Mathematics, 6(6):68-74.
- Hendrix, C. S. (2014). Oil prices and interstate conflict behavior. 1750 Massachusetts. www.piie.com.
- Ibrahim A., Ayodele A., Hakeem M. & Adeniran, Y. A. (2017). Oil price shocks and Nigerianeconomic growth. European Scientific Journal, 10(19), 120-156.
- International Energy Agency (2021). Oil market reports, February to March. Retrieved from https://www.iea.org/reports/oil-market-report-march-2021
- Jeroen, K. V. (2005). Log-linear models. Encyclopedia of Statistics in Behavioural Science. DOI: 10.1002/0470013192.bsa352.
- Ji, Q. & Guo, J. F. (2015), Oil price volatility and oil-related events: an internet concern study perspective. Applied Energy, 137, 256-264.
- Kabiru, S. M, Tahir, H. M, & Yahaya, Y. (2022). Crude oil price and standard of living nexus: evidence from Nigeria. Journal of Developing Economies, 7(2), 228-250.
- Kwaitkowski, D., Phillips, P. C. B., Schmidt, P. & Shin, Y. (1992). “Testing the null hypothesis of stationarity against the alternative of a unit root”.Journal of Econometrics. 54, 159-178. doi:10.1016/0304-4076(92)90104-Y
- Onu, O. H. & Victor-Edema, U. A. (2021). Selecting the right model for analyzing GDP growth on some selected petroleum products and its total consumption in Nigeria, a case study of NNPC Port Harcourt. International Journal of Mathematics and Educational Review, (IJMER), 3(1):39-43
- Sani, B., Ismaila, S. A, Danlami, T., Sani, I. B. & Yusuf, J. (2020). Asymmetric impact of oil price on inflation in Nigeria. CBN Journal of Applied Statistics, 11(2), 85-113.
- Shapiro, S. S., & Wilk, M. B.. (1965). An analysis of variance test for normality (complete samples). Biometrika, 52(3–4), 591–611. https://doi.org/10.1093/biomet/52.3-4.591
- Tehranchian, A. M. & Seyyedkolaee, M. A. (2017). The impact of oil price volatility on the economic growth in Iran:an application of a threshold regression model. International Journal of Energy Economics and Policy, 7(4), 165-171.
- Udoma J. A., Augustine U. & Ukemenam A. I. (2018). Oil prices, armed conflict and government revenue in Nigeria. International Journal of Emerging Markets, 13(5), 1196-1210.
- Umar G. & Abdulhakeem, A. K. (2018). Oil price shocks and the Nigeria economy: a variance autoregressive model. International Journal of Business Management, 5(8), 26.
- Viktor, B. (2018). The impact of oil price shock on household consumption, a case study of Norway. Master thesis 1, 165 ECTS. Master program on Economics.
- Zhang, X., Yu, L., Wang, S. & Lai, K.K. (2009). Estimating the impact of extreme events on crude oil price: An EMD-based event analysis method. Energy Economics, 31(5), 768-778.
- Zivkov, D., Duraskovic, J., & Manic, S. (2019). How do oil price changes affect inflation in Central and Eastern European Countries? A wabelet-based Markov switching approach. Journal of Economics,19(1), 84-104
- Zhang, Q., Hu, Y., Jiao, J. & Wang, S. (2024). The impact of Russia-Ukraine war on crude oil prices: an EMC framework. Humanities and Social Sciences Communications. https://doi.org/10.1057/s41599-023-02526-9.