
Determination of Variation in Current Energy and Sediment Dispersal Patterns Using Grain Size Statistical Parameters in Ajali Sandstone
- Edirin AKPOFURE
- Lisa Erebi JONATHAN
- 249-260
- Mar 6, 2025
- Geology
Determination of Variation in Current Energy and Sediment Dispersal Patterns Using Grain Size Statistical Parameters in Ajali Sandstone
Edirin AKPOFURE*, Lisa Erebi JONATHAN
Department of Geology, Niger Delta University, Wilberforce Island, Bayelsa State, Nigeria
*Corresponding Author
DOI: https://doi.org/10.51584/IJRIAS.2025.10020021
Received: 28 January 2025; Accepted: 05 February 2025; Published: 06 March 2025
ABSTRACT
Grain size statistical parameters derived from Ajali Sandstone outcropping in Ayogwiri, Fugar and Orame in the Western Anambra Basin were used to determine the variation in current energy and sediment dispersal pattern. The sandstone was logged in the three locations: Ayogwiri, Fugar and Orame, and samples collected for grain size analysis. Statiscal parameters such as the mean, sorting and skewness were derived to enable the study. The average mean value for Ayogwiri is 4.29 (coarse silt), Fugar has an average of 3.63 (very fine sand) and Orame with an average of 3.78 (very fine sand). The variation of the mean grain size shows a decline in grain size from Orame, through Fugar towards Ayogwiri, giving a NE – SW trend. The current energy was high enough to sort the sediments, despite the intermittent waning of the current. The sorting values range from moderately well sorted to moderately sorted with few samples that are poorly sorted and only one that is very poorly sorted.. The average sorting value at Ayogwiri is 0.94 (moderately sorted), Fugar is 0.98 (moderately sorted) and Orame is 0.91 (moderately sorted). Skewness reflects the sorting and energy of deposition. The skewness of the studied samples range from negatively skewed to very negatively skewed (indicating coarseness) with just one exception: that is, AY6 from the mud drape overlying the heterolithic Bed B in Ayogwiri, which is positively (fine) skewed. Grains in Orame are coarser, more negatively skewed than those in the other two locations, which implies decline in grain size from Orame through Fugar to Ayogwiri giving a NE – SW trend decline of grain size and invariably decline in depositional current energy in the same direction. The good sorting and coarseness of the Ajali Sandstone has highly favoured its exploitation in the construction and allied industries.
Keywords: Statistical Parameters, Grain Size, Sediment Dispersal, Current Energy, Sorting
INTRODUCTION
Palaeocurrent analysis is the aspect of sedimentology that involves the determination of the direction of current and transport that deposited sediments in the sedimentary rocks. The analysis can be studied by looking at small individual bedforms or on a regional basin analysis. As a result, information on the palaeoslopes, sediment dispersal pattern, direction of provenance and the relationship of the direction of current to lithesome is gathered [1]. Traditionally, directional fabrics or structures within the rock enable this study as they convey the line of flow of current. Examples of such structures are cross stratification, imbrication, tool and groove marks, etc.
According to [2], the grain size of clastic sediments is a very important textural attribute of rock which deals with the microgeometry of the rock. Statistical parameters derived from sediment grain size distribution help in the understanding of hydrodynamic (primary depositional), diagenetic (post depositional) and biogenic (produced by organism) fabrics produced in a rock. Most of these fabrics indicate the transport system and depositional environment. The competence and efficiency of current energy can also be accounted for by studying grain size distribution and sorting of sediments. Coarser sediments are transported by higher energy and get deposited as the energy wanes. The size distribution also serves as guide to the nearness to provenance in a water regime – as coarser sediments are closer to the source, while, finer grains are father away. This invariably gives clues to distance and direction travelled.
It’s been observed by several researchers that progressive decrease of clast size occur downcurrent. This decrease may be related to several factors such as: stream gradient and competence, the mean discharge of stream and the stability of clast material. However, downcurrent decrease in clast size is more common in gravels, pebbles than in sands [3]. According to [4], grain size decline downcurrent is majorly due to decrease in stream competence and stream gradient decline.
Graphical presentation is a simple and understandable method of presenting grain size distribution of sediments. The independent variable which is the grain size (in Phi scale) is placed on the horizontal axis, while, other dependable variables (such as retained weight percentage, cumulative weight percentage etc.), that are determined from the analysis are placed on the vertical axis of each plot. This enables the construction of the histogram, frequency curve, cumulative curve etc. which approximate the normal probability curves of statisticians. Therefore, sedimentologists assume this normal statistical relationship for grain size distribution. The values derived from the graphical presentations are directly entered into established formulas for the calculations of several statistical parameters for the size distribution. According to [1], “The parameters calculated are in four categories’, those that measure: 1) The average size (mean, median and mode), 2) Spread of the average size around the average (sorting); 3) Symmetry or preferred spread to one size of the average (skewness) and 4) Kurtosis – the degree of concentration of the grains to the central size.” These parameters enable sedimentologists to compare several sediments to know which is better sorted than others and also to use bivariate plots of average size (mean, median and mode) against distance to quantitatively show the relationship of grain size change to distance of travel, direction of current flow, current energy and other data can also be deduced [2].
Sediments were taken from Ajali Sandstone outcropping in three locations, which are: Ayogwiri, Fugar and Orame in the Western Anambra Basin of Nigeria (Figure 1). The Anambra Basin is one of the component basins associated with the rifting and formation of the Benue Trough.
The Ajali Sandstone is one of the Proto Niger Delta deposits of Campanian-Maastrichtian age in the Anambra Basin, sandwhiched between two parallic successions: the Mamu and Nsukka Formations. It is a whitish clastic lithologic unit made up of successive units of sandstone and thin beds of mudstone and shale. The shales occur more and thicker at the base. The sedimentary structures observed at different stratigraphic units include different types of crossbeding such as planar, trough, herringbone crossbedding, epsilon beds, flaser beddings, skolithos, ophiomorphia, leisangang iron rings structures etc. [5, 6]. It is extensively exposed in the study area and has an average height of about 11 meters. The thicknesses of the beds are not uniform, but have parallel low dipping bedding planes. The sands are friable, moderately sorted with shapes of grains ranging from subangular to subrounded [7, 8, 9]. According to [9], Ajali Sandstone has two basic facies: the lower facies which consists of thinly laminated, heterolithic beds of shoreface environment and upper facies made up of mainly crossbedded sandstone. The major palaeocurrent direction of the Ajali Sandstone they inferred from palaeocurrent directional fabrics, structures and facies was in NE direction with subordinate directions in the SW and SE. This study hopes to relate calculated statistical parameters, such as: mean, sorting and skewness to variation in sediment dispersal and current energy pattern in the three locations: Ayogwiri, Fugar and Orame, where the Ajali Sandstone outcrops visibly in the Western Anambra Basin and is seriously quarried for the construction and allied industries (Figure 1).
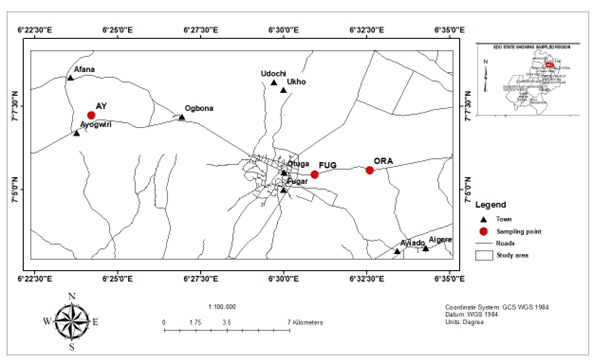
Fig 1: Location map showing sample points in Ayogwiri, Fugar and Orame in red.
LITERATURE REVIEW
The Anambra Basin is one of the resultant basins formed from the rifting and formation of the Benue Trough. Several workers have worked on the Ajali Sandstone in the western and eastern parts of the basin. Ajali Sandstone outcropping in Fugar in the Western Anambra Basin is said to be the lateral equivalent of the sandstone in the eastern part of the basin [8]. According to [10], the Santonian uplift is the source of the Campanian-Maastrichtian detritus. Ajali Sandstone bodies in the east were observed by [11] to have been deposited in wide variety of depositional environment with different shapes such as lobate, sheet shape, elongate and lenticular shape.
Using textural parameters, [6] inferred that the sediments of Ajali Formation were transported by saltation and suspension which indicate high and low energy regimes and sediments were of fluvial to shallow marine environments.
[9] presented stratalogs of the three locations: Ayogwiri, Fugar and Orame, indicating the various facies. textures, energy regimes and depositional environments. According to them, the depositional environments are: shoreface and mainly tidal channel, with epsilon crossbeds occurring in Fugar. Using directional fabrics and structures, they inferred that the dominant palaeocurrent in Ayogwiri is in the NE direction; Fugar has two current regimes: The SW and SE directions were prominent in the epsilon bed, while NE direction prevailed in the beds above the epsilon beds. The SW and SE directions prevailed in Orame.
METHODOLOGY
To achieve the aim of the study, several methods were employed. Samples were collected form several beds within the Ajali Sandstone oucropping at Ayogwiri, Fugar and Orame and the outcrops were logged at the different locations. This was followed by grain size analysis in the laboratory according to [12] to determine the statistical parameters. The parameters determined include the following: mean, sorting and skewness. Microsoft Excel charts were used to graphically delineate the variation of these statistical parameters: the mean, sorting and skewness of sediment grains in the three locations. The following equations and interpretations were applied according to [1].
Mean (GM):
This is the best measure of average grain size, which is best computed from size of particles spread through a range of percentile values. It is calculated from
M= (φ16 + φ50 +φ84) . ………………………………..Eq. 1
3
GM Scale Interpretation
-1.0 – 0.00 Very coarse sand
0.0 – 1.0 Coarse sand
1.0 – 2.0 Medium sand
2.0 – 3.0 Fine sand
3.0 – 4.0 Very fine sand
4.0 – 5.0 Coarse silt.
Sorting (ф):
This is a measure of spread in the size distribution. It is defined statistically as the extent to which grain spread on either side of the average diameter.
D = φ84 – φ16 + φ95 – φ5 ……………………………….Eq. 2
4 6.6
Values Interpretation
Less than 0.35 Very well sorted
0,35 – 0.50 Well sorted
0.50 – 0.70 Moderately well sorted
0.70 – 1.00 Moderately sorted
1.00 – 2.00 Poorly sorted
2.00 – 4.00 Very poorly sorted
Greater than 4.00 Extremely poorly sorted
Skewness (GSK):
It is the measure of the symmetry of the grain size distribution on a cumulative curve. It is a positively or negatively sign dimensionless number. It has neither metric nor phi value and lies between the range -1 to +1
GSK = φ84 + φ16 – 2(φ50) + φ95 + φ5 -2(φ50) …………Eq. 3
2(φ84 – φ16) 2(φ95 – φ5)
Values Interpretation
+1.00 – +0.30 Very positively (fine) skewed
+0.30 – 0.10 Positively (fine) skewed
+0.10 – -0.10 Nearly symmetrical
-0.10 – -0.30 Negatively (coarse) skewed
-0.30 – -1.00 Very negatively (coarse) skewed
Presentation And Discussion of Results Outcrop Logging Ayogwiri
At Ayogwiri, the entire area is overlain by the Ajali Sandstone, but the outcrop logging site is situated at a quarry with a geo-reference of 07o 7.230’ N and 06o 24.217’E. The height of the outcrop is about 8.4 m. Eight beds separated by mud drapes were logged with the last bed occurring as a thick weathered layer on top. Figure 2 gives the stratalog of the outcrop. Several sedimentary structures were observed in the beds such as mud drapes, heteroliths, crossbedding, herringbone cross stratification, flaser bedding, skolithos, etc. Samples were taken from some of the beds as indicated in Table 1.
![Fig. 2: Lithostratigraphic log of Ajali Sandstone in Ayogwiri (After [9])](https://rsisinternational.org/journals/ijrias/wp-content/uploads/2025/03/Figure-2.png)
Fig. 2: Lithostratigraphic log of Ajali Sandstone in Ayogwiri (After [9])
Table 1: Values of Grain Size Parameters of Ajali Formation in The Study Area
| SAMPLE NO | GEO-REFRERENCE | LOCATION | THICKNESS | MEAN (M) | SORTING (ф) | SKEWNESS
|
| AYOGWIRI | ||||||
| AY1 |
07O 07.230’N and 06O 24.217’É |
Bed A | 57 cm | 4 | 1.73 | -0.52 |
| AY2 | MD b/w AB | 45 cm | 5 | 0.32 | -0.1 | |
| AY3 | Bed B |
216 cm |
4.13 | 1.2 | -0.57 | |
| AY4 | Bed B | 4.63 | 0.67 | -0.03 | ||
| AY5 | Bed B | 4.9 | 0.42 | -0.7 | ||
| AY6 | MD b/wBC | 6 cm | 3.7 | 1.1 | 0.08 | |
| AY7 | Bed C | 153 cm | 3.76 | 1.11 | -0.28 | |
| AY8 | Bed D | 118 cm | 3.2 | 1.4 | -0.32 | |
| AY9 | Bed E | 68 cm | 5.03 | 0.87 | -0.45 | |
| AY10 | Bed F | 58 cm | 4.2 | 0.95 | -0.19 | |
| AY11 | Bed G | 12 cm | 4.63 | 0.54 | -0.34 | |
| AVERAGE | 4.29
Coarse silt |
0.94
Moderately sorted |
-0.27
Negatively skewed |
|||
| FUGAR | ||||||
| FUG1 |
07O 05.448’N and 06O 30.943’É |
Epsilon |
7.2 m |
4 | 0.53 | -0.06 |
| FUG2 | Epsilon | 3.8 | 0.79 | -0.12 | ||
| FUG3 | Epsilon | 3.33 | 0.79 | -0.1 | ||
| FUG4 | Epsilon | 4.03 | 0.52 | -0.21 | ||
| FUG5 | Pebble lag b/w epp and G | 6 cm | 2.6 | 2.5 | -0.54 | |
| FUG6 | Bed G | 80 cm | 3.76 | 0.93 | -0.31 | |
| FUG7 | Bed H | 110 cm | 3.9 | 0.81 | -0.26 | |
| AVERAGE | 3.63
Very fine sand |
0.98
Moderately sorted |
-0.23
Negatively skewed |
|||
| ORAME | ||||||
| ORA1 |
07O 05.576’N and 06O 32.593’É |
Bed A | 150 cm | 4.4 | 0.58 | -0.15 |
| ORA2 | Bed C | 80 cm | 3.8 | 1.1 | -0.5 | |
| ORA3 | Bed D | 40 cm | 4 | 0.64 | -0.03 | |
| ORA4 | Bed E | 65 cm | 3.3 | 0.9 | -0.69 | |
| ORA5 | Bed F | 95 cm | 3.47 | 0.78 | -0.63 | |
| ORA6 | Bed G | 70 cm | 3.7 | 0.9 | -0.06 | |
| ORA7 | Bed H | 80 cm | 3.9 | 1.3 | -0.48 | |
| ORA8 | Bed I | 50 cm | 3.8 | 0.7 | 0.03 | |
| ORA9 | Bed J | 90 cm | 3.8 | 0.6 | -1.06 | |
| ORA10 | Bed L | 82 cm | 3.7 | 1.6 | -1.3 | |
| AVERAGE | 3.78
Very fine sand |
0.91
Moderately sorted |
-0.49
Very negatively skewed |
|||
FUGAR
Fugar is about 30 km from Ayogwiri. The Sandstone was logged at an outcrop along a road cut with a geo-reference of 07o 05.448’N and 006o 30.943’E. It has a height of 12.5 m at this point (Figure 3). The sandstone occurs here as longitudinal crossbedding known as epsilon bed which consists of several packets or bundles of curved inclined beds of short lateral extent resulting from lateral migration of pointbars. There are about 26 to 28 of such bundles with thickness ranging from 2 cm to 5 cm. The epsilon beds occur from the base to about 7.2 m. The epsilon bundles are labeled as beds A to F. They are overlain by near horizontal beds G, H, I and J. The surface separating the epsilon beds from the overlying bed G is an erosional surface lagged with pebbles. Several sedimentary structures such as: Epsilon beds, planar crossbeds, ripple lamination, slump structures were among the structures observed. Samples were collected from several points in the epsilon crossbeds and the overlying beds as indicated in Table 1.
ORAME
Ajali Sandstone is seen to be massively outcropping in Orame at a georeference of 07o 05.576’N and 06o 32.593’. It has a height of about 13.05 m with fifteen near horizontal beds occurring, with the last bed severely weathered (Figure 4). Samples were collected from several beds as indicated in Table 1. The sedimentary structures observed were heterolithic beds of sands and clay, large planar crossbeds, convolute beds, mud drapes amongst others.
![Fig. 3. Lithostratigraphic log of Ajali Sandstone at Fugar (After [9]).](https://rsisinternational.org/journals/ijrias/wp-content/uploads/2025/03/Figure-3.png)
Fig. 3. Lithostratigraphic log of Ajali Sandstone at Fugar (After [9]).
![Fig 4: Lithostratigraphic log of Ajali Sandstone at Orame (After [9]).](https://rsisinternational.org/journals/ijrias/wp-content/uploads/2025/03/Figure-4.png)
Fig 4: Lithostratigraphic log of Ajali Sandstone at Orame (After [9]).
Presentation And Discussion of Statistical Parameters
The statistical parameters calculated are the mean, sorting and skewness of the grain population in Ayogwiri, Fugar and Orame. The results are presented in Table 1
MEAN GRAIN SIZE VARIATION IN THE STUDY AREA
The mean which is the arithmetic average of all the grain size population, is derived by averaging values of 16th, 50th and 84th percentiles from the cumulative curve. The vertical and spatial variation in grain size using the mean is observed by plotting the sample points within the beds beginning with the basal bed as sample point 1 and the calculated mean for each of the sample points within the beds in the three locations (Figures 5a – 5h). Some beds have more than one sample points while, others have just one (Table 1). The mean values in Ayogwiri range from 3.2 to 5.03 with an average of 4.29 (coarse silt); those for Fugar range from 2.6 to 4.03 with average of 3.63 (very fine sand); and 3.3 to 4.4 for Orame with an average of 3.78 (very fine sand). The average mean values show Ayogwiri is coarse silt while, Fugar and Orame are very fine sands. Also, the graphical presentation in Figures 5a – 5h show that the sediments in Ayogwiri are the finest, they are mostly coarse silt intermingled with very fine sand. The sediments in Fugar range from fine sand at the pebble lag between the epsilon beds and the horizontal beds to very fine sand, but are mostly very fine sand, whereas, fine sands occur in Orame with exception of Bed A, which is made up of coarse silt. [9] interpreted the environment in Ayogwiri to be shoreface and tidal channels; Fugar as pointbars in intertidal channels and tidal channels; and Orame as tidal channel and shoreface environments (See Figures 2, 3 and 4) with current direction majorly in the NE – SW direction using directional structures and fabrics. The variation of the mean grain size shows a decline in grain size from Orame, through Fugar towards Ayogwiri, giving a NE – SW trend (Figure 1), confirming the study of [9]. According to [2], there is down current decline of grain size, where coarser sediments are closest to source and finer materials are transported downstream.
The vertical variation of grain sizes can also be observed in all locations using the mean grain size (Figure 5a -d). This can be attributed to the changes in current energy. Several fining upward sequences (FUS) which indicate waning of current energy and coarsening upwards sequences (CUS) which implies upsurge or increase in current energy are observed in the different locations. Also, aggradation where there is no change in current and beds of similar grain size are deposited upon each other is observed in Orame.

Figure 5a: Mean grain size variations in Ayogwiri Figure 5b: Mean grain size variations in Fugar

Figure 5c: Mean grain size variations in Orame Figure 5d: Mean grain size variations in the three locations

Figure 5e: Mean grain size variations in Ayogwiri Figure 5f: Mean grain size variations in Fugar

Figure 5g: Mean grain size variations in Orame Figure 5h: Mean grain size variations in the three locations
At Ayogwiri, four fining upward sequences and three coarsening upwards sequences are delineated from the beds (Figures 5a and 5e). The first five sample points were collected from Beds A and B. They show a sequence of fining upward, coarsening upward and fining upwards again which can be correlated to the work of [9] that used strata logging and facies to indicate alternating current energy for this section of the formation. Also, there is correlation in Fugar with their work. Samples 1 to 5 were taken from the epsilon beds, according to them, these beds were deposited by high energy regime. Figures 5b and 5f indicate two major coarsening upward sequences interspaced with a short fining upward sequence, indicating high energy interspaced with a short time of current energy decline. This is followed by a single fining upwards sequence, also observed by them as a single fining upwards sequence above the epsilon beds (Figure 3). In Figures 5c and 5g, the sediment in Orame plot majorly as very fine sand to fine sands deposited with alternating current energy regimes.
SORTING (ф) VARIATION IN THE STUDY AREA

Figure 6: Sorting variation in the study locations
Grain size sorting has to do with the dispersal of grains around the average size. That is the tendency of the grain population to belong to one particular grain size. Current energy plays a great role in this dispersal. As current decreases, coarser sediments are deposited, while, finer materials are transported farther than the gradient, thereby, sorting out grains according to their sizes. Though, other factors may also contribute to grain sorting besides current energy and stream gradient [2]. The sorting of grains in Ayogwiri ranges from 0.32 – 1.73, that is: Very well sorted to poorly sorted grains. The average value is 0.94 (moderately sorted). Fugar is not too different; the sorting range is from 0.5 to 0.93 (moderately well sorted – moderately sorted) with an exception at the pebble lag above the epsilon bed which is 2.5 (very poorly sorted). The average value is 0.98 (moderately sorted). Orame has an average sorting value of 0.91 (moderately sorted). The range is from 0.58 to 1.6 (moderately well sorted to poorly sorted). Very few of the samples are poorly sorted and only one is very poorly sorted, majority is well sorted to moderately well sorted. The very poorly sorted sample (FUG5) in Fugar represent the pebble lag which separates the epsilon beds from the overlying horizontal beds, indicative of an erosional surface. Therefore, the current energy in all locations was high enough to sort the sediments effectively apart from intermittent waning of current energy observed within and between some beds.
SKEWNESS VARIATION IN THE STUDY AREA
Skewness indicates the symmetry of the grain population. Most grain population of sediments do not show normal or log-normal distribution of the grain size, but rather, are tilted towards one end of the tails of the distribution curve, thereby exhibiting asymmetry. When the modal class of the distribution is in the excess of the fine grains, it is said to be positively skewed or fine skewed, whereas, when the modal class is in the excess of the coarse grains, it is said to be negatively skewed or coarse skewed. In a grain size population, skewness reflects the sorting of that distribution as well as the energy of deposition [13]. Figures 7a to 7d graphically presents the skewness of the three study locations. The skewness values of the grain population in Ayogwiri ranges from 0.08 to -0.52; Fugar, ranges from -0.06 to -0.54 and that of Orame is -0.03 to -1.3. All the sediments sampled from the three locations range from negatively skewed to very negatively skewed (coarse skewed), but one, which is: AY6, that is positively skewed. It was sampled from the mud drape overlying the heterolithic Bed B in Ayogwiri (Figures 2, 7a, Table 1). Grains in Orame are coarser, that is, they are more negatively skewed than those in the other two locations (Figure 7c, 7d), which imply decline in grain size from Orame through Fugar to Ayogwiri, giving a NE-SW trend and also, a decline in depositional current energy in that same direction corroborating the palaeocurrent direction observed by [9], who used directional fabrics and structures.

Figure 7a: Skewness variation in Ayogwiri Figure 7b: Skewness variation in Fugar

Figure 7c: Skewness variation in Ayogwiri Figure 7d: Skewness variation in the three locations
CONCLUSION
The calculated mean, sorting and skewness of the grain size population of sediments sampled from Ajali Sandstone in Western Anambra Basin were used to study variation in sediment dispersal and current energy in three locations: Ayogwiri, Fugar and Orame where the sandstone outcrop. The average mean value for Ayogwiri is 4.29 (coarse silt), but ranges from 3.2 to 5.03. Fugar has a range of 2.6 to 4.03 with average of 3.63 (very fine sand); and 3.3 to 4.4 for Orame with an average of 3.78 (very fine sand). The average mean values show Ayogwiri is coarse silt while, Fugar and Orame are very fine sands. The variation of the mean grain size shows a decline in grain size from Orame, through Fugar towards Ayogwiri, giving a NE – SW trend.
The current energy was observed to be alternating between high and waning current producing coarsening upwards and fining upwards sequences respectively in the study locations. The current energy was high enough to sort the sediments, despite the intermittent waning of the current. The sorting ranges from moderately well sorted to moderately sorted with few samples that are poorly sorted and only one that is very poorly sorted, that is the sediment from the pebble lag between the epsilon beds and the near horizontal beds in Fugar. The average sorting value at Ayogwiri is 0.94 (moderately sorted), Fugar is 0.98 (moderately sorted) and Orame is 0.91 (moderately sorted).
The skewness of a grain size population reflects the sorting and energy of deposition. High energy is required to move coarse sediment, which get deposited as the energy drops, while, finer sediments are transported farther. The sediment in all the locations range from negatively skewed to very negatively skewed (indicating coarseness) with just one exception: that is, sample AY6 from the mud drape overlying the heterolithic Bed B in Ayogwiri, which is positively (fine) skewed. Grains in Orame are coarser, they are more negatively skewed than those in the other two locations, which implies decline in grain size from Orame through Fugar to Ayogwiri giving a NE – SW trend decline of grain size and invariably decline in depositional current energy in the same direction, confirming the palaeocurrent direction observed by [9] in their study using directional fabrics and structure. Ajali Sandstone is very friable and coarse sand with good sorting favouring its high exploitation for the construction and allied industries.
REFERENCES
- Tucker, M.E. (Ed.), 1989. Techniques in Sedimentology. Blackwell Scientific Publication.
- Pettijohn, F.J. (2004). Sedimentary Rocks (3rd Edition) CBS Publishers and Distributors, India.
- Dingle, E.H., Kusack, K. M., and Venditti J. G. (2021). The gravel-sand transition and grain size in river bed sediments. Journal of Earth – Science Reviews, Vol 222, https://doi.org/10.1016/j.earscirev.2021.103838
- Akpofure E. and James, S. S. (2024). Mineralogy and textural properties of sandbar deposits in River Forcados along Patani and environs. European Journal of Science, Innovation and Technology. ISSN: 2786 – 4936. ejsit-journal.com. Vol 4/ Number 5/ 2024
- Akpofure, E. and Etu-Efeotor, J. O. (2013a). Petrography of Ajali Sandstone in Ayogwiri – Fugar – Orame area of Western Anambra Basin: Implication for diagenetic and depositional history. Journal of Environment and Earth Sciences. Vol 3, No 5. 104 -113
- Akpofure, E. and Etu-Efeotor, O. (2013b). Influences of depositional environment on the sedimentary structures, biostratigraphy and textural characteristics of Ajali Sandstone in Ayogwiri – Fugar – Orame area of Western Anambra basin. European Journal of Scientific Research, Vol.103 Issue 4. p 634 -646
- Reyment, R.A., 1965. Aspects of Geology of Nigeria. Ibadan Univ. Press, 133 pages, 18pl.
- Kogbe, C.A., 1976. Palaeogeographic history of Nigeria from Albian times. In: Kogbe, C.A. (Ed.), Geology of Nigeria. Elizabethan Publishing, Lagos, Nigeria.
- Akpofure, E. and Akana, S. T. (2016). Palaeocurrent and Facies Analysis Of Ajali Sandstone In Western Anambra Basin, Nigeria. Journal of Africa Earth Sciences. (Elsevier) 118 (2016) 75 – 86
- Murat, R.C. (1972) Stratigraphy and Paleogeography of Cretaceous Lower Tertiary in Southern Nig. African Geol. T.F.J. Dessauvagie and M.D. Whiteman (Ed), university of Ibadan press 251-268
- Ladipo, K.O., 1988. Examples of tidal current periodicities from upper cretaceous sandstone (Anambra Basin SE Nigeria). In: Boer, P.L., Van, A., Nio, S.D. (Eds.), Tide Influenced Sedimentary Environments and Facies. D. Riedel Publ. Co., Dorgrecht, pp. 333e340.
- Folk, R. L., Ward, W. (1957) Brazos river bar: a study of the significance of grain size parameters. Journal of Sedimentary Petrology, 27, 3-26.
- Boggs, S. Jr. (2006). Principles of Sedimentology and Stratigraphy (4th Edition) Pearson Education Inc.