
Effects of Socio-Demographic and Economic Factors on Effective Implementation of the Africa Agenda in Nigeria
- Adisa R. A.
- Oyamakin S. O.
- 193-203
- Mar 12, 2024
- Education
Effects of Socio-Demographic and Economic Factors on Effective Implementation of the Africa Agenda in Nigeria
Adisa R. A., & Oyamakin S. O.
Biostatistics Unit, Department of Statistics, University of Ibadan, Nigeria
DOI: https://doi.org/10.51584/IJRIAS.2024.90217
Received: 30 December 2023; Revised: 15 January 2024; Accepted: 20 January 2024; Published: 12 March 2024
ABSTRACT
The African union agenda 2063 (AU Agenda 2063) intents to accelerate Africa’s economic transformation and promote sustainable development. The exponential growth model and monomolecular growth model were used to model and project various socio-demographic and economic indicators for Nigeria, including population, unemployment rate, access to electricity, military spending, GDP, and trade balance. Data from year 1991 to 2019 were used to fit the models, and predictions were made for the period from 2020 to 2063. The exponential growth rate model assumes that a population or other variables will continue to grow at an accelerating rate over time. The monomolecular growth rate model, on the other hand, assumes that growth will slow down and eventually level off as the population or variable reaches a saturation or optimum point. The study also highlights the strengths and weaknesses of the exponential growth rate and the monomolecular growth rates models in forecasting the indicators. Additionally, the exponential growth rate and monomolecular growth rate models were used to forecast the indicators. The results show that Nigeria’s population is projected to triple from 206 million in 2020 to 631 million in 2063, while the unemployment rate is projected to quadruple from 6.8% to 27.5%. The access to electricity is projected to increase from 35% to 123% in 2063, while the GDP is projected to increase from $603 billion in 2020 to $15 trillion in 2063. The military spending is projected to increase from 2.6 billion USD to 33.94 billion USD, and the trade balance is projected to increase from 15 billion USD in 2020 to 29.99 billion USD in 2063. The results show that the projected indicators align with the 2063 Africa Agenda and recommends policies that would foster sustainable economic growth and development in Nigeria. By understanding the trends and patterns of these socio-economic indicators, policymakers can make informed decisions about how to allocate resources and promote sustainable development in Nigeria and beyond.
Keywords: African Union, Agenda 2063, Nigeria Population Figures, Exponential Growth Model.
INTRODUCTION
AU Agenda 2063 is a shared framework for inclusive growth and sustainable development for Africa to be realized in the next fifty years. It is a continuation of the Pan-African drive over centuries, for unity, self-determination, freedom, progress and collective prosperity pursued under Pan-Africanism and African Renaissance. It is built on, and seeks to accelerate the implementation of past and existing continental initiatives for growth and sustainable development. It was agreed upon by the African leaders in 2013 50th Anniversary Solemn Declaration during the commemoration of the Fiftieth Anniversary of the Organization of African Unity (OAU). In their Declaration, the Heads of State and Government, while acknowledging past successes and challenges, rededicated themselves to the continent’s accelerated development and technological progress. They emphasized a guiding vision “to build an integrated, prosperous and peaceful Africa, driven and managed by its own citizens and representing a dynamic force in the international arena” and identified eight pillars for the continent in the foreseeable future. AU Agenda 2063, as a people-driven initiative, was to translate the ideals into concrete objectives, milestones, goals, targets and actions/measures.
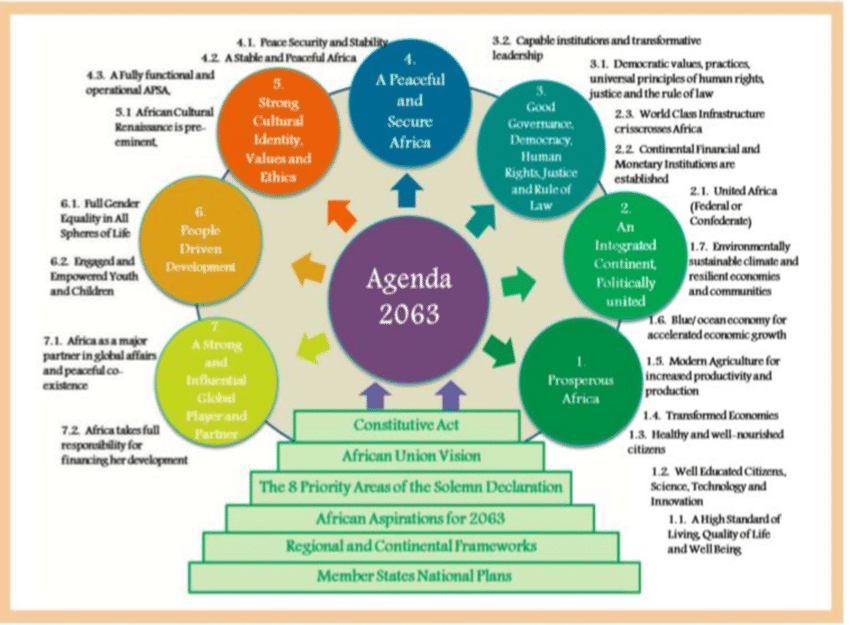
Figure 1: The Africa Union Agenda 2063 (Source: African Union, 2015)
Figure 1 reflected on the basis of the draft of the AU Agenda 2063 Framework and its Popular Version (a simpler version of the Framework Document) as a guide; as well as the First Ten-Year Implementation Plan were prepared and adopted by the AU policy organs in January and June 2015 respectively. Meanwhile, the policy organs have also identified some flagship projects to be given priority in the execution Agenda 2063; and they have been dully incorporated as listed; The African Integrated High Speed Network, African Commodities Strategy, Creation of the Continental Free Trade Area, The Pan-African E University, The African Passport and Free Movement of People, Silencing the Guns by 2020, Implementation of the Grand Inga Dam Project, Creation of an Annual Consultative Platform for policy dialogue, Single African Air Transport Market, Outer Space, Pan-African Virtual University and, the Continental Financial Institutions.
Despite the AU Agenda 2063 guiding vision agreed upon by African leaders in 2013 “to build an integrated, prosperous and peaceful Africa, driven and managed by its own citizens and representing a dynamic force in the international arena”. It is important that the relevant stakeholders and decision makers in Nigeria quickly adopt and embrace some necessary precautions to tackle some challenges that may hinder Nigeria from achieving the economic and development goals outlined in the 2063 Africa Agenda and also place it as one of the nations that might not attain the AU agenda 2063 as stated by President Muhammadu Buhari of Nigeria at the US-Africa Leaders’ Summit held on December 13-15, 2022 in US Capital, Washington DC.
For this to materialize, accurate and reliable forecasts are critical for achieving the visions of the 2063 Africa agenda in Nigeria. However, several challenges hinder the development of reliable forecasts, including insufficient investment in human capital, limited economic diversification, poor infrastructural development, climate change and environmental degradation, and corruption and governance challenges. Addressing these challenges is essential for effective policies and plans to achieve the visions of the 2063 Africa agenda and its domestication to Nigeria context. It is in this context that the study aimed at evaluating some economic and socio-demographic variables in Nigeria in line with the developmental goals outlined in the 2063 Africa Union Agenda. These included poverty reduction, economic growth, and social development etc. The study used the predictive models such as exponential and monomolecular growth equations among other methods to identify strategies that the Nigerian government can adopt to manage their population growth and achieve sustainable development in alignment with the realization of strategies towards the domestication of the AU Agenda 2063.
METHODOLOGY
The study used the data on Nigeria Population, Unemployment rate (%), Electricity access (%), Military spending/Defense Budget (in Billions of US $), Gross Domestic Product (GDP (in Billions of US $)) and Trade Balance (in Billions of US $) from 1991 to 2019 published on: https://www.macrotrends.net/countries/NGA/Nigeria/. The exponential growth model used was based on the Malthusian perspective 𝑝t ∝ 𝑝 as noted by Oyamakin et. al. (2013), Oyamakin and Chukwu (2014, 2015) and has the differential form as below;
dp/dt=rp(1)
Separating the variables, we have;
 (2)
(2)
Integrating both sides, we have;
![]() (3)
(3)
Taking the exponential of both sides, we have;
![]() (4)
(4)
Equation (4) above gives the exponential growth model where is the population at time t, r is the rate of growth (intrinsic) and P0 is the initial/base population. By substitution we also obtained intrinsic rate of population increase, doubling time and Half time as stated below in equation 5, 6 and 7, respectively.
 (5)
(5)
![]() (6)
(6)
and
![]() (7)
(7)
The Monomolecular model has a differential form given as;
 (8)
(8)
Using the differential form of the monomolecular model stated above in equation 8 to derive the monomolecular growth model gave;
![]() (9)
(9)
After separating the variables and integrating both sides, we have that;
Taking exponential of both sides;
![]() (12)
(12)
Equation (12) above can be written as follows;
![]() (13)
(13)
![]()
Multiply through by k-P
Making P the subject of the formula
 (16)
(16)
Equation (16) can be re-written as follow;
![]() (17)
(17)
Equation (17) can be written as;
![]() (18)
(18)
Equation (18) gave the monomolecular growth model (MMGM). Where k is the maximum sustainable population/Asymptote, pt is the current population, t is time / year of the population, r is the rate of population growth (intrinsic) and P0 is the initial population. Having calculated the value of r during a given period, from time t to t + n, an estimate of the population for any date within this period is called interpolation (intercensal), and for any date outside this period (in future or in past) is known as extrapolation (postcensal).
DISCUSSION OF RESULTS
The table below presents the simple linear regression models fitted to show the effect of Nigeria population on unemployment rate, electricity access, military spending, GDP and Trade balance in the country. The independent variable is the Nigeria population in millions.
Table 1: Parameter estimates and Coefficient of determination based on Ordinary Least Squares with predictors
| Dependent Variable | Coefficient (Y= B0+B1X) | R2 |
| Unemployment (%) | Y= -0.322+0.033X | 0.467 |
| Pop access to Electricity access (%) | Y=16.796+0.213X | 0.878 |
| Military spending ($USD) | Y= -1.757+0.021X | 0.7398 |
| GDP | Y= -520.321+5.244X | 0.861 |
| Trade Balance | Y= 3.799+0.056X | 0.0074 |
Table 1 shows that the unemployment rate (%) is expected to increase by 0.033 when the population (in millions) goes up by one and that population accounted for 46.7% of the explained variability in the nation’s unemployment rate. Also, the population access to electricity (%) is predicted to increase by 0.213 when the population (in millions) goes up by one and that population accounted for 87.8% of the explained variability in population access to electricity. Likewise, the military spending/defense budget (in billions of USD) is predicted to increase by 0.021 when the population (in millions) goes up by one and that population accounted for 73.98% of the explained variability in military spending/defense budget. Also, the GDP (in billions of USD) is predicted to increase by 5.244 when the population (in millions) goes up by one and that population accounted for 86.1% of the explained variability in the GDP. Finally, the trade balance (in billions of USD) is predicted to increase by 0.056 when the population (in millions) goes up by one and that population accounted for 0.74% of the explained variability in the trade balance.
Table 2: Annual Intrinsic rate of increase (r) based on exponential growth model
| Variables | r | Percentage(%) |
| Population growth | 0.025192 | 2.519181 |
| unemployment rate | 0.031 | 3.1 |
| Electricity Access | 0.021166 | 2.116576 |
| military spending | 0.078577 | 7.8577 |
| GDP | 0.104666 | 10.46659 |
| Trade balance | 0.128825 | 12.88247 |
Nigeria population average annual growth rate is increasing by 2.52% per annum. Also, the unemployment rate, electricity access, military spending / defense budget, GDP and trade balance annual growth rate in the country will be increasing by 3.1%, 2.12%, 7.9%, 10.5%, and 12.9%, respectively per annum (Table 2).
Table 3: Doubling time based on the exponential growth model prediction
| Variables | doubling time |
| Population | 27.51478 |
| unemployment rate | 22.35959 |
| electricity access | 32.74851 |
| military spending/defense budget | 8.821248 |
| GDP | 6.622471 |
| trade Balance | 5.380546 |
Table 3 shows that the Nigeria population will double every 27.5 years while the unemployment rate will double every 22.36 years. Also, the electricity population access, military spending/defense budget, GDP and trade balance will double every 32.7 years, 8.82 years, 6.62 years and 5.4 years respectively. Tables 4 – 9 below showed the estimated parameters for exponential growth model with their respective initial population P0, the rate of growth (r) and coefficient of determination (R2)
Table 4: Population Parameter Estimates using exponential growth model
| Parameter | Estimate | Std. Error | 95% Confidence Interval | |
| Lower Bound | Upper Bound | |||
| P0 | 96.757 | .178 | 96.391 | 97.123 |
| r | .026 | .000001 | .026 | .02721 |
R2 = 99%
The table 4 shows the exponential growth model parameter estimates for the population. The predicted initial population P0 is 96.757, the predicted rate of growth r is 0.026 and R2 is 99%.
Table 5: Unemployment rate Parameter Estimates using exponential growth model
| Parameter | Estimate | Std. Error | 95% Confidence Interval | |
| Lower Bound | Upper Bound | |||
| P0 | 2.752 | .326 | 2.083 | 3.421 |
| r | .031 | .006 | .019 | .043 |
R2 = 46.8%
The table 5 above shows the exponential growth model parameter estimates for the unemployment rate. The predicted initial population P0 is 2.752, the predicted rate of growth r is 0.031 with 46.8% coefficient of determination.
Table 6: Electricity access population Parameter Estimates using exponential growth model
| Parameter | Estimate | Std. Error | 95% Confidence Interval | |
| Lower Bound | Upper Bound | |||
| P0 | 37.009 | .755 | 35.460 | 38.558 |
| r | .017 | .001 | .014 | .019 |
R2 = 89.6%
The table 6 above shows the exponential growth model parameter estimates for the electricity access population. The predicted initial population P0 is 37.009 and the predicted rate of growth r is 0.017 with 89.6% coefficient of determination.
Table 7: Military spending Parameter Estimates using exponential growth model
| Parameter | Estimate | Std. Error | 95% Confidence Interval | |
| Lower Bound | Upper Bound | |||
| P0 | .460 | .091 | .273 | .648 |
| r | .060 | .009 | .041 | .078 |
R2 = 70.2%
The table 7 above shows the exponential growth model parameter estimates for the military spending/defense budget. The predicted initial population P0 is 0.460, the predicted rate of growth r is 0.060 with 70.2% coefficient of determination.
Table 8: GDP Parameter Estimates using exponential growth model
| Parameter | Estimate | Std. Error | 95% Confidence Interval | |
| Lower Bound | Upper Bound | |||
| P0 | 67.982 | 14.869 | 37.473 | 98.491 |
| r | .075 | .010 | .056 | .095 |
R2 = 79.7%
The table 8 above shows the exponential growth model parameter estimates for the GDP. The predicted initial population P0 is 67.982 and the predicted rate of growth r is 0.075 with 79.7% coefficient of determination.
Table 9: Trade Balance Parameter Estimates using exponential growth model
| Parameter | Estimate | Std. Error | 95% Confidence Interval | |
| Lower Bound | Upper Bound | |||
| P0 | 9.400 | 6.709 | -4.367 | 23.166 |
| r | .016 | .039 | -.064 | .097 |
R2 = 11%
The table 9 above shows the exponential growth model parameter estimates for the trade balance. The predicted initial population P0 is 9.400 and the predicted rate of growth r is 0.016 with 11% coefficient of determination. The predicted and observed variables show the relationship and how best the models’ predictions. This is shown in figure 2 below:
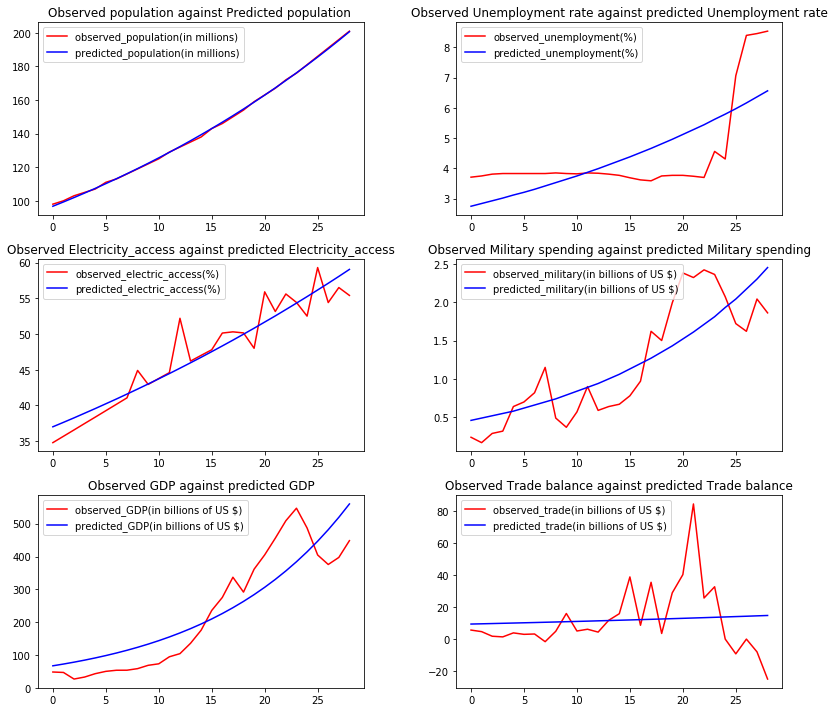
Figure 2: Observed and Predicted plots of Socio-economic Variables under consideration
The figures above depicted the observed population against the model predicted population, observed unemployment rate against predicted unemployment rate, observed population electricity access against predicted electricity access, observed military spending against Predicted military spending, observed GDP against the model predicted GDP and likewise observed trade balance against predicted trade balance
The graphs show that the model predicted the population well, and the model is fit to predict the future population Also, it depicts the observed unemployment rate versus the predicted unemployment rate. The graph showed that the model doesn’t fit the prediction of the unemployment rate as there are deviations and differences between observed and the predicted unemployment rates. Also, the population access to electricity against the model predicted access to electricity was shown on the graph. The graph shows that the model doesn’t predict the electricity access well as there are slight deviations from the observed electricity access. Likewise, it depicts the observed military spending versus the model predicted military spending values. The graph shows that the model doesn’t predict the military spending well as there are many deviation and differences from the observed ones. The graph shows that the model doesn’t predict the GDP values well as there are many deviations between the observed and predicted GDP and lastly it shows that the model doesn’t fit well the trade balance as there are many deviations from the observed.
Table 10: Summary of the model selection criteria computed for Exponential and Monomolecular Models
| Models | RSE | MSE | R2 |
| Population (Exponential) | 0.587 | 0.356 | 100% |
| Population (Monomolecular) | 3.522 | 13.364 | 98.70% |
| Unemployment rate (Exponential) | 1.116 | 1.293 | 46.80% |
| Unemployment rate (Monomolecular) | 1.2 | 1.552 | 38.50% |
| Electricity Access (Exponential) | 2.304 | 5.507 | 89.60% |
| Electricity Access (Monomolecular) | 1.911 | 3.933 | 92.90% |
| Military Spending (Exponential) | 0.411 | 0.175 | 70.20% |
| Military Spending (Monomolecular) | 0.381 | 0.157 | 74.40% |
| GDP (Exponential) | 79.607 | 6644.579 | 79.70% |
| GDP (Monomolecular) | 66.886 | 4817.872 | 85.90% |
| Trade Balance (Exponential) | 20.398 | 431.52 | 11% |
| Trade balance (Monomolecular) | 20.316 | 444.491 | 19% |
Considering the Residual Standard Error (RSE) and Mean Square Error (MSE) estimates displayed in table 10, It was obvious that the exponential model showed promising results for the population and unemployment rate. It fitted the data with smaller RSE and MSE compared to the monomolecular model while monomolecular model showed promising results for electricity access, military spending, GDP and trade balance as It fitted the data with smaller RSE and MSE compared to the exponential model. With these results, we could conclude that exponential model will give more accurate prediction over monomolecular model for predicting population and unemployment rate. while monomolecular model will give more accurate prediction over exponential model for predicting Electricity access, military spending, GDP and trade balance.
CONCLUSION
According to the analysis of data, the Nigeria population growth had an impact and influence on unemployment rate, electricity access, GDP, military spending and trade balance. It implies that the Nigeria unemployment rate, electricity access, GDP, military spending and trade balance would be increasing as the population increases.
The estimated average annual growth rate that exhibited the economic and socio-demographic variables selected were increasing per annum. From the exponential and the monomolecular models, estimation obtained for the variables in this study, it was established that the exponential model predicted estimates that are closer to the observed ones as compared to the monomolecular model. The displayed pictorial representations of all the observed and the predicted values of the economic and socio demographic variables employed for this study obtained for the two models depicted that both exponential and monomolecular models behaved well in the prediction of the population and electricity access population while trade balance, unemployment rate, GDP and military spending were not predicted as expected.
The MSE and RSE demonstrated that exponential model will lead to more accurate prediction for predicting population and unemployment rate. On the other hand, monomolecular model will lead to more accurate prediction for predicting Electricity, military, GDP and trade balance data.
The exponential model projections carried out for the Nigeria population, unemployment rate, electricity access, GDP, military spending and trade balance indicated that if the Nigeria current population growth rate continues, Nigeria population, unemployment rate, electricity access, GDP, military spending and trade balance would continue to be increasing by 2063, the population, unemployment rate, electricity access, military spending, GDP and trade balance are likely to reach 631 million, 25.7%, 123%, 33.94 billion USD, 15 trillion USD and 29.99 billion US dollars respectively. 8
Conclusively, this study provided reliable and genuine information that could be useful for the relevant stakeholders and decision-makers in Nigeria to challenges posed by population growth and measure to take in order to achieve the development goals in alignment with the 2063 Africa Agenda. It shades light on areas of focus in order to tackle the challenges that may hinder Nigeria from achieving the development goals outlined in the 2063 AU Agenda.
REFERENCES
- Africa Union Commission (2015): Africa 2063 Agenda final edition. © Africa Union Commission. ISBN: 978-92-95-10423-5.
- Alon, N., & Regev, U. (2017): Sustainable Population Growth: The Exponential Rate Model. Journal of Mathematical Biology, 74(3), 673-695.
- Birhanu et al. (2016): “Ethiopia population growth projection using exponential growth rate model”.
- Bongaarts, J., & Bulatao, R. A. (2000): Beyond six billion: Forecasting the world’s population. National Academies Press.
- Chavas, J. P., & Kim, K. H. (2020): Agricultural supply response under structural transformation: Estimating the transition from monomolecular to logistic yield responses. American Journal of Agricultural Economics, 102(4), 1123-1144.
- Chen, H., Liu, J., Liu, Y., & Wu, Q. (2021): An improved monomolecular growth model based on B-spline interpolation for population projection. Journal of Ambient Intelligence and Humanized Computing, 12(7), 6851-6862.
- Deo, R. C., & Sahin, M. (2018): Short-term solar power forecasting using the adaptive neuro-fuzzy inference system algorithm with artificial bee colony algorithm-based feature selection. Applied Energy, 211, 1128-1141.
- Draper, N. R. & Smith, H. (1981): Applied Regression Analysis. New York: John Wiley and Sons.
- Elijah A. Adefolalu and others (2016): “Population projections for Nigeria: 2010-2050”.
- Farr, W. A., DeMas, D. J., & Dealy, J. E. (1989): Height and crown width related to diameter for open-grown western hemlock and sitka spruce. Can. J. For. Res. 19, 1203 – 1207
- Jennifer M. Ortman and others (2014): “Population projections for the United States: 2010-2050”
- Jiang, G., Li, G., Jin, M., Li, X., & Xue, F. (2018): The prediction of industrial energy consumption based on exponential smoothing model and improved grey model. Applied Energy, 215, 524-535.
- Jonathan Cribb and others (2020): “Population projections for the United Kingdom: 2018-2043”.
- Lee and Tuljapurkar (2013): Projecting the population growth of the United States using the monomolecular growth model.
- Li, G., Jiang, G., Jin, M., Li, X., & Xue, F. (2018): Forecasting of industrial water consumption based on exponential smoothing model and improved grey model. Journal of Cleaner Production, 190, 162-171.
- Li, Y., Zhang, S., & Li, J. (2018): Modeling and prediction of population growth based on monomolecular model with seasonal factor. Discrete Dynamics in Nature and Society, 2018.
- Motulsky, H. J., and L. A. Ransnas. 1987: Fitting curves to data using nonlinear regression: A practical and nonmathematical review. FASEB J. 1:365–374.
- Oyamakin SO, Chukwu AU. On the hyperbolic exponential growth model in height/diameter growth of PINES (Pinus caribaea). International Journal of Statistics and Applications. 2014;4(2):96-101. (DOI: 10.5923/j.statistics.20140402.03).
- Oyamakin SO, Chukwu AU. On the hyperbolic monomolecular growth model in height/diameter growth of PINES (Pinus caribaea). International Journal of Statistics and Applications. 2015;4(2):96-101. (DOI: 10.5923/j.statistics.20140402.03).
- Oyamakin SO, Chukwu UA, Bamiduro TA. On comparison of exponential and hyperbolic exponential growth models in height/diameter increment of PINES (Pinus caribaea). Journal of Modern Applied Statistical Methods. 2013;12:(2):381 –404. Article 24.
- Ratkowskay, D. A. (1983). Nonlinear Regression modeling. New York: Marcel Dekker.
- Sandra L. Colby and others (2018): “Population projections for the United States: 2018-2060”
- Seber, G. A. F. and C. J. Wild, 1989. Nonlinear Regression. John Wiley and Sons: NY
- Tabatabai M, Eby W, Singh KP. Hyperbolastic modeling of wound healing. Mathematical and Computer Modelling. 2011;53(5-6):755-768. (DOI: 10.1016/j.mcm.2010.10.013)
- Tamang, B., Shrestha, M., & Shrestha, A. (2020): Modeling and forecasting population growth in Nepal using exponential growth model. BMC Public Health, 20(1), 104.
- Wu, J., Wang, L., & Wei, J. (2019): Forecasting the Population Growth of China: A Monomolecular Growth Model with Time-Varying Parameters. Sustainability, 11(20), 5614.
- Zhang, S., & Li, Y. (2015): Prediction of population growth based on monomolecular model. Journal of Applied Mathematics, 2015.
- Zhang, S., Li, Y., & Li, J. (2016): Forecasting population growth based on the modified monomolecular model with a stochastic term. Journal of Applied Mathematics, 2016.
- Zhang, S., Li, Y., & Li, J. (2017): Short-term forecasting of population growth based on a fractional-order monomolecular model. Complexity, 2017.