
Evaluating the Effect of Electromagnetic Field from Electrical Distribution Substations in Aguata, Nigeria
- Obiora E. Okoye
- Bubu Atisi
- Melvin Idonje
- Ezekiel O. Agbalagba
- 414-424
- Jul 18, 2024
- Electrical Engineering
Evaluating the Effect of Electromagnetic Field from Electrical Distribution Substations in Aguata, Nigeria
1Obiora E. Okoye, 1Bubu Atisi, 2Melvin Idonje and 3Ezekiel O. Agbalagba
1Department of Physics Electronics Technology, School of Science Laboratory Technology, University of Port Harcourt.
2Department of Physics, University of Port Harcourt
3Department of Physics, Federal University of Petroleum Resources, Effurun, Nigeria.
DOI: https://doi.org/10.51584/IJRIAS.2024.906037
Received: 23 May 2024; Revised: 07 June 2024; Accepted: 18 June 2024; Published: 18 July 2024
ABSTRACT
This study evaluates the radiation safety implications of electromagnetic field (EMF) from electrical distribution sub-stations in Aguata Local Government Area (LGA), Anambra State, Nigeria, using the EMF meter with a laser distance meter in-situ. Ten (10) locations of 11KV distribution sub-stations were mapped out and used for the study. The results of the in-situ measurement of Electric Field (E) and Magnetic Field (H) were used to evaluate the Power Density (S), Specific Absorption Rate (SAR) and Statistical analysis which includes descriptive statistics, inferential statistical tests (T-test) and graphical analysis to evaluate significant differences of EMF levels between different locations. The EMF emitted by these distribution substations was examined using data from the various locations. The results obtained show that EEDC Office has the highest electric field of 0.6633 V/m, while Oko Road has the second highest of 0.7783 V/m. The magnetic field intensity varies across locations, with Oko Road having the largest of 1.3317 A/m. Power density varied, with Oko Road having the highest 1.0365 W/m2 and Stadium having the lowest 0.1011 W/m2. The Specific Absorption Rate (SAR) ranging from 0.0001 to 0.0005 W/Kg showed consistent rates across locations. The International Commission on Non-Protection of Electromagnetic Fields (ICNIRP) sets EMF exposure regulations from 0-300 GHz at the exposure values of, E = 10,000V/m, H = 4×10⁴ A/m, S = 50W/m2, SAR = 10W/kg. In this study, electric field, magnetic field, power density, and specific absorption rate (SAR) values varied widely between stations, with the magnetic field accounting for 45.25% of total electromagnetic exposure. The exposure to EMF emanating from distribution substations in Aguata LGA does not pose any health effect or any health hazards to the general public comparing the measured data with the standard guideline of ICNIRP.
Key words: ICNIRP, Electromagnetic Field, SAR, Distribution Station
INTRODUCTION
Electromagnetic fields (EMF) are areas of energy that surround electrical devices and are characterized by their frequency and wavelength. EMF can originate from various sources, including power lines, electrical wiring, and wireless communication devices (Clegg et al., 2020). The frequency of EMF can range from extremely low frequency (ELF) fields, such as those emanating from electrical power lines (0 Hz–300 Hz), to radiofrequency (RF) fields, which are commonly associated with wireless communication technologies (100 kHz–300 GHz) (Levitt et al., 2020).
The quest for regulatory compliance and the need to compare the electromagnetic field radiation from distribution substations in Aguata LGA, Anambra State, Nigeria, to worldwide criteria established by the International Commission on Non-Ionizing Radiation Protection (ICNIRP) (López et al., 2022) necessitated this study. This research primarily aims to calculate the power density, the rate of energy flow per unit mass, area, or volume, determined by the product of the electric and magnetic fields (see equation 1) and measured from the far field due to the varying impedance of air (Ijabor et al., 2023).
S = E x H (1)
where,
S is the power density (watts per square meter, W/m2)
E is the electric Field strength (Volts per meter, V/m)
H is the magnetic field strength measured in µT, using a conversion factor
1µT = 0.7957747 (Ampere per meter, A/m)
Then, specific absorption rate (SAR) (measures energy absorption by tissue mass (skin) when exposed to radiofrequency electromagnetic field, measured in W/kg and related to electric field using equation (2) (Ojuh, & Isabona., 2015),
SAR = σE2/ρ (2)
Where, 𝜎 is the conductivity of the skin (0.87S/m)
E is the electric field (V/m)
𝜌 Density of the skin (1.125 x 10⁻⁴Kg/m3) (Ijabor et al., 2023)
In Nigeria, the Power Holding Company of Nigeria (PHCN) and several Distribution Companies (DISCOs) are responsible for ensuring reliable and quality electrical power. This responsibility has led to the establishment of substations in various locations, including Aguata Local Government Area (LGA). Historically, PHCN managed the entire electricity supply chain in Nigeria and Enugu Electricity Distribution Company (EEDC) was specifically responsible for electricity distribution in the Southeast. However, as part of the power sector reforms, DISCOs were created to focus on the distribution and retail supply of electricity to consumers. The historical role of PHCN in developing the electricity infrastructure and the current role of DISCOs in managing and maintaining the distribution network are crucial for the existence and efficient operation of electrical power substations in Aguata LGA (Onochie, Egware, & Eyakwanor, 2015). These substations are essential for ensuring a reliable and quality power supply to the local community.
However, the effects of EMF radiation have become a major concern due to the rise in emissions from wireless devices, smart settings, and new radiation-emitting infrastructure (Clegg et al., 2020). Despite tremendous technological advancements, there is a lack of systematic methods to monitor EMF exposure and a limited understanding of individual exposure levels (Raj, Lee, & Sidek, 2020). Consequently, with new infrastructure deployments, smart environments, and wireless consumer devices, public exposure to RF and ELF electromagnetic fields is constantly evolving.
As a result, the increase in the number of electrical distribution substations in Aguata LGA has generated concern regarding the possible health risks arising from elevated exposure to EMF. Potential health risks associated with EMF radiation from distribution substations include cancer, neurological effects, reproductive and developmental issues, and cardiovascular impacts. However, the scientific evidence remains inconclusive in many areas. Public health guidelines and continued research are essential to ensure that any risks are adequately managed and mitigated.
Table 1-2 presents the guidelines which consider EMF frequency, exposure duration, and health effects at different exposure levels. These guidelines are continuously updated to incorporate recent scientific discoveries and technological breakthroughs (Protection, 2020). They are designed to sustain EMF exposure at levels below the threshold that could potentially result in detrimental health consequences (Hardell, & Sage, 2008).
Table 1: Reference levels for exposure on an averaged over 30 minutes and the whole body (Karine, 2020)
| Exposure scenario | Frequency range | Incident E-field strength; Einc (V m-1) | Incident H-field strength; Hinc (A m-1) | Incident power density; Sinc (W m-2) |
| Occupational | 0.1 – 30 MHz | 660/f M | 0.7 4.9/f M | NA |
| >30 – 400 MHz | 61 | 0.16 | 10 | |
| >400 – 2000 MHz | 3f M | 0.5 0.008f M | 0.5 f M/40 | |
| >2 – 300 GHz | NA | NA | 50 | |
| General Public | 0.1 – 30 MHz | 300/f M | 0.7 2.2/f M | NA |
| >30 – 400 MHz | s27.7 | 0.073 | 2 | |
| >400 – 2000 MHz | 1.375f M | 0.5 0.0037f M | 0.5 f M/200 | |
| >2 – 300 GHz | NA | NA | 10 |
Table 2: Basic restrictions for power density for frequencies between 10 and 300 GHz (Karine, 2020)
| Exposure characteristics | Power density (W/m2) |
| Occupational exposure | 50 |
| General public | 10 |
METHODOLOGY
Study Area
Aguata Local Government Area (LGA) lies on longitude E7o05ˈ0 ̎ and latitude N6o01ˈ0 ̎ with an approximate population of about 240,000 individuals, is renowned for its agrarian economy and thriving marketplaces (Akanwa, 2018). EEDC which is saddled with the responsibility for the distribution of energy to the southeastern states of Nigeria, is also responsible for Aguata Local Government Area (LGA) energy supply (Amuji et al., 2018). The assortment of distribution substations comprised ten 11KV substations, encompassing urban, suburban, and rural regions. The selection of substations took into account factors like geographic diversity, accessibility, and technical variation.
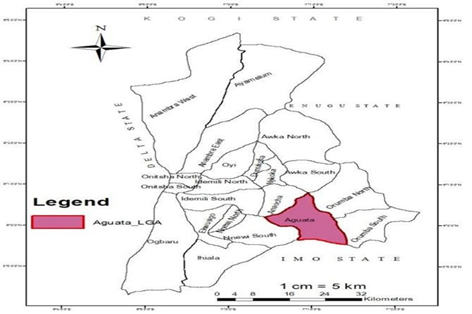
Figure 1: Map of Anambra State showing Aguata LGA [11]
Materials and Instruments
The primary tool for measuring the magnetic and electric fields in this study was a calibrated RoHS EMF meter, model VT ER1. This specialized instrument is designed to detect and measure the strength of electric and magnetic fields in the environment. Calibration of the meter is crucial, ensuring its readings are accurate and consistent with established standards.
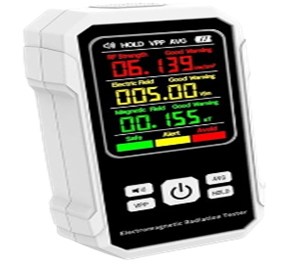
Figure 2: RoHS EMF meter, model VT ER1
The meter measures magnetic field strength in units of microtesla (μT). This unit quantifies the force exerted by the magnetic field on magnetic materials. It also measures electric field strength in units of volts per meter (V/m). This unit indicates the electrical force exerted on a charged particle within the electric field.
Additionally, the meter is powered by a readily available 9V alkaline battery, with an approximate lifespan of 100 hours under normal use. This extended battery life allows for extended measurement campaigns without frequent replacements.
Furthermore, the MC8042 is a portable device with built-in GPS functionality, designed to measure land area. It features GPS position recording, area calculation software, and data storage and export capabilities. The device is manufactured by Mileseey, a leading manufacturer of surveying and measuring instruments. Its functionality includes determining location, navigating, and calculating acreage based on GPS data.
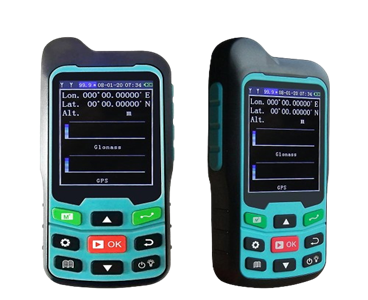
Figure 3: Mileseey MC8042 GPS Plough land meter
Data Collection Procedure
To ensure accurate readings, specific procedures were followed during data collection. First, the EMF meter was placed at a standard height of 1 meter above the ground. This choice ensured consistency with established protocols and minimized the influence of ground clutter and variations that could affect the readings (Njoku et al., 2022). Furthermore, the meter was positioned facing the source of the field and held steady throughout the measurement. This practice helped to avoid displaying excess field values caused by transient electrostatic charges.
Readings were taken at specific points within the substations. Specifically, they were collected at the base (directly underneath) the point of Interest, with the meter sensor facing upward. Additionally, to capture the maximum magnetic and electric fields, measurements were conducted between 9 AM and 3 PM. This time frame coincides with peak electricity usage, when the substations are functioning at their full capacity (Zhukovskiy et al., 2022).
Data Analysis
Once the data collection was complete, the analysis phase began. The first step involved calculating the average of the multiple readings taken at each designated point. This averaging process helped to account for slight variations and improve the overall accuracy of the data set.
To assess the significance of any observed differences between the measurements, ANOVA was employed. This statistical test, implemented using the software SPSS, is commonly used to compare the means of multiple independent groups. In this context, it was used to compare the magnetic and electric field readings from the 10 different locations within the electrical substation.
FINDINGS AND ANALYSIS
Table 3: Calculated mean value from the 10 Distribution Substation
| S/N | Location Electric field, E (V/m) | Magnetic field, H (A/m) | Power Density, S (W/m2) | Specific Absorption Rate, SAR (W/Kg) | |
| 1 | EEDC Office | 0.6633 | 1.0800 | 0.7164 | 3.40 x 10⁻⁵ |
| 2 | Aguata Inside | 0.4067 | 0.5267 | 0.2142 | 1.28 x 10⁻⁵ |
| 3 | Aguata Outside | 0.4967 | 0.6500 | 0.3229 | 1.91 x 10⁻⁵ |
| 4 | Oko Road | 0.7783 | 1.3317 | 1.0365 | 4.68 x 10⁻⁵ |
| 5 | Jezco | 0.4767 | 0.6283 | 0.0299 | 1.76 x 10⁻⁵ |
| 6 | St John | 0.5033 | 0.6750 | 0.0340 | 1.96 x 10⁻⁵ |
| 7 | Stadium | 0.3033 | 0.3333 | 0.1011 | 7.11 x 10⁻⁶ |
| 8 | Umuchiana 1 | 0.5033 | 0.4467 | 0.2248 | 1.96 x 10⁻⁵ |
| 9 | Umuchiana Field | 0.5033 | 0.5367 | 0.2701 | 1.96 x 10⁻⁵ |
| 10 | Umuchi | 0.4767 | 0.6267 | 0.2987 | 1.76 x 10⁻⁵ |
Table 3 displays the average values, the computed power density using equation (1) above and the Specific Absorption Rate (SAR) equation (2) for the distribution substations.
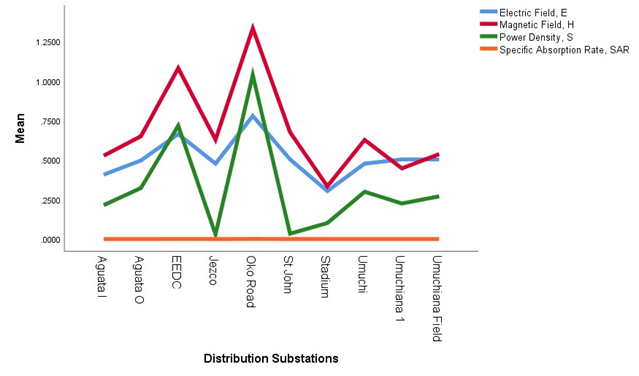
Figure 4: A graph of computed mean variables against the entire ten (10) distribution substation
Figure 4 displays the composite graph of the calculated mean values of Electric fields, Magnetic fields, Power density and Specific absorption rate at the ten (10) different locations within Aguata LGA, emanating from an 11KV Distribution voltage line.
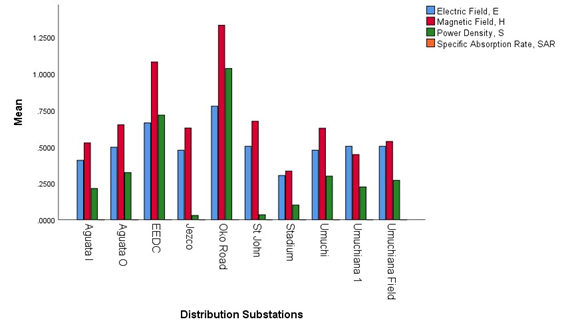
Figure 5: Combined mean Variation of the variables against the ten (10) different locations for 11KV Distribution substation
The Combined Variation of Electric field, Magnetic Field, Power density and Specific Absorption Rate from different locations for 11KV Distribution substation are shown in figure 5.
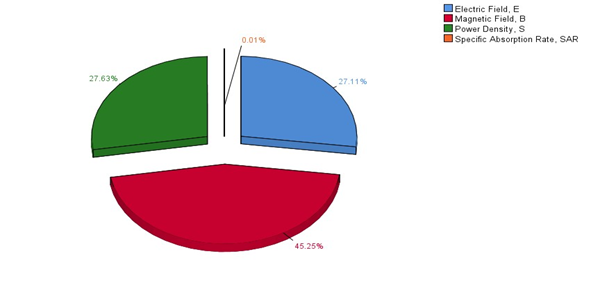
Figure 6: Total percentages of all the variables for the Distribution substations
Figure 6 displays the cumulative percentages of the measured data for the 11KV distribution substation at different locations.
Table 4: Analysis of Variance (ANOVA) for Electric Field, Magnetic Field, Power Density, and Specific Absorption Rate across different locations
| Variable | Source | SS | df | MS | F | p |
| Electric Field (V/m) | Between Groups | 0.151 | 9 | 0.017 | – | – |
| Within Groups | – | – | – | – | – | |
| Total | 0.151 | 9 | – | – | – | |
| Magnetic Field (A/m) | Between Groups | 0.810 | 9 | 0.090 | – | – |
| Within Groups | – | – | – | – | – | |
| Total | 0.810 | 9 | – | – | – | |
| Power Density (W/m²) | Between Groups | 0.907 | 9 | 0.101 | – | – |
| Within Groups | – | – | – | – | – | |
| Total | 0.907 | 9 | – | – | – | |
| Specific Absorption Rate (W/Kg) | Between Groups | 0.000 | 9 | 0.000 | – | – |
| Within Groups | – | – | – | – | – | |
| Total | 0.000 | 9 | – | – | – |
Electric Field
Moving on to the electric field measurements, we observed variations in intensity across the different substation locations. The EEDC Office registered the highest value (0.6633 V/m), while the Stadium exhibited the lowest (0.3033 V/m). Figure 4 and 5 shows varying electric field intensity across distribution substation locations (in line graph bar graph), with EEDC Office and Oko Road having higher levels and stadium having the lowest average strength, indicating regional variations. It is worth noting that these values are significantly lower compared to a study conducted in Calabar Metropolis, where the highest recorded electric field reached 1.601 V/m (Inyang et al., 2018). More importantly, all measured values fall well below the exposure standards established by the International Commission on Non-Ionizing Radiation Protection (ICNIRP).
Magnetic Field
Similar trends were observed with the magnetic field intensity. Oko Road displayed the highest measurement (1.3317 A/m), contrasting with the Stadium’s lowest value (0.3333 A/m). These values fall within the range of 3.5 x 10⁴ A/m to 8.75 x 10⁴ A/m as outlined by ICNIRP, suggesting a minimal risk of exposure. This finding aligns with another study in Kano metropolis, where the average magnetic field exposure was less than 0.16 A/m. Also, the bar chart shows fluctuations in power density and magnetic field intensity, with the strongest magnetic field strength at Oko Road (Usman, & Usman 2015).
Power Density
Oko Road again emerged with the highest power density (1.0365 W/m2), indicating a high rate of energy transmission at this location. The Stadium, on the other hand, had the lowest measured power density (0.1011 W/m2). For comparison, a separate study reported Housessories Restricted Sub-station as having the highest power density (0.89 W/m2), while Top Highflyer Secondary School had the lowest (0.368 W/m2). It’s important to emphasize that all these values fall within the ICNIRP’s moderate risk limit of 10 W/m2 to 50 W/m2, signifying no potential health risks associated with exposure (Adekunle et al., 2022).
Specific Absorption Rate (SAR)
The Specific Absorption Rate (SAR) values exhibited a different pattern. Ranging from 7.11 x 10⁻⁶ W/kg to 4.68 x 10⁻⁵ W/kg, these values remained relatively consistent across all the measured locations. This consistency suggests a similar potential influence on human tissues, regardless of the variations observed in the electric and magnetic fields. Compared to another study, the SAR values in this investigation were lower than those measured in residential and public places. While the obtained SAR values are somewhat higher than those reported in some studies, it’s crucial to note that all recorded values in both studies are well below the international safety limits set for public exposure. Due to the close proximity and concentration of electromagnetic sources in public areas, however, continuous monitoring is recommended to ensure ongoing safety, especially in constantly evolving metropolitan environments (Avwiri, G., & Agbalagba 2015).
Table 4 shows the distribution of electromagnetic characteristics in distribution substations, with the magnetic field affecting over 50% of conditions. Regulation is necessary due to electric field and power density impacts. Specific Absorption Rate only affects 0.01% of total exposure.
Statistical Analysis
Figure7, shows the output of ANOVA test, a one-way analysis of variance (ANOVA) was used to examine, at various sites, the Electric Field (V/m), Magnetic Field (A/m), Power Density (W/m²), and Specific Absorption Rate (W/kg). The zero within-group variation in the data meant that neither the F-value nor the p-value was given. This lack of within-group variability suggests that the data points within each location were identical. The total squares of the electric field (V/m) were 0.151, and the magnetic fields (A/m) were 0.810, 0.090, 0.907, and 0.000, respectively.
Implications for Health Hazards and Regulatory Guidelines
The study reveals that the electric, magnetic field, and power density values in Aguata LGA are below the safety standards established by the International Commission on Non-Ionizing Radiation Protection (ICNIRP), suggesting a low risk of health hazards from exposure. However, variations in EMF intensity across different substation locations, such as Oko Road and Stadium, highlight the importance of site-specific measurements to accurately assess potential health risks.
SAR values remained relatively consistent across locations, reflecting the rate at which the human body absorbs electromagnetic energy. The potential influence on human tissues seems consistent, but further investigation might be necessary to understand the long-term health implications of these SAR levels, especially for individuals spending extended periods near substations.
The study results are consistent with ICNIRP guidelines, suggesting that current operational practices do not pose an immediate public health threat from EMF exposure. However, ongoing research on non-thermal health effects from chronic low-level EMF exposure is ongoing, and while the current situation seems safe based on ICNIRP guidelines, a more comprehensive approach to public health protection might be warranted (Ubhenin et al., 2024).
To ensure public trust, sharing the study’s results with the public in a clear and understandable manner can help alleviate concerns about EMF exposure near substations. A precautionary principle could be adopted, exploring ways to further minimize public exposure in the long term, such as planting trees around substations to act as natural barriers. Regular monitoring is crucial to ensure safety standards continue to be met. Further investigation is needed to investigate potential long-term health effects of observed SAR levels, explore the potential influence of non-thermal EMF effects on public health in Aguata LGA, and analyze the cost-effectiveness of implementing precautionary measures to further minimize public exposure.
CONCLUSION
A study on electromagnetic field (EMF) exposure in Aguata LGA substations found that measured EMF values fell below the International Commission on Non-Ionizing Radiation Protection (ICNIRP) safety limits. However, variations in EMF intensity across different locations suggested the need for site-specific measurements. The Specific Absorption Rate (SAR) values remained consistent across locations, suggesting similar potential effects on human tissues. The study highlights the need for a more comprehensive approach to public health protection and the importance of site-specific measurements for accurate risk assessment. It also emphasizes the need for more research on the potential non-thermal health effects of EMFs, considering the limitations of current ICNIRP guidelines. The findings have potential implications for policy and regulation, including a precautionary principle, continuous monitoring of EMF levels, and revising existing safety regulations to account for non-thermal health effects. Future research could address these limitations by expanding the study to a larger region, using longitudinal design, incorporating control groups, and integrating personal EMF exposure monitoring devices.
Disclaimer
There is absolutely no conflict of interest between the authors and the producers of the products because we do not intend to use these products as an avenue for any litigation but for advancement of knowledge.
Consent
It is not applicable.
Ethical Approval
It is not applicable.
Competing Interests
Authors have declared that no competing interests exist.
REFERENCES
- Clegg, F. M., Sears, M., Friesen, M., Scarato, T., Metzinger, R., Russell, C., Stadtner, A., & Miller, A. B. (2020). Building science and radiofrequency radiation: What makes smart and healthy buildings. Building and Environment, 176, 106324.
- Levitt, B. B., Lai, H. C., & Manville, A. M. (2021). Effects of non-ionizing electromagnetic fields on flora and fauna, Part 3. Exposure standards, public policy, laws, and future directions. Reviews on Environmental Health, 37(4), 531–558.
- López, I., Rivera, M., Félix, N., & Maestú, C. (2022). It is mandatory to review environmental radiofrequency electromagnetic field measurement protocols and exposure regulations: An opinion article. Frontiers in Public Health, 10.
- Ijabor, B. O., Nwabuoku, A. O., Izediunor, V. C., Odene, C. C., Agbonaye, I., Ebite, E. C., & Elumeshike, C. S. (2023). Assessment of Radiation Risk from Selected Telecommunication Base Station in Ogwashi-Uku, Delta State, Nigeria. OALib, 10(03), 1–12.
- Ojuh, O., & Isabona, J. (2015). Radio Frequency EMF Exposure due to Gsm Mobile Phones Base Stations: Measurements and Analysis in Nigerian Environment. Nigerian Journal of Technology, 34(4), 809.
- Onochie, u, Egware, H., & Eyakwanor, T. (2015). The Nigeria Electric Power Sector (Opportunities and Challenges). Journal of Multidisciplinary Engineering Science and Technology (JMEST), 2(4).
- Raj, A., Lee, C., & Sidek, M. (2020). Protection against EMF at Transmission Line and Tower. 2020 IEEE International Conference on Power and Energy (PECon).
- Guidelines for Limiting Exposure to Electromagnetic Fields (100 kHz to 300 GHz). (2020). Health Physics, 118(5), 483–524.
- Hardell, L., & Sage, C. (2008). Biological effects from electromagnetic field exposure and public exposure standards. Biomedicine & Pharmacotherapy, 62(2), 104–109.
- Karine. (2020). ICNIRP.https://www.icnirp.org/en/activities/news/news-article/rfguidelines-2020-published.html
- Akanwa, A. (2018). Changing Climate and the Effect of Gully Erosion on Akpo Community Farmers in Anambra State, Nigeria. Journal of Ecology & Natural Resources, 2(6).
- Amuji, o, Nwachi, C., Tasie, N., Mbachu, C., & Owolabi, T. (2023). Correlation Analysis of Enugu Electricity Distribution Company’s Electricity Bill. Greener Journal of Science, Engineering and Technological Research, 12(2276–7835), 11–19.
- “R&D 3 in 1 EMF Meter, EF, MF, RF – ExtremeMeters.com” n.d., Extreme Meters LLC., viewed <https://www.extrememeters.com/en-wo/products/r-d-3-in-1-emf-meter-ef-mf-rf>.
- “Mileseey Gps/plough Land Meter Mc8042 Handheld Gps Area Meter Teste…” n.d., Fruugo, viewed <https://www.fruugonorge.com/mileseey-gpsplough-land-meter-mc8042-handheld-gps-area-meter-tester-land-measuring-instrument-plough-navigation-land-area-meter/p-202589086-430936556?language=en>.
- Njoku, I. J., E. Orji, C., C. Mbamala, E., M. Ukewuih, U., P. Onyeneg, C., & Orji, O. (2022). Assessing the Health Risk Due to Exposure to Non-Ionizing Radiation in the Form of Magnetic Field from Electrical Power Substations. Journal of Applied Sciences, 22(4), 187–195.
- Zhukovskiy, Y.L., Kovalchuk, M.S., Batueva, D.E. & Senchilo, N.D. 2021, “Development of an Algorithm for Regulating the Load Schedule of Educational Institutions Based on the Forecast of Electric Consumption within the Framework of Application of the Demand Response,” Sustainability, vol. 13, no. 24, p. 13801.
- Inyang, P., Inyang, P., William, S., Ushie, O., & Oteikwu, A. (2018). Measurement of Electric Field Radiation from 11KVA High Tension Power Line and Its Environmental Effects in Calabar Metropolis, Nigeria. Physical Science International Journal, 18(2348– 0130), 1–6.
- Usman, O., & Usman. (2015). Assessment of Magnetic Field Effects and Estimation of Associated Current Density of Electrical Injection Substations in Kano Metropolis. Advances in Physics Theories and Applications, 50(2225–0638).
- Adekunle, A., Ugonna, M., Olaifa, O., & Olumide, O. O. (2021, April 1). Estimation of EMF Parameters from Distrbution Transformers and Their Impacts on Selected Health Indicators of Building Residents: Case Study of Ejigbo Environs, Isolo, Lagos State, Nigeria. IOP Conference Series: Materials Science and Engineering, 1107(1), 012085.
- Avwiri, G., & Agbalagba, O. (2015). Examining The Emf Exposure Effects of Gsm Mast Antennas and The HighTension Electric Cables on The Environmnet of Delta Park of University of Port Harcourt, Rivers State. Journal of Multidisciplinary Engineering Science and Technology (JMEST), 2(11).
- Ubhenin, A.E., Isabona, J., Anura, F. & Idris, R.I. 2024, “Unraveling the Impact of Electromagnetic Radiation on Human Health: A Comprehensive Review,” African Journal of Pharmaceutical Research and Development (AJOPRED), vol. 16, no. 1, pp. 91–9.
- Seybold, J. S. (2005). Introduction to RF Propagation. John Wiley & Sons. http://books.google.ie/books?id=4Ltmj GNwOPIC & printsec=frontcover & dq=Introductio n+to+RF+propagation& hl=& cd=1&source=gbs api