
Evaluation of Phytochemical and Antidiabetic Potentials of Aqueous, Ethanol, and Acetone Crude Extracts of Plectranthus Neochilus Leaves on Alloxan Induced Diabetic Wistar Rats.
- Ephraim O. Abu
- Alexander O. Edah
- 16-28
- Feb 28, 2024
- Chemistry
Evaluation of Phytochemical and Antidiabetic Potentials of Aqueous, Ethanol, and Acetone Crude Extracts of Plectranthus Neochilus Leaves on Alloxan Induced Diabetic Wistar Rats.
Ephraim O. Abu1, Alexander O. Edah2
1Department of Chemistry, Faculty of Natural Sciences,
University of Jos, Nigeria
2Department of Pharmaceutical Chemistry, Faculty of Pharmaceutical Sciences,
University of Jos, Nigeria
DOI: https://doi.org/10.51584/IJRIAS.2024.90203
Received: 23 January 2024; Accepted: 27 January 2024; Published: 28 February 2024
ABSTRACT
Diabetes mellitus is a metabolic disorder which leads to abnormally high blood glucose level (hyperglycemia). This research work is aimed at evaluating the antidiabetic potentials of aqueous, ethanol and acetone extracts of plectranthus neochilus leaves on alloxan induced diabetic wistar rats.
Materials and Methods: The experimental rats were induced and made diabetic by single intra-peritoneal administration of Alloxan monohydrate at a dose rate of 150 mg/kg dissolved in 0.9% freshly prepared normal saline at pH 5.5. Sixty-five adult (male) albino rats weighing 160-200g were used for this study. The Animals were divided into 12 groups of 5 rats each namely: A: Normal control, B: Diabetic control 150kg/body weight of alloxan, C: Diabetic + 1000mg/kg body weight of Standard drug (Metformin), D: Diabetic + 250mg/kg body weight of aqueous extract, E: Diabetic + 500mg/kg body weight of aqueous extract, F: Diabetic + 1000mg/kg body weight of aqueous extract, G: Diabetic + 250mg/kg body weight ethanol extract, H: Diabetic + 500mg/kg body weight of ethanol extract, I: Diabetic + 1000mg/kg body weight of ethanol extract, J: Diabetic + 250mg/kg body weight of acetone extract, K: Diabetic + 500mg/kg body weight of acetone extract, L: Diabetic + 1000mg/kg body weight of acetone extract. The extracts were administered orally for a duration of 28days at doses of (250, 500, and 1000 mg/kg body weight).
Results: Treatment with extracts significantly reduced (p<0.05) elevated blood glucose level associated with alloxan induced diabetic (27.85±0.95) rats in the aqueous extract (5.90±0.10), ethanol extract (10.15±4.35) but no significant ameliorative effect with the acetone extract (23.35±2.82) at dosage of 1000mg/kg body weight. The aqueous extract significantly reduced (p<0.05) elevated blood glucose level more when compared to the normal control (5.85±0.05) rats as when compared to the ethanol and acetone extracts at dose 1000mg/kg body weight.
Conclusion: The blood glucose data obtained using Alloxan hyperglycaemic rats clearly shows that the crude aqueous extract has better anti-diabetic effect at dose of 1000mg/kg, followed by the ethanol extract and then the acetone extract in the 28 days of treatment, the ameliorative effect is also dose dependent. Thus, the leaves caused significant and consistent reductions in diabetic drug-induced hyperglycaemia in albino rats.
Keywords– Antidiabetic, Plectranthus neochilus, Alloxan, Wistar rats, Diabetes Mellitus, Metformin.
INTRODUCTION
Diabetes mellitus (DM) is a chronic disease characterized by a progressive increase in blood glucose levels [1]. DM is a group of metabolic alterations that not only affect carbohydrate metabolism but protein and fat metabolisms as well. A recent report about the prevalence of DM across the globe estimates that ~463 million people are currently affected by DM. This report also proposes the figure may rise up to 10.2% (578 million by 2030) and 10.9% (700 million by 2045), respectively [2]. DM usually develops due to deficiency or lack of insulin secretion or may be also due to the diminished ability of the cells to utilize the insulin [3]. DM is considered to be the most important predisposing factor for the development of various clinical conditions such as ischemic heart diseases, peripheral neuropathies, ulcerations, and delayed wound healings, consequently affecting the life expectancy of the patients [4]. Various experimental and clinical studies suggest the involvement of free radicals in the progression of DM and its complications [5–7]. The damage of β-cells of the pancreas may be caused due to the formation of free radicals and/or alternation of their endogenous scavengers [8]. The prevalence of diabetes mellitus, which increases by 90–95%, is type 2 DM (T2DM), known as non-insulin-dependent diabetes. The inefficient use of insulin by the body is due to the reduced response of target tissues to regular circulating insulin levels [9]. The most commonly prescribed medication for T2DM is metformin [10]. Metformin’s mechanism increases insulin sensitivity and high-density lipoprotein (HDL) levels, reduces triglyceride and low-density lipoprotein (LDL) levels, and ultimately reduces blood glucose levels [11]. The most common side effects are gastrointestinal symptoms, which include nausea and vomiting. The most severe side effect is lactic acidosis, specifically in diabetic patients with hepatic and renal dysfunction [10]. This side effect requires specific attention because it takes a long time to treat DM.
Effective treatment of DM is considered to be an important task for the medical community because most of the currently available drugs have various adverse effects [12]. Various studies have analyzed the alternatives for the treatment of DM that have similar therapeutic efficacy to that of conventional therapeutic agents but without causing significant adverse effects [12–14]. However, no alternative treatment options have been recommended to date for treating DM. Ethno-botanical knowledge includes ~1200 species of medicinal plants that have the potential to treat DM and its complications [13].
Several plants have hypoglycemic properties, therefore, they can become a source of new drugs to complement oral hypoglycemic agents in the management of DM. Their biological activity is related to their chemical composition. Plants rich in secondary metabolites such as phenol compounds, glycosides, flavonoids, alkaloids, steroids, and terpenoids, tend to lower blood glucose levels. [15-17].
The Plectranthus genus, comprising more than 300 species distributed through tropical and subtropical areas of Africa, Asia, Oceania and South America, belongs to the Lamiaceae family, which includes some well-established medicinal genus such as mint (Mentha), sage (Salvia) and thyme (Thymus). The Plectranthus species are commonly used as medicinal plants targeting infectious, dermatologic and gastrointestinal pathologies [18]. A number of work has been done on its dermatological, gastrointestinal, flavoring, antiseptic, repellent, dental effects, carcinogenic effect of its oil, but such information is dearth on its anti-diabetic (hypoglycemic) potential especially this species- Plectranthus neochilus (Schltr.).
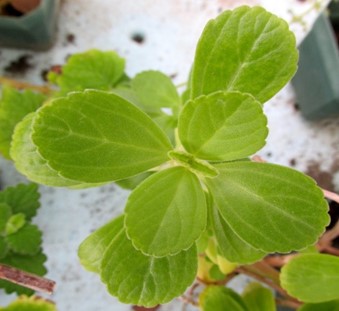
Fig. I Adult plant of Plectranthus neochilus Schltr.
MATERIALS AND METHODS
The plant Plectranthus neochilus was collected in the month of September, 2019 from No. 1 Museum Street, Jos North, (Coordinates, Latitude 9°54’49.4″ N, Longitude 8°53’11.6″ E) Jos, Plateau State Nigeria. The authenticity of the plant was confirmed from the deposited specimen at the Herbarium Unit of the Department of Plant Science, University of Jos with Voucher number JUHN 21000343.
- Preparation of the Plant Sample and Extracts
The fresh leaves of Plectranthus neochilus were washed under running tap water, shade dried at room temperature at about 20 to 25 degrees Celsius for 2 weeks and then pulverized to a fine sample by an electric blender and transferred into airtight containers with proper labeling for use.
260g of the plant powder was weighed into 500ml conical flasks and was soaked in ethanol (100%). This was left to stand overnight(s) (72hrs) and shake for 3hrs on a mechanical shaker. The content was filtered using a non-absorbent cotton wool on a Buchner funnel/flask using a vacuum pump. The residue was subjected to several parts of rinsing and filtration with fresh solvent to attain some level of exhaustive maceration (extraction). The collected filtrate was evaporated to dryness using a rotary evaporator and a drying cabinet at a controlled temperature of 60oC. Same procedure was carried out for 260g of the pulverized sample soaked in acetone (100%), the filtrate was concentrated using a rotary evaporator and a drying cabinet at a controlled temperature of 50oC. In like manner, 200g of the powder was soaked in water and exhaustive extraction was carried out, the filtrate was concentrated using a rotary evaporator and a drying cabinet at a controlled temperature of 60oC.
- Experiment on Animal model
After getting the ethical clearance, sixty (60) white albino rats (male wistar strain) weighing about 160-200g body weight were purchased from the animal house of the University of Jos, Nigeria. Before starting the experiment the rats were acclimatized for 7 days. They were maintained at room temperature with 12h/12h light and dark cycle kept in polypropylene cages and were allowed free access to standard pellet feed (purchased from Grand Cereals and Oil Mills Ltd, Bukuru, Jos, Nigeria) and water ad libitum.
- Chemicals, Drugs and Reagents
Alloxan was obtained from National Vetenary Research Institute, Vom, Jos. All other reagents and chemicals were of analytical grade, products of Sigma U.S.A –Aldrich: obtained from reputable scientific and chemical companies.
- Experimental Design
The animals were grouped into twelve (12) with each group having five (5) rats each:
Group A: Normal control (NC) provided with lab feed pellet and drinking water
Group B: Diabetic control (DC) given 150kg/body weight dose of alloxan
Group C: Diabetic rats treated with 1000mg/kg body weight dose of Standard drug (Metformin)
Group D: Diabetic rats treated with 250mg/kg body weight dose of aqueous extract
Group E: Diabetic rats treated with 500mg/kg body weight dose of aqueous extract
Group F: Diabetic rats treated with 1000mg/kg body weight dose of aqueous extract
Group G: Diabetic rats treated with 250mg/kg body weight dose of ethanol extract
Group H: Diabetic rats treated with 500mg/kg body weight dose of ethanol extract
Group I: Diabetic rats treated with 1000mg/kg body weight dose of ethanol extract
Group J: Diabetic rats treated with 250mg /kg body weight dose of acetone extract
Group K: Diabetic rats treated with 500mg/kg body weight dose of acetone extract
Group L: Diabetic rats treated with 1000mg/kg body weight dose of acetone extract
- Induction of Diabetes in Rat
Before inducing diabetes the blood glucose level of the rats was checked by taking blood from their tail vein. This was done using One-Touch glucometer and the rats were fasted overnight. Next morning, diabetes was induced by giving intraperitoneal (Ip) injection of a solution of alloxan monohydrate (150mg/kg) in 0.9% saline NaCl solution. After 48 hours the blood glucose levels of the rats were checked to confirm diabetes. The rats whose blood glucose level was more than 180mg/dl were considered diabetic.
- Dose of extracts
(250, 500, and 1000 mg/kg body weight) of the extracts was mixed with 2% suspension of tween-80 and given orally to each rat of nine (9) groups ( D – L ) for 28 days.
- Dose of Standard drug
1000mg/Kg of metformin was solubilized in distilled water and given orally to each rat of group C for 28 days.
- Collection of blood sample (for blood glucose and biochemical parameters studies):
On day 28 the blood was collected from the tail of rats to check the improvement in their blood glucose level. The animals were sacrificed by decapitation after completion of experiment and their blood stored in K3-EDTA plain vacutainers. The blood collected on last day of experiment was utilized for the study of biochemical parameters. The parameters measured include Serum total Protein (TP), Serum Albumin (ALB), Serum total bilirubin (TB), conjugated bilirubin (CB), Total Cholesterol (TC), Triglycerides (TG), High Density Lipoprotein (HDL), Low Density Lipoprotein (LDL), Aspartate transaminase (AST), Alanine transaminase (ALT), Alkaline phosphatase (ALP), Urea, Uric Acid, Creatinine, Sodium (Na+), Potassium (K+), Bicarbonate (HCO3), Chlorine (Cl–), White blood cells (WBC), Neutrophil (NEU), Lymphocyte (LYM), Monocytes (MON), Eosinophils (EOS), Basophil (BAS), Red Blood Cells (RBC), Haemoglobin (HGB), Haematocrit (HCT), Platelets (PLT), and Plateletcrit (PCT).
- Statistical Analysis
Data were expressed as mean (of 5 replicates) ± standard error of the mean (SEM). The data was subjected to statistical analysis using the IBM® statistical package for social sciences (SPSS®) software version 21. All significant differences were determined by one-way analysis of variance (ANOVA) while post hoc multiple comparison was done using Duncan’s multiple range test. The level of significance was set at p<0.05.
RESULTS AND DISCUSSION
Table 1 shows the result of the phytochemical screening of the crude extracts of. Plectranthus neochilus S. The result revealed the extraction potential of the solvents (ethanol, acetone, aqueous) and the degree to which the phytochemical constituents are present.
Table 1. Phytochemical Screening Of Aqueous, Ethanol, And Acetone Extract Of Plectranthus Neochilus S.
| Constituents | Ethanol | Acetone | Aqueous |
| Alkaloids | ++ | – | ++ |
| Saponins | + | – | ++ |
| Tannins | ++ | – | +++ |
| Flavonoids | +++ | + | +++ |
| Carbohydrates | +++ | + | ++ |
| Steroids | ++ | ++ | + |
| Terpenes | ++ | +++ | + |
| Anthraquinones | – | – | – |
| Cardiac glycosides | ++ | +++ | + |
KEY
+++: highly present
++: moderately present
+: Low,
– : absent
Table 2 shows the effect of the extracts of Plectranthus neochilus S. on serum glucose, total protein, albumin, total serum bilirubin and conjugated bilirubin. There is a significant (p<0.05) increase in blood glucose level and a significant (p<0.05) decrease in total protein and albumin in the diabetic control group but significant (p<0.05) increase in the conjugated and total bilirubin levels when compared to normal control. There is a significant decrease in the concentration of glucose, conjugated bilirubin and total bilirubin levels but a significant increase in total protein and albumin in all the treatment groups (i.e., Diabetic + standard drug, Diabetic + aqueous extract, Diabetic + ethanol extract and Diabetic + acetone extract, when compared to normal and diabetic control at (p < 0.05).
Table 2. Effect Of Aqueous, Ethanol And Acetone Extracts Of Plectranthus Neochilus S. On Serum Glucose, Serum Total Protein, Serum Albumin, Serum Total Bilirubin And Conjugated Bilirubin In Alloxan Induced Diabetic Rats.
| Treatment | Glucose | TP (g/l) | ALB (g/l) | TB (mg/dl) | CB (Mmol/L) |
| Normal Control | 5.85±0.050a | 77.50±2.500a | 45.50±1.500a | 9.30±0.900a | 4.65±0.450a |
| Diabetic Control | 27.85±0.950b | 58.00±3.000b | 32.00±3.000b | 79.05±11.050b | 45.05±11.050b |
| D + Std (Metformin) | 9.65±6.450a | 68.50±0.500a | 43.50±0.500a | 37.40±7.000c | 18.30±2.100c |
| D + Aqueous 250mg/kg | 23.95±6.450b | 65.00±5.000b | 36.00±4.000b | 72.30±47.900b | 42.65±10.450b |
| D + Aqueous 500mg/kg | 10.80±4.500a | 71.00±3.000a | 40.00±3.000a | 20.40±1.000c | 14.05±0.150c |
| D + Aqueous 1000mg/kg | 5.90±0.100a | 74.00±1.000a | 41.50±0.500a | 14.30±4.100a | 9.65±4.550a |
| D + Ethanol 250mg/kg | 23.35±4.850b | 71.00±2.000a | 36.50±1.500b | 66.35±47.650b | 39.30±3.000b |
| D + Ethanol 500mg/kg | 21.20±4.400b | 70.00±2.000a | 40.00±1.000a | 52.00±4.100b | 27.90±2.500b |
| D + Ethanol 1000mg/kg | 10.15±4.350a | 75.00±3.000a | 42.50±1.500a | 32.20±11.800c | 19.40±1.000c |
| D + Acetone 250mg/kg | 26.65±0.250b | 60.00±4.0300b | 34.00±7.030b | 77.03±9.050b | 44.01±11.000b |
| D + Acetone 500mg/kg | 25.05±0.500b | 62.10±4.050b | 36.60±4.203b | 75.01±4.650b | 41.41±1.090b |
| D + Acetone 1000mg/k | 23.35±2.820b | 63.20±7.020b | 38.30±2.201c | 73.05±3.830b | 39.69±9.0260b |
| p-values | 0.0014 | 0.0190 | 0.0162 | 0.0213 | 0.0454 |
TP- Total protein, ALB- Albumin, CB- Conjugated bilirubin, TB- Total bilirubin
Data are expressed as mean ± SEM; n = 5; Values carrying different superscripts along the columns are significantly different from each other at (p<0.05)
As shown in table 3, when values are compared to diabetic control at p < 0.05, there is a reduction in Total cholesterol, triglyceride and LDL levels and an increase in HDL levels in all the treatment groups when compared to diabetic control group. Result of High-Density Lipoprotein (HDL) shows decrease in diabetic control group when compared to normal control group.
Table 3. Effect Of Aqueous, Ethanol And Acetone Extracts Of Plectranthus Neochilus S On Lipid Profile Parameters In Alloxan Induced Diabetic Rats.
| Treatment | TC
mg/dl |
TG
mg/dl |
HDL
mg/dl |
LDL
mg/dl |
| Normal Control | 2.30±0.100a | 0.95±0.050a | 2.10±0.500a | 0.78±0.105a |
| Diabetic Control | 4.30±2.200b | 1.90±0.300b | 1.00±0.335b | 1.11±0.190b |
| D+Std (metformin) | 2.50±0.300a | 1.01±0.050a | 1.95±0.005a | 0.85±0.100a |
| D+Aqueous 250mg/kg | 3.25±0.450c | 1.70±0.500b | 1.10±0.095b | 1.99±1.015b |
| D + Aqueous 500mg/kg | 3.10±0.100c | 1.00±0.050a | 1.34±0.020c | 1.62±0.390b |
| D + Aqueous 1000mg/kg | 2.75±0.060a | 0.85±0.050a | 1.78±0.800a | 1.01±0.090c |
| D+Ethanol 250mg/kg | 2.70±0.100a | 1.35±0.150c | 1.17±0.130b | 1.02±0.180c |
| D+Ethanol 500mg/kg | 2.55±0.350a | 1.30±0.100c | 1.26±0.045c | 0.92±0.055a |
| D+Ethanol 1000mg/kg | 2.50±0.100a | 1.10±0.200a | 1.98±0.050a | 0.88±0.030a |
| D+Acetone 250mg/kg | 4.00±1.200b | 1.80±0.200b | 1.08±0.015b | 1.90±1.270b |
| D+Acetone500mg/kg | 3.70±1.010c | 1.88±1.708b | 1.13±1.200b | 1.78±1.560b |
| D+Acetone 1000mg/kg | 3.54±0.940c | 1.72±0.800b | 1.40±1.200b | 1.00±0.100c |
| p-values | 0.05341 | 0.0109 | 0.04216 | 0.04800 |
TC- Total Cholesterol, TG- Triglycerides, HDL – High Density Lipoprotein, LDL – Low Density Lipoprotein
Data are expressed as mean ± SEM; n = 5; Values carrying different superscripts along the columns are significantly different from each other at (p<0.05)
Table 4 shows the effect of the aqueous, ethanol and acetone extracts on serum enzymes. When compared to diabetic control at p < 0.05, there is a marked decrease in the serum biomarkers (i.e., ALT, AST and ALP) after treatment.
Table 4. Effect Of Aqueous, Ethanol And Acetone Extracts Of Plectranthus Neochilus S. On Some Serum Enzymes In Alloxan Induced Diabetic Rats.
| Treatment | AST
U/l |
ALT
U/l |
ALP
U/I |
| Normal Control | 56.50±3.500a | 65.50±4.500a | 95.00±2.000a |
| Diabetic Control | 599.50±10.500b | 683.00±6.000b | 687.00±3.000b |
| D+Std (Metformin) | 82.00±10.000a | 116.00±17.000c | 136.00±20.000c |
| D+Aqueous 250mg/kg | 179.50±109.500c | 210.00±121.000d | 312.00±209.000d |
| D+Aqueous 500mg/kg | 62.00±1.000a | 85.00±4.000a | 98.05±0.960a |
| D+Aqueous 1000mg/kg | 46.50±4.500a | 64.00±5.000a | 88.50±0.500a |
| D+Ethanol 250mg/kg | 202.50±70.500c | 258.50±95.500d | 300.50±80.500d |
| D+Ethanol 500mg/kg | 109.00±11.000a | 111.00±33.000c | 132.50±28.500c |
| D+Ethanol 1000mg/kg | 66.00±3.000a | 83.00±3.000a | 100.50±2.500a |
| D+Acetone 250mg/kg | 399.50±3.500c | 580.30±7.400b | 529.50±5.200b |
| D+Acetone 500mg/kg | 289.50±5.900c | 499.50±7.500b | 410.50±9.500b |
| D+Acetone 1000mg/kg | 218.50±10.500c | 312.50±3.500d | 319.50±7.500d |
| p-values | 0.0002 | 0.0003 | 0.0048 |
AST – Aspartate transaminase, ALT- Alanine transaminase, ALP- Alkaline phosphatase
Data are expressed as mean ± SEM; n = 5; Values carrying different superscripts along the columns are significantly different from each other at (p<0.05)
Table 5 shows the effect of the aqueous, ethanol and acetone extracts of Plectranthus neochilus S. on Urea, Creatinine and Uric Acid. When values are compared to diabetic control at (p < 0.05), there is a decrease in serum Urea, Creatinine and Uric Acid of all the treatment groups.
Table 5. Effect Of Aqueous, Ethanol And Acetone Extracts Of Plectranthus Neochilus S. On Serum Urea, Serum Creatinine And Serum Uric Acid Concentrations In Alloxan Induced Diabetic Rats.
| Treatment | Urea | Uric Acid | Creatinine |
| Normal Control | 1.00±0.200a | 312.50±54.500a | 13.00±2.000a |
| Diabetic Control | 5.95±0.050b | 516.00±25.000b | 45.50±1.500b |
| D + Std (Metformin) | 2.15±0.250a | 317.00±42.000a | 18.00±2.000a |
| D+Aqueous 250mg/kg | 2.65±0.250c | 505.00±60.000b | 32.00±9.000c |
| D+Aqueous500mg/kg | 2.30±0.100a | 459.50±6.500b | 25.50±0.500c |
| D+Aqueous1000mg/kg | 1.85±0.050a | 331.00±7.000a | 18.70±1.000a |
| D+Ethanol 250mg/kg | 2.65±0.050c | 469.50±47.500b | 28.00±2.000c |
| D+Ethanol 500mg/kg | 2.20±0.400a | 371.50±91.500c | 26.25±0.250c |
| D+Ethanol 1000mg/kg | 2.15±0.350a | 300.00±46.000a | 22.00±3.000a |
| D+ Acetone 250mg/kg | 2.80±0.500c | 509.50±9.800b | 43.50±6.500b |
| D+Acetone 500mg/kg | 2.50±0.800a | 501.50±8.500b | 37.50±9.509b |
| D+Acetone 1000mg/kg | 2.30±0.950a | 490.80±5.500b | 33.80±4.600c |
| p-values | 0.0054 | 0.0474 | 0.0520 |
Urea, Uric Acid, Creatinine
Data are expressed as mean ± SEM; n = 5; Values carrying different superscripts along the columns are significantly different from each other at (p<0.05)
Table 6 shows the effect of the aqueous, ethanol and acetone extracts of Plectranthus neochilus S. on serum electrolytes. The table shows that there is a decrease in Na+, Cl– and HCO3– but an increase in K+ for some of the treatment groups when compared to the diabetic control at (p < 0.05)
Table 6. Effect Of Aqueous, Ethanol And Acetone Extracts Of Plectranthus Neochilus S. On Some Serum Electrolytes Concentrations In Alloxan Induced Diabetic Rats.
| Group | Na+(mmol/L) | K+(mmol/L) | HCO3(mmol/L) | Cl–(mmol/L) |
| Normal Control | 147.50±0.500a | 4.85±0.250a | 25.00±1.000a | 103.50±1.500a |
| Diabetic Control | 145.00±1.000b | 4.90±0.100b | 31.00±1.000b | 107.50±1.500b |
| D+Std (metformin) | 146.50±0.500 a | 4.81±0.100a | 23.00±1.000a | 97.50±0.500a |
| D+Aqueous 250mg/kg | 135.00±1.000 c | 5.01±1.200b | 24.50±1.500a | 98.50±0.500a |
| D+Aqueous 500mg/kg | 146.00±0.500 a | 5.50±0.500c | 23.50±3.500a | 99.00±7.000a |
| D+Aqueous1000mg/kg | 147.50±1.000a | 4.75±0.850a | 23.00±1.000a | 104.50±1.500a |
| D + Ethanol 250mg/kg | 135.50±2.500 c | 4.85±0.350a | 23.50±0.500a | 100.00±1.000a |
| D+Ethanol 500mg/kg | 136.00±2.000c | 4.83±0.500a | 25.00±1.000a | 101.50±3.500a |
| D+Ethanol 1000mg/kg | 133.00±3.000c | 4.10±0.300d | 23.50±0.500a | 95.00±3.000c |
| D+Acetone 250mg/kg | 146.20±1.700a | 4.90±0.102b | 25.20±1.000a | 100.70±2.500a |
| D+Acetone 500mg/kg | 141.30±8.202b | 4.20±2.200d | 25.01±2.010a | 98.50±1.500a |
| D+Acetone 1000mg/kg | 139.50±5.500b | 5.12±0.106b | 24.60±1.700a | 96.80±0.900c |
| p-values | 0.0051 | 0.0404 | 0.0295 | 0.0386 |
Na+– Sodium, K+– Potassium, HCO3 – Bicarbonate, Cl– – Chlorine
Data are expressed as mean ± SEM; n = 5; Values carrying different superscripts along the columns are significantly different from each other at (p<0.05)
Table 7 shows the result of the haematological screening of the effect of the extracts of Plectranthus neochilus S. on white blood cell (WBC), Neutrophils (NEU) and Lymphocytes (LYM). There is a significant (p < 0.05) increase in white blood cells and Neutrophil levels in diabetic control group when compared to normal control. There is a significant decrease in Lymphocyte in diabetic control group when compared to normal control. There is a significant decrease in White blood cells (WBC), Neutrophils (NEU) but increase levels of Lymphocytes in the treatment groups when compared to the diabetic control. The standard drug group (metformin) shows significant decrease in the white blood cell (WBC) and increase in Neutrophile but significant decrease in Lymphocytes when compared to normal control. Result of the haematological screening of the aqueous, ethanol and acetone extracts and the effect of Plectranthus neochilus S. on Monocytes (MON), Eosinophil (EOS) and Basophiles (BAS) are presented. The result shows a significant increase in Monocytes, Eosinophil and Basophile in the diabetic control group when compared to the normal control group and significant decrease in treatment groups when compared to the diabetic control.
Table 7. Effects Of Aqueous, Ethanol And Acetone Extracts Of Plectranthus Neochilus S. On White Blood Count And Its Parameters Concentrations In Alloxan Induced Diabetic Rats.
| Treatment | WBC | NEU(%) | LYM(%) | MON(%) | EOS(%) | BAS(%) |
| Normal Control | 7.03±2.116a | 10.86±0.318a | 65.36±3.351a | 2.73±2.783a | 0.53±0.120a | 0.00±0.000a |
| Diabetic Control | 18.94±1.280b | 65.70±13.884b | 45.93±14.856b | 6.13±0.348b | 2.73±0.202b | 1.36±0.600b |
| D + Metformin | 6.35±0.158a | 15.63±1.746a | 60.90±0.907a | 3.13±0.866a | 0.36±0.033a | 0.20±0.000a |
| D+Aqueous 250mg | 17.51±1.370b | 51.26±1.648b | 47.23±1.501b | 6.01±0.088b | 1.67±0.371b | 1.96±0.202b |
| D+Aqueous 500mg | 9.88±0.904a | 16.26±0.721a | 59.93±1.411a | 5.10±0.057b | 0.80±0.301a | 0.53±0.000a |
| D+Aqueous 1000mg | 8.12±0.514a | 14.76±1.083a | 61.00±5.201a | 3.01±1.231a | 0.40±0.901a | 0.28±0.000a |
| D+Ethanol 250mg | 16.25±0.019b | 52.26±1.648b | 48.00±1.206b | 5.80±1.111b | 2.60±0.501b | 1.36±0.600b |
| D+Ethanol 500mg | 11.03±0.539c | 25.26±1.648c | 44.20±0.091b | 4.30±1.001c | 1.02±1.802a | 0.76±0.002a |
| D+Ethanol 1000mg | 8.73±1.714a | 17.01±1.708a | 58.03±1.007a | 3.19±1.601a | 1.00±1.001a | 0.36±0.001a |
| D+Acetone 250mg | 17.15±0.264b | 51.06±0.619b | 46.10±0.061b | 6.00±0.001b | 2.50±0.701b | 1.26±0.202b |
| D+Acetone 500mg | 15.10±0.019b | 36.20±1.651c | 48.00±2.501b | 5.80±1.901b | 2.33±1.641b | 1.18±0.709b |
| D+Acetone 1000mg | 13.91±0.924c | 31.00±1.001c | 48.93±0.977b | 5.63±0.088b | 1.96±0.033b | 1.10±0.057b |
WBC- White blood cells, NEU- Neutrophils, LYM- Lymphocyte, MON- Monocytes, EOS- Eosinophils, BAS- Basophile
Data are expressed as mean ± SEM; n = 5; Values carrying different superscripts along the columns are significantly different from each other at (p<0.05)
Table 8 shows the result of the haematological screening of the aqueous, ethanol and acetone extracts. The effect of the extracts of Plectranthus neochilus S. on Red Blood Cells (RBC), Haemoglobin (HGB) and Haematocrit (HCT). The result shows a significant decrease in Red Blood cells (RBC), PCV and Haemoglobin levels (HGB) in the diabetic control group when compared to the normal control group. There is significant increase in the treatment groups for Red Blood cells (RBC), Haemoglobin (HGB) and Haematocrit (HCT). The standard drug (Metformin) shows significant increase in Red Blood cells (RBC), Haemoglobin (HGB) and Haematocrit (HCT) when compared to normal control group. There is significantly increased levels of both Platelets (PLT) and Plateletcrit (PCT) in all the treatment groups when compared to the normal control groups.
Table 8. Effects Of Aqueous, Ethanol And Acetone Extracts Of Plectranthus Neochilus S. On Red Blood Count And Its Parameters Concentrations In Alloxan Induced Diabetic Rats.
| Treatment | RBC | HGB | HCT | PLT | PCT |
| Normal Control | 8.01±0.500a | 15.78±1.019a | 47.50±0.458a | 306.00±5.568a | 0.32±0.036a |
| Diabetic Control | 3.48±0.274b | 6.70±0.550b | 36.83±1.328b | 623.67±18.900b | 0.45±0.087b |
| D + Metformin | 7.45±0.183a | 14.80±0.450a | 45.93±0.845a | 323.00±5.568a | 0.34±0.015a |
| D+Aqueous 250mg | 5.85±0.119c | 6.79±0.120b | 37.93±0.338b | 619.67±1.453b | 0.42±0.040b |
| D +Aqueous 500mg | 6.52±0.610a | 13.78±1.019a | 42.60±2.635a | 373.97±13.289a | 0.36±0.045a |
| D+Aqueous 1000mg | 7.96±0.136a | 14.78±1.019a | 44.53±1.328a | 351.33±7.847a | 0.34±0.018a |
| D +Ethanol 250mg | 3.85±0.119b | 6.92±0.152 b | 38.83±1.782b | 600.00±2.118b | 0.41±0.007b |
| D+Ethanol 500mg | 5.95±0.714c | 9.38±1.019c | 41.93±1.328a | 466.00±1.728a | 0.37±0.087a |
| D+Ethanol 1000mg | 7.15±0.902a | 13.08±1.019a | 44.13±1.826a | 366.00±5.565a | 0.33±0.012a |
| D+Acetone 250mg | 3.52±0.410b | 6.78±1.019b | 36.90±1.028b | 620.10±5.008b | 0.44±0.087b |
| D+Acetone 500mg | 4.85±0.629c | 7.78±1.289b | 38.23±1.858b | 598.01±2.123b | 0.41±0.218b |
| D+Acetone 1000mg | 5.32±0.068c | 8.83±0.202b | 39.50±0.556b | 575.67±7.446b | 0.39±0.824b |
RBC-Red Blood Cells, HGB-Haemoglobin, HCT-Haematocrit, PLT-Platelets and PCT-Plateletcrit
Data are expressed as mean ± SEM; n = 5; Values carrying different superscripts along the columns are significantly different from each other at (p<0.05).
The results obtained in this studies indicates that the leaf extract of Plectranthus neochilus has rich phytochemical constituents and one or more of these constituent(s) may be responsible for the hypoglycemic activity. Reference [19] reported that flavonoids are frequently found in plants with hypoglycemic activity. The presence of cardiac glycosides is also known to reduce the effect of diabetic complication [20]. Also reported are saponins, steroidal glycosides with hypoglycemic effect [21]. A study was carried out to assess the safety of these extracts before the animals were treated with a daily administration of 250mg/kg, 500mg/kg, and 1000mg/kg of the extracts. The aqueous and ethanol crude extracts of the plant has shown to be more active than the acetone extract. But a more significant effect was observed in the aqueous extract at higher dose when compared to ethanol and acetone extracts. Medicinal plants that exhibits anti diabetic activity usually possess active substance which are able to mimic the action of insulin or which exert similar effect on the beta-cells of the pancreas causing them to synthesize and secrete insulin. Saponins are known to possess blood cholesterol lowering activity [22].
CONCLUSIONS
The blood glucose data obtained using Alloxan hyperglycaemic rats Table 2 clearly shows that the crude aqueous extract has better anti-diabetic effect at dose of 1000mg/kg, followed by the ethanol extract and then the acetone extract in the 28 days of treatment, the ameliorative effect is also dose dependent. Thus, the leaves caused significant and consistent reductions in diabetic drug-induced hyperglycaemia in albino rats, the current research contribute to an insight of the prevailing perception of the efficiency of plants commonly adopted in Nigeria as a dietary supplement or ancillary therapy for the preclusion and remedy of diabetes mellitus, hence, authenticates the traditional claim regarding plectranthus neochilus anti-diabetic potential. The extract(s) also exhibited an enhancement or shift in the biochemical parameters assessed. This extensive study can serve as an efficient means for the nomination of plants extract having an intense potential for the unbolting of novel anti-diabetic agents.
CONFLICT OF INTEREST
The authors declare no conflict of interest.
ACKNOWLEDGMENT
The authors acknowledge University of Jos, the animal ethic committee for granting this study. We are very grateful to the members of pharmacognosy Laboratory, Faculty of pharmaceutical sciences, University of Jos, for their support.
REFERENCES
- World Health Organization, (2016). Global Report on Diabetes. World Health Organization, France.
- Saeedi, P., Petersohn, I., Salpea, P., Malanda, B., Karuranga, S., Unwin, N., Colagiuri, S., Guariguata, L., Motala, A.A. & Ogurtsova, K. (2019). Global and regional diabetes prevalence estimates for 2019 and projections for 2030 and 2045: Results from the International Diabetes Federation Diabetes Atlas. Diabetes Res. Clin. Pract. 157, 107843.
- Acharjee, S., Ghosh, B., Al-Dhubiab, B.E. & Nair, A.B. (2013). Understanding type 1 diabetes: Etiology and models. Can. J. Diabetes. 37, 269–276.
- Chawla, A., Chawla, R. & Jaggi, S. (2016). Microvasular and macrovascular complications in diabetes mellitus: Distinct or continuum? Indian J. Endocrinol. Metab. 20, 546–551.
- Volpe, C.M.O., Villar-Delfino, P.H., Dos Anjos, P.M.F. & Nogueira-Machado, J.A. (2018). Cellular death, reactive oxygen species (ROS) and diabetic complications. Cell Death Dis. 9, 119.
- Asmat, U., Abad, K. & Ismail, K. (2016). Diabetes mellitus and oxidative stress—A concise review. Saudi. Pharm. J. 24, 547–553.
- Gupta, S., Nair, A., Jhawat, V., Mustaq, N., Sharma, A., Dhanawat, M. & Khan, S.A. (2020). Unwinding Complexities of Diabetic Alzheimer by Potent Novel Molecules. Am. J. Alzheimers Dis. Other Demen. 35.
- Gerber, P.A. & Rutter, G.A. (2017). The Role of Oxidative Stress and Hypoxia in Pancreatic Beta-Cell Dysfunction in Diabetes Mellitus. Antioxid. Redox Signal. 26, 501–518.
- Salehi, B., Ata, A., Kumar, N.V.A., Sharopov, F., Ramírez-Alarcon, K., Ruiz-Ortega, A. & Sharifi-Rad, J. (2019). Antidiabetic potential of medicinal plants and their active components. Biomolecules 9 (551), 1–121.
- Wang, Y.W., He, S., Feng, X., Cheng, J., Luo, Y., Tian, L. & Huang, Q. (2017). Metformin: a review of its potential indications. Drug Des. Dev. Ther. (II), 2421–2429.
- Schofield, J.D., Liu, Y., Rayaz, P.R., (2016). Diabetes dyslipidemia. Diab. Ther. 7 (2), 203–219.
- Chaudhury, A., Duvoor, C., Reddy Dendi, V.S., Kraleti, S., Chada, A., Ravilla, R., Marco, A., Shekhawat, N.S., Montales, M.T. & Kuriakose, K. (2017). Clinical Review of Antidiabetic Drugs: Implications for Type 2 Diabetes Mellitus Management. Front. Endocrinol. 8, 6.
- Salehi, B., Ata, A., V Anil Kumar, K., Sharopov, F., Ramírez-Alarcón, K., Ruiz-Ortega, A., Abdulmajid Ayatollahi, S., Tsouh Fokou, P.V., Kobarfard, F. & Amiruddin Zakaria, Z. (2019). Antidiabetic Potential of Medicinal Plants and Their Active Components. Biomolecules. 9, 551.
- Choudhury, H., Pandey, M., Hua, C.K., Mun, C.S., Jing, J.K., Kong, L., Ern, L.Y., Ashraf, N.A., Kit, S.W. & Yee, T.S. (2018). An update on natural compounds in the remedy of diabetes mellitus: A systematic review. J. Tradit. Complementary Med. 8, 361–376.
- Preethi, P.J. (2013). Herbal medicine for diabetes mellitus: a review. AJP Res. 3 (2), 57–70.
- Rosalie, I.O. & El, E. (2016). Antidiabetic potentials of common herbal plants and plant products: a glance. Int. J. Herb. Med. 4 (4), 90–97.
- Salehi, B., Ata, A., Kumar, N.V.A., Sharopov, F., Ramírez-Alarcon, K., Ruiz-Ortega, A. & Sharifi-Rad, J. (2019). Antidiabetic potential of medicinal plants and their active components. Biomolecules 9 (551), 1–121.
- Lukhoba, C.W., Simmonds, M.S.J. & Paton, A.J. (2006). Plectranthus: A review of ethno botanical uses. Journal of Ethno pharmacology. 103, 1–24.
- Erah, O.P. (1994). Diabetes in Medicine. Review. 6-8.
- Swanston-Flat, S.K., Day, C., Bailey, C.J. & Flatt, P.R. (1990). Traditional plant treatment for diabetes: studies in normal and streptozotocin diabetic mice. Diabetologia 33: 462-464.
- Bailey, C.J. & Day, C. (1989). Traditional plant medicines as treatments for diabetes. Diabetes Care. (8):553-64. doi: 10.2337/diacare.12.8.553. PMID: 2673695.
- Sidhu, G.S. & Oakenful, D.G. (1986). A mechanism for the hypocholesterolemic activity of saponins. J. Nutr. 55: 643-649.