
Evaluation of Soil Erodibility Potential of the Geologic Formations in Awka Capital Territory South Eastern Nigeria Using the Universal Loss Equation Parameters
- Onuchukwu Ejikeme Elozona
- Njoku Adaora Olivia
- Anozie Humphrey Chukwuma
- Ahaneku Chibuzor Valeria
- Anumaka Collins
- Odinye Arinze
- Madu Francis
- 28-37
- Jul 27, 2024
- Environment
Evaluation of Soil Erodibility Potential of the Geologic Formations in Awka Capital Territory South Eastern Nigeria Using the Universal Loss Equation Parameters
Onuchukwu Ejikeme Elozona*, Njoku Adaora Olivia, Anozie Humphrey Chukwuma, Ahaneku Chibuzor Valeria, Anumaka Collins, Odinye Arinze and Madu Francis
Department of Geology, Faculty of Physical Sciences, Nnamdi Azikiwe University, Awka
*Corresponding Author
DOI: https://doi.org/10.51584/IJRIAS.2024.907004
Received: 27 May 2024; Revised: 18 June 2024; Accepted: 22 June 2024; Published: 27 July 2024
ABSTRACT
A survey was carried out on soil erodibility in the territory of the capital city of Awka in the southeast of Nigeria. The study aims to assess and document the soil erosion potential in the face of growing population and environmental challenges. The erodibility potential of the study area was assessed using the Universal Soil Loss Equation (USLE) and United States Department of Agriculture (USDA) tools. A total of twenty-five (25) sample locations points was used for this study and the Arc-GIS tool was also used to assist in the field for this estimation using the erodibility indicators of the World Bank. The USLE value calculated was 672, indicating high erodibility erodibility, while the USDA forecast was Category IV. Using both the USLE and the USDA tools’ threshold, the area is concluded to be highly erodible and having high erosion risk. Both models indicated that the samples reached a highly erodible threshold. High soil erodibility index is therefore observed as a critical problem in the study area. The study recommends integrated catchment management planning which will involve a wholistic storm water master planning, vegetation, controlled land use etc to conserve soil in the study area.
Keywords: Erodibility, USLE, RUSLE, Indicators, buffer.
INTRODUCTION
Erodibility is the inherent yielding or non-resistance of soils and rocks to erosion (NEWMAP, 2015). High erodibility means that the same amount of work in the erosion processes results in greater material removal. Various studies have been conducted on erosion and water quality in the region, and stakeholders have predicted that massive land degradation is imminent unless monitoring and mitigation are strengthened. In designing this work, the researchers considered the general environmental and sanitary situation in the area, taking into account that the area has shallow wells that are easily exposed to contamination from surface agents (Ifekandu et al; 2015). Attention was also paid to the various canyons emerging in different parts of the project area and their impact on the water quality in their immediate surroundings.
GEOLOGY OF STUDY AREA
The roughly triangular Anambra sedimentary basin is in southern Nigeria. It is one of the largest sedimentary basins in Nigeria. Other basins include the Niger Delta Basin, the Benue Trough, and the Benin Basin. Others in the north include the Nupe/Bida Basin, Sokoto Basin etc. The boundary of the Anambra Basin coincides with the northern boundary of the Niger Delta Basin. The basin extends northwards towards the lower reaches of the Benue River (Nforet al., 2007). The stratigraphic origin of the Anambra Basin is characterized by a major sedimentary phase ranging from the Campanian to middle Eocene. Its geographical location is predominantly in Anambra and Enugu states in southeastern Nigeria. The resulting sequence includes the Nkporo Group, the Mamu Formation, the Ajalli Sandstone, the Nsukka Formation, the Imo Formation, and the Ameki Group (figure 1, Nfor et al., 2007). The depositional environment of the sediments was attributed to the open marine environment due to the presence of siderite and deep-sea anoxia due to black shale (Aghamelu et al., 2011; Reyment, 1965).
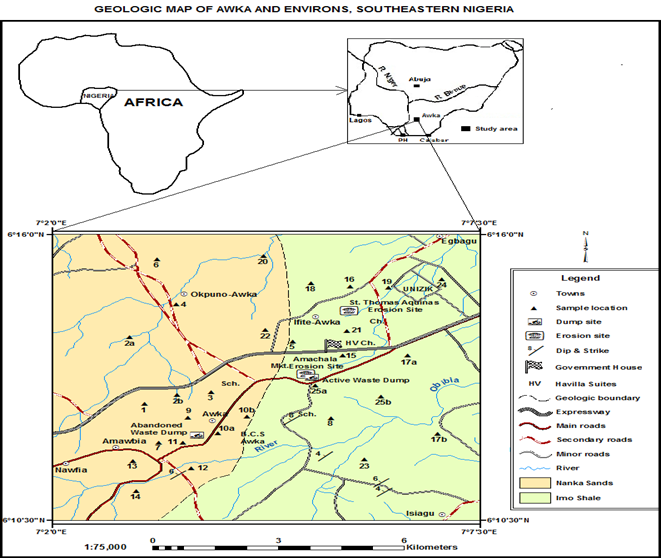
Figure 1 Map of the Study Area
MATERIALS AND METHODOLOGY
The study was conducted using different approaches and methods. The process began with basic desk background study. In this phase, a literature search was carried out on the study area. The researcher was familiar with the position of previous authors on the area of study and the topics of interest. The World Bank, IDA, IBRDA and FAO harmonized sampling tool was used to obtain preliminary information leading to the location of sampling points and the socio-economic components of the erodibility index. This is the methodology approved and applied by the World Bank/IDA/IBRDA and FAO Environmental and Water Resources Monitoring and Assessment Index in the latest Environmental and Social Assessment Framework.
This includes field surveys and comparison with the World Bank standard table and the Food and Agriculture Organization erosion index table. Table 1 broadly classifies the contribution of erosion-causing activities into a grade from 0 to 5 by analyzing how each of them contributes to erosion and soil stability. The rating system adopted for this work follows this form, as shown in the table 1. 0 indicates no effect on erosion and increases in this order until 5 indicates the maximum negative effect on erosion.
Empirically, the Universal Soil Loss Equation (USLE) is used to evaluate the rate per annum that soil is lost within an area and the extent to which erosion can be generated. It looked at all the factors that produces erosion and how all elements of weather and climate inclusive of human action contributes to erosion risk
The USLE being a fact based relationship of factors,
A=RKLSCP where A is computed soil loss, R is the rainfall-runoff erosivity factor, K is a soil erodibility factor, L is the slope length factor, S is the slope steepness factor, C is a cover management factor, and P is a supporting practices factor.
Method of Sampling
Sampling was distributed across the area focusing on all areas that had the following parameters:
- Presence of an erosion.
- Reclaimed erosion (Areas that used to be erosion in the past).
- Bare lands not covered by vegetation
- Well vegetated lands (in contrast to bare lands) to aid comparison.
- High slope environments – areas showing high elevation diffrentia over small distances.
- Densely housed locations.
The factors above as seen as risk indicators and were taken into account in the sampling.
Table 1 Erodibility index code values and significance
| Code Value | Characteristics | Significance |
| 0 | When all variables does not exist at all. | Has completely no impact to erosion. |
| 1 | Exist in negligible value. | Has negligible impact and contribution to erosion. |
| 2 | Minimal value. | Has minimal impact. |
| 3 | Average value | Has average impact. |
| 4 | High risk value | Has high impact and contribution to erosion. |
| 5 | Very high risk value | Has very high risk / adverse distribution to erosion. |
The erodibility code values is progressive step by step weighting system as to how the factor has a contribution to erosion exacerbation. A factor having a zero (0) code is one that has no negative contribution to erosion. A parameter having a code value of one (1) may have contribution that poses no real or significant risk. This follows for others and the negative scale rises to four (4) and (5) which is the peak values for erosion.
For instance, a human action like sand mining has very clear, over reaching and consequential contribution to erosion will have a code value of 5 (Very high risk). Same may be true to outright destruction of forests without any replacement plans, while clearing of fiorests with replacement may score four (4) – as this may have some respite despite the consequences conmsidred severed in the immediate term.
RESULTS AND DISCUSSION
The results of the calculations and derivations of the erodibility index are presented here. The factors calculated here come from the geographical information and digital elevation model platforms as well as the ground survey (groundtruth). The results are presented in table 2 and the calculations were made using the universal soil loss equation as used by the World Bank, the International Development Association (IDA), the Food and Agricultural Organization (FAO) and the International Bank for Reconstruction and Development Association was taken over (IBRDA).
Table 2 Erodibility factor components within the project area.
| LOCATION | LOCATION DESCRIPTION | ELEVATION | RAINFALL (R) | SOIL ERODIBILITY (K) | SLOPE (LS) | CROP FACTOR/ VEGETATION (C) | CONTROL PRACTICE (P) |
| L.001 | N 060 11 800
E 0070 03 602 |
82m | 5 | 5 | 4 | 5 | 4 |
| L.002 | N 060 11 953
E 0070 03 726 |
80m | 5 | 4 | 5 | 4 | 4 |
| L.003 | N 060 12 003
E 0070 03 692 |
84m | 5 | 5 | 2 | 4 | 4 |
| L.004 | N 060 13 554
E 0070 04 142 |
146m | 5 | 5 | 2 | 4 | 3 |
| L.005 | N 060 14 098
E 0070 05 075 |
130m | 5 | 4 | 3 | 5 | 3 |
| L.006 | E 06 14 400
N 007 04 646 |
78m | 5 | 4 | 3 | 4 | 3 |
| L.007 | E 06 13 988
N 007 03 992 |
80m | 5 | 4 | 2 | 4 | 4 |
| L.008 | N 060 13 664
E 0070 05 358 |
126m | 5 | 3 | 3 | 4 | 3 |
| L.009 | N 060 12 003
E 0070 03 692 |
83m | 5 | 3 | 4 | 4 | 5 |
| L.010 | N 060 12 000
E 0070 03 692 |
86m | 5 | 3 | 4 | 4 | 4 |
| L.011 | N 060 13 223
E 0070 03 652 |
88m | 5 | 4 | 5 | 4 | 4 |
| L.012 | N 060 11 956
E 0070 03 400 |
103m | 5 | 5 | 5 | 5 | 3 |
| L.013 | N 060 11 968
E 0070 03 647 |
92m | 5 | 4 | 4 | 5 | 3 |
| L.014 | N 060 12 000
E 0070 03 692 |
88m | 5 | 4 | 2 | 4 | 5 |
| L.015 | N 060 12 000
E 0070 03 692 |
83m | 5 | 3 | 2 | 3 | 5 |
| L.016 | N 060 11 827
E 0070 03 612 |
103m | 5 | 4 | 2 | 3 | 5 |
| L.017 | N 060 13 484
E 0070 05 198 |
155m | 5 | 5 | 3 | 3 | 3 |
| L.018 | N 060 13 544
E 0070 05 222 |
158m | 5 | 3 | 3 | 5 | 3 |
| L.019 | N 060 13 724
E 0070 05 121 |
148m | 5 | 4 | 4 | 5 | 3 |
| L.020 | N 060 13 381
E 0070 05 076 |
139m | 5 | 3 | 4 | 5 | 5 |
| L.021 | N 060 13 885
E 0070 05 412 |
139m | 5 | 4 | 5 | 5 | 3 |
| L.022 | N 060 13 922
E 0070 05 466 |
138m | 5 | 3 | 2 | 2 | 4 |
| L.023 | N 060 13 546
E 0070 05 431 |
140m | 5 | 4 | 3 | 2 | 5 |
| L.024 | N 060 13 350
E 0070 05 290 |
141m | 5 | 5 | 4 | 2 | 3 |
| L.025 | N 060 12 421
E 0070 05 410 |
126m | 5 | 5 | 4 | 4 | 5 |
| AVERAGE | 5 | 4 | 3 | 4 | 4 |
Values of R, K, LS,C and P on table 2 below reflects the risk rating as presents the code values as already presented in table 1 above. (Refer to table 1).
The following minimum values were determined by conducting the study on a scale of zero (0) to five (5) by examining the erosion factors presented in the equation according to Wischemier et al. 1958 and others and as adopted by a study by Nigeria Erosion and Watershed Management Project (NEWMAP) in 2015 as documented by Achebe E.A. (2019) as shown in table 3.
R = 5, K = 4, Sl = 3, C = 4 and P = 4
Now: USLE = R x K x Ls x C x P = (4 x 3.5 x 3 x 4 x 4) = 960
Where USLE = Universal Soil loss Equation.
Table 3 USLE erosion prediction table (NEWMAP, World Bank 2015).
| A Value | CATEGORY | PREDICTION | |
| Negative – Zero (0) | Category I | Not Erodible | |
| 1 – 32 | Category II | Hardly Erodible | |
| 33 – 243 | Category III | Erodible | |
| 244 – 1024 | Category IV | Highly Erodible | ü Awka |
| 1025 – 3125 | Category V | Very Highly Erodible |
The direction of the slope of the project area is also considered and thus also the direction in which the flood flow moves. An elevation map of the area was created (figure 2).
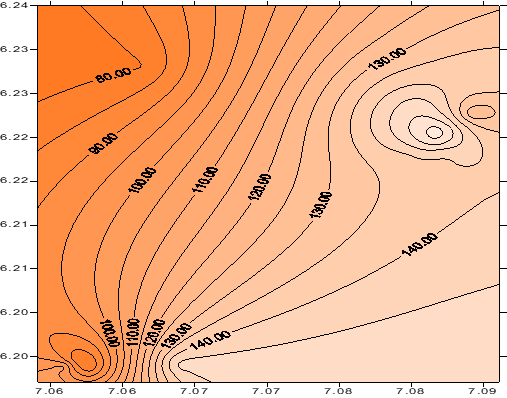
Figure 2 Map showing the elevation and slope direction of the area.
An examination of the elevation direction shows that the upward trend is from northwest to southeast, with the northwest side of the project area representing the lowlands and the southeastern part representing the highlands. This shows that the runoff originates in the southeastern highlands and flows to the northwestern lowlands. While the southeastern part is prone to earth movements and erosion, the northwestern part experiences earth deposition and possible flooding in lowlands or plains.
The elevation map maters based on the fact that flood and surface flow which contributes significantly to erosion is tied to slope and gradient – basically because water flows basically in the direction of gradient diffrentia.
United States Department of Agriculture (USDA) Erosion Prediction Model
The United States Department of Agriculture (USDA) Erosion Monograph is another benchmark for studying the erosion potential of soils. This can be utilized when the right data is collected and placed in the right order. Some authors believe that this model does not accurately describe erodibility potential but has clearly failed to provide valid alternatives (Hazen, 1983). Observation of the soil sample classifies it into Group IV through grading and physical observation after the USLE model confirms the presence of all risk factors in the environment. Nigeria’s Erosion and Watershed Management Project – NEWMAP (WorldBank) also records this model. The result is shown in Table 4.
Table 4 Final results of erodibility index for the study area.
| GROUP | K – FACTOR | NATURE OF SOIL | PREDICTION | REMARK |
| I | 0.0 – 0.1 | Permeable gracia outwash well grain soils having stony sub strata | Not Erodible | |
| II | 0.11 – 0.17 | Well drain soils in sandy graded free material | Hardly Erodible | |
| Iii | 0.18 – 0.28 | Graded loam and silt, loam | Erodible | |
| IV | 0.29 – 0.48 | Poorly graded moderately fine and textured Sandy soil | Highly Erodible | ü |
| V | 0.49 – 0.64 | Poorly graded silt or very fine sandy soil, well and moderately drained soils | Very Highly Erodible |
Therefore, the USDA forecast model assigns the area to Category IV with a range of 0.25 to 0.40, meaning it is highly erodible and is classified as a high risk environment.
A comparative analysis of the similarities between the USLE and the USDA soil erodibity and stability thresholds
Table 5: Table of comparison between USDA and USLE
| USDA | USLE | COMPARSION | ||
| GROUP | K – FACTOR | A Value | CATEGORY | Both models review the erodibility and stability of soils based on similar parameters. One may argue that they are two sets of equipment built by different manufacturers aimed at solving the same kind of problem.
Both areas classify the project area on the 4th category – moderately below the highest risk rating on level 5. |
| I | 0.0 – 0.1 | Negative – Zero (0) | Category I | |
| II | 0.11 – 0.17 | 1 – 32 | Category II | |
| Iii | 0.18 – 0.28 | 33 – 243 | Category III | |
| IV | 0.29 – 0.48 | 244 – 1024 | Category IV | |
| V | 0.49 – 0.64 | 1025 – 3125 | Category V | |
SUMMARY AND CONCLUSION
After examining the erosion potential of the soil in the project area, a number of conclusions were drawn from the study. Erosion prediction information for the study area was determined using two tools – the Universal Soil Loss Equation (USLE) and the United States Department of Agriculture (USDA) prediction formulas. The USLE forecast value is 672, predicting high erodibility, while the US Department of Agriculture (USDA) model forecast was Category IV. Both models placed the samples at the same threshold and therefore agree that the soil is highly erodible. The conclusions are thus:
- That the Erodibility potential (Erosion possibility Index) of Awka on average is high and thus should be accorded an A class (priority) erosion watch.
- The areas that have thick sand and lateritic formations have higher erosion index. The areas under this classification are parts of Amaenyi and Environs, Okpuno etc. Areas overlain dominantly by shale are seen to have very low erosion prediction values because of the high plasticity of shale.
- The study area has been proven to have high erodibility index and this necessitates the development of storm Water management plan. This is in line with the Provisions of the World Bank Erosion management policy that requires cities of Category III and above to develop Waste and Storm Water Management policy.
- The presence of shallow wells may not necessarily have impacted on the erosion, but has made residence to rely on well water for their source of water and so do not collect rain water and pay no attention to rain water harvesting. Communities that that have no wells but rely on rain water harvesting tend to have lower run off within their homes (Achebe E.A. 2019).
RECOMMENDATIONS
The study recommends integrated catchment planning (ICP) which will involve a wholistic storm water master planning, vegetation, controlled land use, proper drainage channelization as the only sustainable and effective option for erosion control and soil and water conservation. Furthermore, it is recommended that communities and institutions adopt an erosion sensitivity mapping model presented in this study to put their area on the global sensitivity index and thus have a chance of receiving interventions from donor organizations. This will simply mean that all communities, cities and municipalities are to do an analysis of their environment using the USADA and /or USLE (or any similar tool that accounts for the environmental threats within their locality) to see how much they are in threat of erosion. This discovery of how much they are at risk will influence a behavioral change in the people with view to saving their neighborhoods from emerging erosion threats. This is particularly urgent as Anambra State is already earmarked for intervention if communities qualify for the catchment area planning grant as the projects are community driven.
CONFLICT OF INTEREST ON THIS PUBLICATION
None.
REFERENCES
- Aba – Idah, P., Mustapha, H.I., Musa, J.J., and Dike, J., (2008). Determination of Erodibility indices of Soils in Owerri West Local Government Area of Imo State, Nigeria. Journal of Earth Sciences. 12(2):130-133.
- Achebe E.A. (2019). The Nigeria Erosion and Watershed Management Project (NEWMAP) Erosion control Manual. A Publication of the Anambra State Nigeria Erosion and Watershed Management Project, Anambra State Project Management Unit. Vol.1 No.1.
- Aghamelu, O.P., Nnabo, P.N., and Ezeh, H.N., (2011). Geotechnical and Environmental problems related to Shales in Abakaliki area, South Eastern Nigeria. African Journal of Environmental Sciences and Technology. 5 (2): 80-88.
- Akpokodje, E.G., (1989). Preliminary Studies on the Geotechnical Characteristics of the Niger Delta Subsoil. Engine. Geol., 26:247 – 257.
- Allen, J.R.L., (1965a). Aspects of the Geology of Nigeria, University of Ibadan Press, Nigeria; 133.
- Assez, I.O., (1976). Review of the stratigraphy, sedimentation, and structure of the Niger Delta. In Kogbe, C.A. (Ed) Geology of Nigeria, Elizabethan Press, Lagos, pp.239-273
- Edet, A.E., (1993). Groundwater Quality Assessment in parts of Eastern Niger Delta, Nigeria. Environ. Geol., (22): 41-46.
- Efobi, K., and Anierobi, C., (2013). Urban Flooding and Vulnerability of Nigerian Cities: A case study of Awka and Onitsha in Anambra State, Nigeria Journal of law, Policy and Globalization. ISSSN 2224-3240, Vol. 19.pp1-6
- Egboka, B.C.E., (1983). Water Resources of Nsukka Area and Environs. Nigeria Journal of Mining and Geology. Vol.2 pp 1-16
- Etu – Efeotor, J.O., and Odigi, M.I., (1983). Water supply problems in the eastern Niger Delta. Journal of Mining and Geology, 20: 183– 193
- Ezeabasili A.C.C., Okoro B.U., and Emengini E.J., (2014). Relative Erodibilities of some siols in Anambra basin. Sky Journal of Soil sciences and Environmental Management. 3 (8): 083-090.
- Ezeigbo, H.I., and Ozoko, D.C., (1989). An Evaluation of Water Resources of Nsukka and Environs Anambra State, Nigeria. Water Resources Journal of Nigeria. Association of Hydrogeologists. Vol2 :20 -25.
- Davies, S.N., and De West, R.J.M., (1966). Hydrogeology .John Wiley and sons Inc New York.61
- Hazen, A., (1983). Some physical properties of sands and gravels Mass. State Board Health, 24th Annual. Rept 63.
- Health R.C., (1984). Groundwater regions in the United States. U.S. Geological survey water supply paper 2242
- Hem, J.D., (1985). Study and interpretation of the chemical characteristics of natural water, US Geological Survey Water- Supply Paper 2254: 205
- Hem, J.D., (1989). Study and Interpretation of the chemical characteristics of Natural water, US Geological Surveys, Water-Supply Paper, 2254.Human Development Report (2009). Overcoming barriers: Human Mobility and development (Summary), UNDP p. 12.
- Ifekandu, E.N., and Okoye, C.O. (2015). Environmental Impact Assessment: A tool for sustainable development. Anambra State Ministry of Environment. (Unpublished).
- Lee, G.F., and Lee J.A., (2005). Municipal solid waste landfills – water quality Issues, Water Encyclopedia: Water Quality and Resource Development, John Wiley. NJ pp. 163-169.
- Morgan, R.P.C., (2001). A Simple Approach to Soil loss Prediction: A Revision of Morgan – Morgan – Finney Model. Catena 44 (4) 305- 322.
- Nigerian Meteorological Institute (2015). Annual Climatic Statistics / year book – Released 2016
- Nigeria Erosion and Watershed Management Project (NEWMAP) WorldBank Assisted (2015). Environmental and Social Impact Assessment AmachallaAwka Erosion Site.WorldBank Info Shop. Appendix 2-3
- Nigeria Erosion and Watershed Management Project (NEWMAP) WorldBank Assisted (2015). Environmental and Social Impact Assessment Omagba Onitsha Erosion Site. WorldBank Info Shop.102
- Nfor, B.N., Olobaniyi, S.B.,andOgala ,J.E.,(2007). Extent and Distribution of Groundwater Resources in Parts of Anambra State, Southeastern, Nigeria. Journal of Applied Sciences and Environmental Management. 11(2): 215-221.
- Nwajide, C.S., (2013). Geology of Nigeria’s Sedimentary Basins. CSS Bookshops. pp 277- 346.
- Nyakatawa, E.Z.., Reddy, K.C., and Lemunyon, J.L., (2011). Predicting soil Erosion in Conservation Tillage cotton production system using Revised Universal Soil Loss Equation (RUSLE). Soil and Tillage Resources.pp 57.
- Offodile, M.E., (2014). Hydrogeology: Groundwater Study and Development in Nigeria, Third Edition. Fab Anieh Nigeria Limited. pp.79 -100.
- Okagbue, C.O., (1986). The physical and mechanical properties of laterite gravels from southeastern Nigeria relative to their engineering performance. J. Afr. Earth Sci., 5(6): 659-664.
- Okagbue, C.O., (1989). Geotechnical and environmental problems of the Niger Delta. Bull. Assoc. Eng. Geol., 27: 119-126.
- Okogbue, C.O., and Aghamelu, O.P., (2010a). The Impact of the Geotechnical Properties of the Abakaliki Shale on the Incessant Road Failures in the Abakaliki Area, southeastern Nigeria. Paper presented at the 1st International Workshop on Landslides and Other Natural Disasters, University of Nigeria, Nsukka, Nigeria. 22-26th March 2010.
- Okogbue, C.O., and Aghamelu, O.P., (2010b). Comparison of the geotechnical properties of crushed shales from Southeastern Nigeria. Bull. Eng., Geol. Environ., 69(4): 587-597.
- Renard, K.G. (1997). Predicting Soil erosion by Water. A guide to conservation planning with the revised universal soil loss equation (RUSLE), USDA handbook 703 US Government printing office , Washington DC USA.197
- Rayment, R.A., (1965). Aspects of Geology of Nigeria. Ibadan University, Ibadan, 145.
- Roose, E.J., (1977). Application of the Universal Soil Loss Equation of Wischmeier and Smith in West Africa, pp 177- 187
- Seed, H.B., and Woodward, R.J., (1964). Fundamental aspects of the Atterberg limits. J. Soil Mech. Found. Div., Proceedings of ASCE, 90, SM6, p.75.
- Udom, G.J., Ushie, F.A., and Esu, E.O., (2002). A Geochemical Survey of Groundwater in Khana and Gokana Local Government Areas of Rivers State, Nigeria. J. Appl. Sci. Environ. Mgt 9(1): 65-68.
- Udom, G.J., and Acra, E.J., (2006). Hydrochemical characteristics of groundwater in Andoni Local Governemt Area, Rivers State. J. Res. Phys. Sci., 2(1):35 – 41
- Wischmeier, W.H., Smith, D.D., and Uhland, R.E., (1958). Evaluation of factors of Soil loss Equation. Journal of Agricultural Sciences Engineering 39: 459-462
- World Health Organization (1998). World Health Organization’s Guidelines for Drinking water, Geneva Vol. 1, pp.2-4