
Factors Influencing the Use of Inorganic and Organic Fertilisers by Smallholder Farmers in Zimbabwe
- Blessing Gumindoga.
- Nyaradzai Ruponga
- Liana-Lisa Sakwa
- 444-454
- Jun 21, 2024
- Architecture
Factors Influencing the Use of Inorganic and Organic Fertilisers by Smallholder Farmers in Zimbabwe
*1Blessing Gumindoga., Nyaradzai Ruponga2., Liana-Lisa Sakwa3
1Research scientist Biotechnology research institute at SIRDC 1574, Alpes Road Scam Way, Harare
2Research scientist Geo-Information & Remote Sensing institute at SIRDC
3Research scientist Biotechnology research institute
*Corresponding author
DOI : https://doi.org/10.51584/IJRIAS.2024.905039
Received: 02 May 2024; Accepted: 17 May 2024; Published: 21 June 2024
ABSTRACT
A survey the study aimed to establish the relationship between agro-ecological regions and adoption of organic and inorganic fertilizer use and to establish the relationship between household demographic and socio-economic status and the adoption of organic and inorganic fertilizer use. Both organic and inorganic fertilizers application rates were not informed bey soil testing and were below the recommended rates contributing to low yields. Binary logistic regression results indicate that adoption of urea application in maize crop was influenced by agro-ecological region and distance to the town market (p<0.05). Education level of household head and distance to the town market were the two factors with a significant influence on the use of DAP in maize crop (p<0.05). The lower the education level the higher the probability that a farmer will use DAP. The regression coefficient shows that the more the farming experience the higher the likelihood that the farmer will use NPS. Binary logistic regression results indicate that adoption of both compost and animal manure in the two districts was influenced by Agro-ecological regions (p<0.05). Despite the high farmer preference, the low organic fertilizer usage is a result of ignorance of the technical aspects linked to the use of manure as an organic fertilizer and its availability in insufficient quantities and lack of related machinery for handling, composting, and transport. Systematic advancements in the technical expertise transfer process regarding the use of biofertilizers, including best practices for managing manure, nitrogen-fixing crops, and the use of bioinoculants, coupled with frequent soil testing, training, and guidance from agriculture extension service providers will help scale farmers adopt biofertilizer technologies. This will close crop yield gaps, and increase food security and income security for communal integrated crop-livestock farmers who rely on agriculture for a living.
Key words: fertilizer, cost, soil fertility, bioinoculants, nitrogen-fixing crops, yield gaps
Zimbabwean smallholder farmers typically practise integrated crop-livestock farming as a means of guaranteeing household food, nutrition, and income stability (Giller et al., 2011). Nevertheless, inadequate productivity in the livestock and crop sectors frequently prevents this from happening. Low fertility of the soil and a heavy reliance on rain-fed agriculture—which has become more unpredictable due to climate change and a high frequency of droughts—are the main causes of low crop yields. Problems with feed supply and quality are the cause of low livestock productivity (Hristov et al., 2013). Since most animals are kept on free range, there may be a lack of forage and low quality during the dry season (MLAFWRD, 2022), which in the worst circumstances may cause animal deaths . Livestock are very dependent on crop residues and pasture, and are subject to climatic uncertainty (Bennett et al.,2019). High dependence on crop residues which have low nutritive value contributes to low productivity in ruminant livestock. Despite the high synergies between the crop and livestock systems productivity remains low as such these rural households often suffer from food insecurity.
According to Nyamangara (2014), the soils have a substantial nitrogen shortage and low soil fertility. Improving soil fertility and crop yield both depend on addressing the low nitrogen shortage. To overcome low soil fertility, smallholder farmers apply a variety of soil additives. They consist of both organic and inorganic fertilisers. Blends, compounds, and plain fertilisers are examples of inorganic fertilisers (Minde et al., 2010). According to Giller et al. (2011), organic fertilisers that farmers can access locally include leaf litter, livestock manure, crop residues, termitarium, and nitrogen-fixing crops. Due to their high cost, most smallholder farmers are unable to purchase inorganic fertilisers; as a result, they typically mix them with organic fertilisers that are readily available in their area.
There is a significant chance of applying too much or too little fertiliser, both of which are not ideal if lab soil tests are not used extensively to guide fertiliser applications. Over-application of inorganic fertiliser and livestock manure increases the likelihood of ecological problems, including soil acidification, eutrophication of water bodies due to leaching and runoff, and nitrogen volatilization in livestock manure (Joensuu et al., 2021). Fertilizer-induced nitrous oxide emissions are one of the main causes of global warming and climate change (Steinfeld, 2006) . Therefore, to reduce waste, pollution, and climate change, both organic and inorganic fertilisers must be used with exact and optimal fertiliser application.
Despite using a variety of locally sourced fertilisers (such as crop leftovers, manure, and leaf litter), smallholder farmers primarily do so out of necessity rather than choice (Mapfumo et al., 2001). Crop residues’ significant contribution to animal supplemental feed during the dry season may always place restrictions on the utilisation of crop residues in soil fertility, particularly in enhancing soil carbon. As a result, despite the government of Zimbabwe’s promotion of conservation agriculture (Pfumvudza/ Intwasa) (MLAFWRD, 2022), it is only partially practiced. While manufacturers and agriculture extension agents provide farmers with the suggested rates for applying fertilisers, smallholder farmers are informed by the amount of fertiliser available which is spread over the total hectarage that has to be applied. In most cases this results in low fertilizer application rates (Rusinamhodzi, 2013).
Smallholder farmers can enhance soil fertility and thus boost yields at a reasonable cost by implementing biofertilizers, organic fertilisers, humus, N-fixing crops, livestock manure, and optimising utilization (Nzuma, et al., 1995 ). This study aims to investigate the barriers preventing smallholder farmers in Zimbabwe’s Wedza and Rusape regions who raise integrated crops and animals from using both organic and inorganic fertilisers. In all, 210 households were included in the research. These homes were spread over two districts in Zimbabwe that are located in the country’s three agroecological regions: Natural Region 1, Natural Region 2b, and Natural Region 3. Generally speaking, the entire nation experiences a uni-modal rainfall trend. This research investigates the variables related to the fertiliser utilised, expenses, application techniques, and current yield discrepancies between projected and actual yields.
Objectives:
- To establish the relationship between Agro-ecological regions and adoption of organic and inorganic fertilizer use.
- To establish the relationship between household demographic and socio-economic status and the adoption of organic and inorganic fertilizer use.
Null Hypothesis
- There is no significant relationship between Natural Agro-ecological regions and the adoption of organic or inorganic fertilizer use.
- There is no significant relationship between household demographic and socio-economic characteristics and the adoption of organic or inorganic fertilizer use.
METHODOLOGY
The research area is situated in the districts of Makoni and Hwedza, which are part of Zimbabwe’s Manicaland and Mashonaland East provinces, respectively.
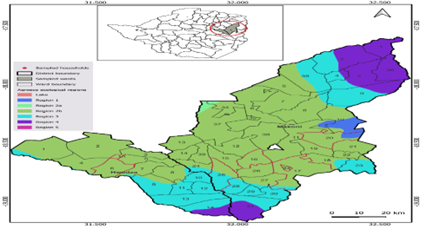
Figure: Study location
The study site was purposefully selected such that it includes different agroecological zoning. In general, Zimbabwe experiences unimodal rainfall. Agroecological zone one experiences considerable precipitation over a longer length of time, whereas agroecological zone five is semi-arid with shorter rain seasons and lower precipitation received over shorter periods. Nevertheless, there are variances in temperature and yearly rainfall received.
During fieldwork, key informant interviews, observations, and photo capture were conducted. The data was examined for variations in the yields obtained from the cultivation of crops and livestock, as well as in the rates and techniques of fertiliser application. Both quantitative and qualitative information were collected.
DATA ANALYSIS
Exploratory data analysis (Descriptive statistics)
We subjected the demographic and socio-economic variables to descriptive statistical data analysis before doing confirmatory data analysis of hypothesis testing to test the validity of the findings from the data descriptives.
Binary Logistics Regression Analysis
Binary logistics regression analysis was used to model the relationship between the factors influencing smallholder farmer use of organic and inorganic fertilisers.
Binary logistics regression model;
The dependent variable (Y) in this is derived from whether a farmer used organic or organic fertilisers (Urea, DAP, NPS, Compost and livestock manure) or not.
Yi = B0 + B1X1 + B2X2+ B3X3, where Yi represents the use of fertilisers (Yes or No) by smallholder farmers and X1, X2, and X3 are factors affecting the decision to use a particular fertilizer.
OR It models a dependent variable as a logit of P, where P is the probability that the dependent variable takes a value of 1
The statistical model for binary logistic regression;
Log [ P / (1-P)] = b₀ +b₁X₁+……..bкXк
Where;
P = Probability that Y =1 given X
Y = Dependent variable
X₁, X₂ …Xк = independent variables
b₀, b₁ …bк = parameters of the model (parameters are estimated using the maximum likelihood method).
RESULTS AND DISCUSSION
Demographics
In the population of study, the ratio of men to women of household heads was 50% male and 50% female. The head of a farming household averages 58 years old and has 26 years of farming experience on average. The average age of the family members is 25, yet 61% of the family members in farming households are younger than 20, and 27% are in the economically active category. The literacy levels for the household head showed that 51.4% of the household heads can read and write, 39.4% completed formal education and 9.2% are not able to read and write. The majority (40%) of the sampled farming households are of the middle-income level with 27% having a very low-income level. The sampled households have agriculture as their principal income-generating activity. Ninety-nine percent (99%) of the respondents are responsible for their household agricultural activities with 82% using their funds to fund the agricultural activities. A total of 97% of the farming households have access to agricultural extension services in their community with 91% benefiting through training, 87% through field demonstrations, and 45% benefiting through farming experience-sharing visits
Land ownership, soils types and soil fertility measures
The average farming household operational land area is 1.8 hectares, only 2 out of the 218 respondents rented an average of 1 hectare of land. None of the interviewed farming households rented out, shared in, or shared out a portion of their land. Sixty-seven percent (67%) of the household land was used for cultivation, whereas 15% was occupied by the homestead including home buildings, 11% was used for forest trees, 5% for own grazing, and 2% as grassland.
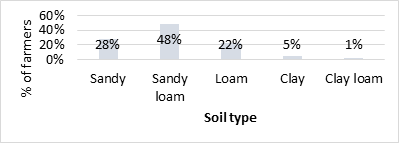
Figure 3: Soil types
Figure 3 shows that 48% of the farming households land is sandy-loam followed by sandy (28%), loam (22%), clay (5%) and clay loam (1%). The majority of the soils are sandy and sandy loam and as such are not very fertile hence the need for correct application rates and timing of application of both organic and inorganic fertilizer to minimize nutrient loss and improve yields.
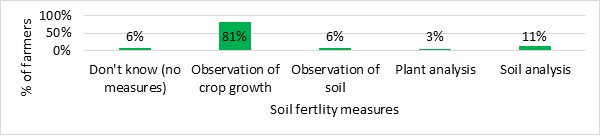
Figure 4: Soil fertility checking measures
A total of 81% of the farming households do soil fertility checks by observing crop growth, followed by 11% who do soil analysis whereas 6% do observation of the soil, 3% do plant analysis and 6% do not do soil fertility checks (Figure 4). The soil fertility checks are usually done once per farming season. As a result of the majority of the farmers (81%) using observation of crop growth, it is difficult for farmers to precisely tell the exact nutrient levels in the soils and how much they need to supplement using fertilizers.
Soil fertility amendments
Thirteen percent (13%) of the farming households use mulching, 11% use cover cropping, less than 1% use green manure and 1% use other soil improvement methods (Figure 5). The materials used for mulching include crop residues and grass. Where crop residues are used these present a competing need considering farmers also use crop residues such as maize stover as dry season supplementary feed. The legume plants that are used as cover crops include cowpeas, sugar beans, soya beans, and velvet beans.
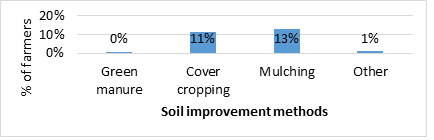
Figure 5: Soil improvement methods used by the farming households
Smallholder farmers can access inorganic fertilizers through purchase, government input programs and various non-governmental organizations projects. The prices of inorganic fertilizer observed are much higher (Table 1) than the gazetted prices and this could be a result of additional transport costs and retailer mark-up considering the long distance between the fertilizer markets and the studied communal areas. These prices were found to be highest during the high-demand periods between November and January which is the main cropping season for rainfed crop production. Organic fertilizer prices were much lower than the inorganic fertilizer probably as a result of the fertilizer being locally available. The number of farmers that were aware of prices of organic fertilizers was very low ranging between 38 and 41 out of 218 farmers therefore, giving the impression that organic fertilizers are not usually sold as farmers normally produce them on their own.
Table 1: Mean price of fertilizers per 100kg
| Item | N | Mean Price (USD)/100Kg |
| Urea | 167 | 94.13 |
| DAP | 191 | 69.72 |
| NPS | 208 | 84.30 |
| Vermi compost | 41 | 40.00 |
| Compost | 38 | 27.11 |
| Manure | 40 | 24.20 |
| Poultry litter | 39 | 25.90 |
It was noted that ninety-four percent (94%) of the farming households who used livestock manure produced for themselves and 5% had to purchase the livestock all of the manure they used. Eighty-seven percent (87%) of the farming households highlighted that the livestock manure was not sufficient for their crops which was attributed to high cattle losses due to Theleria which reduced the herd sizes with some households remaining without any cattle. Where manure supply was insufficient maize crop was prioritized by 97.2% of the farming households considering it is the staple crop in Zimbabwe. Only 39.4%, 14.2% and 6.9% of the farmers prioritized groundnut, sunflower and potatoes respectively (Figure7).
Crop production and fertilizer application methods
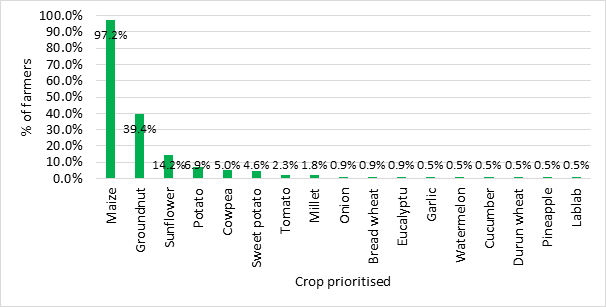
Figure 7: Crops grown by the farming households
Most of the farmers (80%) do fertilizer placements followed by broadcasting (13%) and micro dosing (6%) (Figure 8). The high use of fertiliser placement is a result of farmers minimizing the wastage of fertiliser and also most of these farmers have adopted the Pfumvudza conservation farming method promoted by the government as a strategy for efficient use of resources, water harvesting and climate change adaptation.
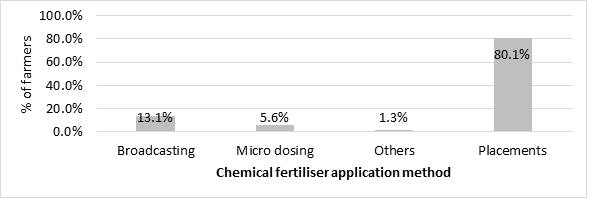
Figure 8: Chemical fertilizer placement method
DAP was applied on all the crops except eucalyptus, pineapple, and lablab. NPS is the second highest fertilizer type in terms of its application by the farmers on the various crops (applied on 12 out of the 17 crops) (Table 2). NPS was applied to maize crops by 84% of the farming households followed by DAP (82%). Animal manure was applied on maize crops by 36% of the farming households whereas compost was applied by 27%. It can also be observed that none of the farming households applied vermicom post on crops.
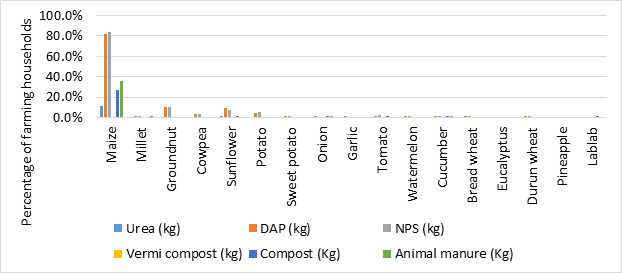
Figure 9: Percentage of farming households who applied the specified fertilizers on the specific crops
The inorganic fertilizer application rates per hectare are much lower than the recommended rates and this can be attributed to the high cost of fertilizers. Some of the farmers used a combination of both organic and inorganic fertilizers resulting in reduced application rates for both organic and inorganic fertilizers.
Table 2: Average fertilizer used per farming household during the 2021/2022 season [ kilograms]
| Crop | Urea | DAP | NPS | Vermicompost | Compost | Animal manure |
| Maize | 63.4 | 83.2 | 97.7 | 484.9 | 484.4 | |
| Millet | 5.0 | 7.0 | 400.0 | |||
| Groundnut | 23.9 | 22.0 | ||||
| Cowpea | 11.5 | 15.6 | ||||
| Sunflower | 25.0 | 32.6 | 39.4 | 200.0 | ||
| Potato | 47.0 | 48.5 | ||||
| Sweet potato | 28.8 | 22.5 | ||||
| Onion | 17.0 | 300.0 | 130.0 | |||
| Garlic | 5.0 | |||||
| Tomato | 12.5 | 4.6 | 200.0 | |||
| Watermelon | 10.0 | 10.0 | ||||
| Cucumber | 15.0 | 4.0 | 80.0 | 30.0 | ||
| Lablab | 150.0 |
Factors determining the adoption of and inorganic fertiliser use in maize crop
Binary logistic regression results indicate that adoption of urea application in maize crop was influenced by Agro-ecological region and distance to the town market (p<0.05). All the other demographic and socio-economic factors such as Farming experience, Age, gender of house hold head, education level, family size as well income level did not significantly influence the decision to apply urea in maize crop (p>0.05).
Education level of household head and distance to the town market were the two factors with a significant influence on the use of DAP in maize crop (p<0.05). Table shows that the lower the education level the higher the probability that a farmer will use DAP. The use of NPS was significantly influenced by years of farming experience as well as access or distance to the nearest farmer training center. The regression coefficient shows that the more the farming experience the higher the likelihood that the farmer will use NPS (Table 2).
Factors determining the adoption of organic fertiliser use in maize crop
Binary logistic regression results indicate that adoption of both compost and animal manure in the two districts was influenced by Agro-ecological regions (p<0.05). All the other demographic and socio-economic factors such as Farming experience, Age, gender of house hold head, education level, family size as well income level did not significantly influence the decision to apply compost or livestock manure in maize crop (p>0.05).
Constraints in fertilizer usage
The primary obstacles preventing farmers from utilising organic material to increase soil fertility are listed in Table 3. Lack of appropriate technology for handling, composting, and transportation was seen as the main obstacle, followed by ignorance of the technical aspects associated with using manure as an organic fertiliser. The third-ranked factor was low awareness or unawareness of the benefits of manure for increasing soil fertility, while the fourth one was other constraints. The lack of organic material due to the absence of animals, bulkiness, and labour-intensive application are some of the additional limitations that have been emphasized.
Despite high access to agriculture extension services, the major constraints limiting the use of organic fertilisers to improve soil fertility are ignorance of the technical aspects linked to the use of manure as an organic fertilizer (ranked 1st) and low awareness or unawareness of manure’s usefulness in improving soil fertility (ranked 3rd). Therefore, there is a need for capacitation of the extension service on the optimum use of organic fertiliser such that it can cascade down to the farmers for increased uptake and adoption of organic fertilisers.
Table 3: Main constraints that limit the use of organic fertilizer to improve soil fertility
| Constraint | Ranking |
| Ignorance of the technical aspects linked to the use of manure as an organic fertilizer | 1 |
| Lack of related machinery for handling, composting, and transport | 2 |
| Low awareness or unawareness of manure’s usefulness in improving soil fertility | 3 |
| Other Constraints | 4 |
| High affordability and accessibility of chemical fertilizer | 5 |
| High costly operation (not profitable) | 6 |
| Distance between parcels and the animal farm | 7 |
| Not useful, my soil is fertile sufficiently | 8 |
It was noted that most of the important agricultural inputs are not available at the village markets and can only be accessed from the town markets which are 26 km away on average and this can contribute to the limited use of inputs coupled with low-income levels.
Farmer fertilizer type preference
Of the agricultural households, 52% indicated that animal manure was their preferred form of fertiliser, 44% indicated that inorganic fertilisers were their preferred type, and 1% indicated that green manure was their preferred type of fertiliser. Farmers favour animal dung because it releases nutrients effectively over an extended period, is readily available locally for livestock owners, and is available at low prices. Some farmers also mentioned that animal manure lowers soil acidity. Nonetheless, a few farmers favour organic fertilisers due to their easy accessibility, speedy application, and rapid release of nutrients, which results in instant benefits for crops. The low preference for green manure can be attributed to small landholding, the fact that these farmers rely on rain-fed agriculture therefore, planting green manure may prevent them from planting food crops because the rainy seasons have become irregular and shorter due to climate change. Nitrogen fixing crops are used in crop rotation and cover cropping although limited use of bioinoculants such as rhizobium was limited.
Current crop yields vs expected
According to the World Bank and CIAT (2017), Zimbabwe’s rainfall pattern has consistently shown variability in both space and time, with both the timing and volume of rainfall experiencing increasing unpredictability. The frequency and severity of mid-season dry spells and/or droughts that occur consecutively within the same season have increased, and there has been a general change in when the rainy season begins, with it now beginning after December 18 instead of earlier in October and early November and ending in April or early May. According to the World Bank and CIAT (2017), these climate-related changes affect cropping seasons and result in a general decrease in crop yields (table 5), which lowers food security and nutrition (Food and Nutrition Council, 2022; MLAFWRD, 2022).
Table 5: Actual vs expected yield
| Crop | Actual yield [Tonnes/Ha] | Expected yield [Tonnes/Ha] |
| Maize | 0.73 | 3.5 |
| Sorghum | 0.46 | 2 |
| Pearl millet | 0.33 | 0.38 |
| Ground nuts | 0.43 | 4 |
| Sugar beans | 0.53 | 3 |
| Sunflower | 0.37 | 2 |
| Tobacco | 1.68 | 2.3 |
| Soya beans | 1.7 | 3 |
| Source | Food and Nutrition Council (2022) | Key informants[1] |
Low crop yields can be attributed to low soil fertility made worse by inadequate applications of both organic and inorganic fertilisers which are below recommendations due to the high cost of inorganic fertilisers and low availability of organic fertilisers. The fertiliser application rates are not determined by actual soil tests; therefore, it is challenging to determine precise fertiliser application rates since farmers mostly rely on crop growth, which is not the most reliable indicator of soil fertility rates.
Addressing soil fertility remains considering the lack of soil testing to inform soil fertility status and fertilizer needs. The high cost of inorganic fertilizers and the availability of biofertilizers in insufficient quantities contribute to below-recommended application rates. Whilst nitrogen-fixing crops are included in the cropping system through cover crops, intercrops and crop rotation, the impact on soil nitrogen is not clear since there is no soil testing. The limited use of rhizobium inoculants contributes to the limited capacity of these nitrogen-fixing crops to fix nitrogen. The most promising methods for raising soil fertility and, in turn, crop yields were found to be the employment of biofertilizers, such as livestock manure and nitrogen-fixing crops, notwithstanding these obstacles. Given that most farmers are older, there is a need to provide farmers with better access to tools that can lighten their workload and eliminate drudgery, particularly for women who make up the bulk of those living in rural areas. Research is required to produce knowledge and data regarding the technologies and approaches that are most effective for integrated crop-livestock farmers regarding soil type and agroecological zones. Systematic advancements in the technical expertise transfer process regarding the use of biofertilizers, including best practices for managing manure, nitrogen-fixing crops, and the use of bioinoculants, should be added to this. Frequent soil testing, training, and guidance from agriculture extension service providers will help farmers adopt biofertilizer technologies on a larger scale, close crop yield gaps, and increase food security and income security for communal integrated crop-livestock farmers who rely on agriculture for a living.
REFERENCES
- Bennett, B., Chakoma, C., Figué, M, Vigne, M., Katic, P.; 2019. Beef Value Chain Analysis in Zimbabwe. Report for the European Union, DG-DEVCO. Value Chain Analysis for Development Project (VCA4D CTR 2016/375-804), 193 pages + annexes Muriel Figué, Mathieu Vigne, Charles Chakoma, P. K. (2019). Beef_Value_Chain_Analysis_in Zimbabwe_2019.
- Food and Nutrition Council. (2022). Zimbabwe Vulnerability Assessment Committee (ZimVAC) 2022 Rural Livelihoods Assessment Report (p. 14).
- Giller, K. E., Tittonell, P., Rufino, M. C., van Wijk, M. T., Zingore, S., Mapfumo, P., Adjei-Nsiah, S., Herrero, M., Chikowo, R., Corbeels, M., Rowe, E. C., Baijukya, F., Mwijage, A., Smith, J., Yeboah, E., van der Burg, W. J., Sanogo, O. M., Misiko, M., de Ridder, N., … Vanlauwe, B. (2011). Communicating complexity: Integrated assessment of trade-offs concerning soil fertility management within African farming systems to support innovation and development. Agricultural Systems, 104(2), 191–203. https://doi.org/10.1016/j.agsy.2010.07.002
- Hristov, A. N., Oh, J., Lee, C., Meinen, R., Montes, F., Ott, T., Firkins, J., Rotz, A., Dell, C., Adesogan, A., Yang, W., Tricarico, J., Kebreab, E., Waghorn, G., Kijstra, J., & Oostin, S. (2013). Mitigation of greenhouse gas emissions in livestock production – A review of technical options for non-CO2 emissions (B. Pierre J. Gerber & H. and H. P. S. Makkar (Eds.); Issue Paper No. 177. FAO). FAO Animal Production and Health Paper No. 177.
- IPCC. (2006). Chapter 10 Emissions From Livestock and Manure Management. In J. Deborah Bartram, Darryl Gibb , and John H. Martin (Ed.), Forestry (Volume 4:, Vol. 4). IPCC. http://www.ipcc-nggip.iges.or.jp/public/2006gl/index.html
- IPCC. (2019). Volume 4: Agriculture, Forestry and Other Land Use. Chapter 10: Emissions form Livestock and Manure Management. 2019 Refinement to the 2006 IPCC Guidelines for National Greenhouse Gas Inventories, 4, 209. http://www.ipcc-nggip.iges.or.jp/public/2006gl/index.html
- Joensuu, K., Rimhanen, K., Heusala, H., Saarinen, M., Usva, K., Leinonen, I., & Palosuo, T. (2021). Challenges in using soil carbon modelling in LCA of agricultural products—the devil is in the detail. International Journal of Life Cycle Assessment, 26(9), 1764–1778. https://doi.org/10.1007/s11367-021-01967-1
- Minde, I. J., Mazvimavi, K., Murendo, C., & Ndlovu, P. V. (2010). “ Supply and demand trends for fertilizer in Zimbabwe : 1930 to date ”: Key drivers and lessons learnt. Joint 3 Rd African Association of Agricultural Economists (AAAE) and 48 Th Agricultural Economists Association of South Africa (AEASA), 1–17.
- MLAFWRD. (2022). Zimbabwe Frst Round Crop and Livestock Assessment Report 2021 / 2022 SEASON March 2022 (Issue March, p. 97). MINISTRY OF LANDS , AGRICULTURE , FISHERIES , WATER , AND RURAL DEVELOPMENT.
- Ndambi, O. A., Pelster, D. E., & Owino, J. O. (2019). Manure Management Practices and Policies in Sub-Saharan Africa : Implications on Manure Quality as a Fertilizer. Front. Sustain. Food Syst. 3:29, 3(May), 2. https://doi.org/10.3389/fsufs.2019.00029
- Nyamangara, J. (2014). Soil Fertility Status in the Communal Areas of Zimbabwe in Relation to Soil Fertility Status in the Communal Areas of Zimbabwe in Relation to Sustainable Crop Production. August 2000. https://doi.org/10.1300/J064v16n02
- Nzuma, J.K etal., 1995 in Waddington, S., S. R., Murwira, H. K., Kumwenda, J. D. T., Hikwa, D., & Tagwira, F. (1998). Soil Fertility Research for Maize-Based Farming Systems in Malawi and Zimbabwe. Proceedings ofthe Soil Fertility Network Edited by. CYMMT.
- Rusinamhodzi, L. (2013). Nuances and Nuisances: crop production intensification options for smallholder farming systems of southern Africa.
- Steinfeld, G. and. (2006). a0701e livestock long shadow. ISBN 978-92-5105571-7
FOOTNOTE
[1] Agriculture extension officers