
Heavy Metal Concentration, Physicochemical and Biological Properties of Water Collected from Different Schools Along Airport Road, Abuja
- Jibrin Noah Akoji.
- Ovurevu Oyiza Dorcas
- 48-61
- Dec 2, 2023
- Physical Education
Heavy Metal Concentration, Physicochemical and Biological Properties of Water Collected from Different Schools Along Airport Road, Abuja
*Jibrin Noah Akoji., Ovurevu Oyiza Dorcas
Department of Chemistry, Baze University, Abuja
*Corresponding Author
DOI: https://doi.org/10.51584/IJRIAS.2023.81104
Received: 26 September 2023; Revised: 13 October 2023; Accepted: 18 October 2023; Published: 02 December 2023
ABSTRACT
Fifteen water samples from Well and Boreholes were collected from different schools located in some communities along Air Port road, Abuja and were analyzed for heavy metals concentration, Physicochemical and biological properties using standard methods. The result of the heavy metal concentrations shows; Cd in mg/l (0.0883-0.1113), Fe in mg/l (0.0300-0.2298), Zn(0.0000-0.8888), Mn in mg/l (0.0497-0.4598), Cu in mg/l (0.000-1.6427) and Pb in mg/l (0.0000 -1.5453). The physicochemical properties showed; Colour-Colourless, Odour- objectionable, Temperature oC (21-31), Alkalinity in mg/ml(1.5-7.3), Acidity in mg/ml(0.8-2.2), Hardness in mg/ml ( 1.2-3.6), Appearance ( Some are clear and some are not clear), pH (5.91-7.56), TDS in mg/l (80-2080), Turbidity in NTU (0.2-3.1) Conductivity in mg/l(123-9385) NH3 in mg/l(0.014-0.077), SO42- in mg/l(25.87-186.2) and F– in mg/l (0-0.38). The microbiological results shows that TBC ranges between 30-TNTC, TCC ranges between Nil-30 and E coli is Nil in all the samples. Total Dissolved Solid was found to be above the SON limits. Concentration of Fe, Cd and Pb were also above SON limits. Total Coliform Counts and Total Bacteria counts were also above the recommended limits by SON. Considering the high level of some of the physicochemical and microbiological parameters and the high concentration of Pb and Cd, the water is presumed unfit for drinking, cooking and pharmaceutical uses.
Key words: Heavy metals, Microbiological, Contamination, School, Physicochemical
INTRODUCTION
Water is a universal solvent essential to man for various activities such as drinking, cooking, industrial activities, agricultural processes and human recreation. The quality of water is a reflection of the source environment and human activities, including its use and management measures. The safety of drinking water is important for health, and it is affected by various contaminants from chemical and microbiological sources [1]. Water is considered safe for drinking if it is free from contaminants and has properties within acceptable limits [2]. It is essential to humans and other life forms even though it provides no calories or organic nutrients. The earth ecosystems are held and maintained by water which covers about 70.9% of the earth surface. It is a necessity to the human body’s mechanics. Without it, the body does not operate, just like a car will not run without gas and oil. The usual sources of drinking water namely stream, rivers, wells and boreholes are mostly untreated and associated with various health risks [1]. Paucity of infrastructure for effective treatment and distribution of water accounts for the incidence of high morbidity and mortality rate associated with water borne diseases in developing countries. Water pollution is the leading cause of death and disease worldwide [3]. A tremendous amount of attention has been directed toward pollution of water supplies and the subsequent effects on the life of many animals and human. Unless water meets certain physical, chemical and microbiological standards it cannot be described as potable and safe for drinking. Water from boreholes is used directly without any purification as such any forms of contaminants present go undetected. In Nigeria today, the use of ground water has increased many fold because the government is unable to meet the ever-increasing water demand. Thus, inhabitants have had to look for alternative ground water sources such as shallow wells and boreholes. The presence of heavy metals, such as Pb, Mn, Cd, Cu, Fe, Zn, Ni, Hg and As also affects the water quality in boreholes. The contamination of groundwater (boreholes) introduces heavy metals into it. They are leached into the groundwater when the capacity of the surface soil fails to retain them and through consumption may pass to man and other living organisms. HM are indestructible [4] and have the ability to exist in particulate, dissolved and colloidal phases when found in water [5], although HM also exist naturally underground. Industrial and household waste discharges, directly or indirectly through leakages in sewage systems into water sources, cause excessive pollution in surface and groundwater [6]. They are well known contaminants of underground water, and they constitute one of the major pollutants affecting the underground water (boreholes) system [7].
Heavy metals are collectively grouped as environmental toxins because they are potentially poisonous and constitutes health hazard even at a very low concentration. It is therefore pertinent that environmental samples need to be periodically investigated for the presence of these toxic metals. These heavy metals are much toxic and have tendency to accumulate in the body and may result in chronic impairment. Determining the concentration of this heavy metal in water is very much helpful in understanding the role of pollutant and nutrient elements. Monitoring the quality of groundwater is important for environmental safety. The analysis of potable drinking water for physico-chemical properties and metal content is also very relevant for public health and pollution studies.
The aim of this research is to determine the amount of heavy metals and physicochemical characteristics of the water samples from different schools along Airport Road, in Abuja Metropolis in order to ascertain the quality of the water for domestic and agricultural use. This study is the first of its kind in accessing the water quality of different schools in this part of Abuja Metropolis and it will provide a baseline data of water quality in the schools to inform the administration and the concerned authorities and consequently aid them in proper treatment and purification of the contaminated water.
MATERIALS AND METHODS
2.1 Sample Collections:
Sterilization
Petri-dishes, test tubes and other instruments like flasks etc. were sterilized using alcohol and also put in an autoclave for 45minutes at 121 degrees Celsius for proper sterilization. The sample bottles were washed properly and dried prior to the water sample collection.
The water samples were collected in duplicate from boreholes and wells in selected schools along Airport road during the morning hours in sterile universal sampling bottles from 15 different schools and labelled. A total of 15 water samples were collected from taps and wells located within the schools premises and taken to the Baze University Chemistry laboratory for analyses.
The Study Area
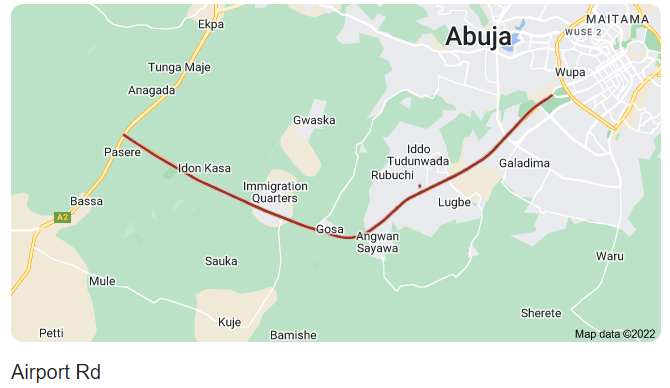
Figure 1: Map of Abuja, Nigeria Showing the Study Areas.
Analysis of the water samples was carried out in THREE
different categories namely:
- Physical Analysis
- Chemical Analysis
- Microbological Analysis
2.2 Sample preparation for Heavy metals Analysis: 100ml of each water samples was measured using measuring cylinder and poured into a beaker and was heated to evaporation at 100oC in a fume cupboard. It was then removed from the heating mantle and allowed to cool. 10ml of aqua regia was also added to the beaker and its content was heated to dryness. The beaker was removed and allowed to cool. Then 25ml of distilled water was added to the beaker, stirred and filtered in 100ml volumetric flask and made to mark. The digested sample was transferred to the sample bottles and labelled ready for analysis. The heavy metals such as Cu, Fe, Mn, Zn, Cd and Pb were determined using Shimadzu AA-3000 model of Atomic Absorption Spectrophotometry (AAS).
2.3 Determination of Physicochemical properties
Chloride
Chloride was determined in a natural or slightly alkaline solution by titration with standard silver nitrate, using potassium chromate as an indicator. Silver chloride is quantitatively precipitated before red silver chromate is formed.
Chloride mg/L = (A-B) x N x 35.45 x 1000/ ml sample
Where A = ml AgNO3 required for sample
B = ml AgNO3 required for blank
N = Normality of AgNO3 used
2.4 Determination of pH of the Water Sample
The pH meter was calibrated; the instrument was brought to standby mode. The electrode was removed from the second buffer solution and rinsed thoroughly with distilled water, dried and immersed in water sample in a beaker. After the equilibrium between electrode and sample was established (by stirring gently and waiting for 1 minute), the pH of sample was measured when reading was constant. Where the sample temperature is different from the temperature of standard buffer, then temperature of pH meter was adjusted using temperature compensation before recording the pH of the sample. pH and temperature was noted and recorded. The electrode was rinsed and immersed in standard buffer until the next measurement. The pH measurement was repeated to get two concordant readings. On completing experiment, the electrode was returned to storage solution after rinsing with distilled water.
2.5 Measurement of Conductance of Water Sample
The meter was first calibrated. The cell was rinsed first with distilled water then with sample water. The sample water was put in a dry beaker with the conductivity cell dipped in it. The meter switch was shifted to READ. The conductance of sample water was read and noted together with the temperature to nearest 0.1°C. Then, the meter switch was shifted at CAL position and the cell was rinsed thoroughly with distilled water after measurement. The conductance measurement was repeated to get at least two concordant readings. Most of the modern instruments are direct reading.
2.6 Acidity
50 ml sample was added in a conical flask and 3 drops of methyl orange indicator solution was added. The burette was filled with 0.02 N NaOH solution and titrated till the color of solution changed to a faint orange color, indicating the end point. The volume of titrant consumed was recorded as V1 in ml. The methyl orange acidity was calculated.
Methyl orange acidity (or Mineral Acidity) = (V1×1000)/ (Sample volume)
When the 0.02 N NaOH solution, used in titration is not standardized, mineral acidity is calculated using the following Eq:
Methyl orange acidity= (V1×N×50×1000)/ (Sample vol.)
For phenolphthalein acidity test, 2-3 drops of phenolphthalein indicator solution was added to water sample and the titration was continued till the faint pink color develops in the solution (i.e., the end point of titration). The volume of titrand consumed was recorded as V2 (mL) and total acidity or phenolphthalein acidity was calculated.
Total acidity (or Phenolphthalein Acidity) = (V2×N×50×1000)/ (Sample vol.)
2.7 Determination of Ammonia by Titrimetric Method
1% amount of wet sample was weighed, equivalent to approximately 1g dry weight, in a weighing bottle or crucible. The sample was washed into a 500-mL kjeldahl flask with water and dilute to 250 mL. A piece of paraffin wax was added to distillation flask and only 100 mL distillate was collected. Ammonia in distillate was titrated with standard 0.02N H2SO4 titrant until indicator turns a pale lavender. A blank was carried through all steps of the procedure and necessary correction to the results was applied.
2.8 Determination of COLOR by Spectrophotometric Method
The spectrophotometer was verified to be zeroed. The cell was rinsed with a small amount of the filtered sample, and discarded. Enough of the filtered samples was transferred to the sample cuvette, filling to the reference line. The absorbance was measured and recorded at 465 ηm and discarded. Rinse the cell thoroughly with deionized and/or distilled water. The spectrophotometer was periodically verified to be zeroed.
Calculation/Result
The linear regression equation from the calibration curve was used to calculate the corresponding color value of the samples.
y=mx+b
where: y is the absorbance, m is the slope, b is the y-intercept., x is the calculated color value.
2.9 Determination of Fluoride using Ion Selective Electrode
The electrode was immersed for 1 h in the cell which contains the reference solution-V. After rinsing with the first solution to be measured, the electrode was ready for use. 25 mL of the buffer solution, followed by 25mL of the water sample were pipetted into a measuring cell. The pH was adjusted with hydrochloric acid solution to 5.2 ± 0.2. All the solutions were measured according to the same procedure at a constant temperature of 25 ± 0.5°C. A stirring bar was added to the measuring cell and placed on the magnetic stirrer and the electrodes were inserted into the solution fixed in place. The stirring rate was adjusted to about 180 min/L to 200 min/L. The stirrer was switched off at near constant potential and the value obtained was recorded. The stirring bar and the electrodes were rinsed with the next solution to be measured, before starting the next measurement.
2.10 Total Dissolved Solid (TDS)
To measure total dissolved solids, a clean porcelain dish was used, washed and dried in a hot air oven at 180 degrees celsius for one hour. The empty evaporating dish was weighed in analytical balance. The sample was mixed well and poured into a funnel with filter paper. 80mL of sample was filtered. With the use of pipette, 75mL of unfiltered sample was transferred into the porcelain dish. The oven was switched on and allowed to reach 105°C. The oven and furnace temperatures was checked and regulated frequently to maintain the desired temperature range and placed in the hot air oven with care to prevent splattering of sample during evaporation or boiling. The sample was dried to get constant mass. Drying for long duration usually 2 hours is done to eliminate necessity of checking for constant mass. The container was cooled in a desiccator. Desiccators are designed to provide an environment of standard dryness. The dish was weighed as soon as it has cooled to avoid absorption of moisture due to its hygroscopic nature.
CALCULATION AND RESULT
Tabulation for Total Dissolved Solids (TDS):
Weight of the clean porcelain evaporating dish (g) = W1
Weight of the dish and the residue (g) = W2
Weight of residue (g) = W
The volume of the sample (mL) = V
Weight of residue (g) W = W2 – W1
Weight of residue in mg (To convert W (g) to W (mg), multiply W (g) with 1000) W (mg)
Description Total Dissolved Solids (mg/L) V = Volume of the sample (mL) (To convert mL to L, multiply by 1000)
2.11 Total Hardness:
100 ml of the sample was taken and 2 ml buffer solution was added to it, and then, 3 drops of Black T was added and Titrated with standard EDTA solution (with continuous stirring) until the last reddish color disappears. At the end point the solution turns blue. The volume used was noted.
Hardness will be calculated as follows:
Hardness (in mg/L as CaCO3) = (V× N × 50 ×1000) / (SV) (5)
Where: V = volume of titrant (mL); N = normality of EDTA; 50 = equivalent weight of CaCO3; SV = sample volume (mL)
2.12 Sulfate
250 mL of the sample was taken in a conical flask .The acidity was adjusted with HCl to 4.5 using a pH meter. Then an additional 1 to 2mL HCl was added. The solution was heated to boiling and stirred gently, barium chloride solution was added slowly until precipitation appear to be completed. Then about 2 ml of barium chloride solution was again added in excess. The precipitate was digested at 80°C overnight for not less than 2 hours. The content was filtered in the flask through an ash less filter paper. The precipitate was washed with small portion of warm distilled water until the washing is free of chloride as indicated by testing with silver nitrate-nitric acid reagent. The precipitate was placed along with filter paper in a crucible after finding its empty weight and dries it. The crucible was kept in a muffle furnace and ignites at 800°C for 1 hour and was cooled in a desiccator and weighed. Weight of the barium sulfate precipitate was found.
Calculation
SO4 in mg/L = ![]()
2.13 Bacteriological analysis:
For Bacteriological analyses, various tests were performed in a step-wise pattern to confirm the presence of Pathogens in Water samples. Presumptive Coliform Test was applied to determine Most Probable Number (MPN) of Coliform through Multi-tube technique. The samples positive for Presumptive test was subjected to different tests for confirmation of E. coli presence. For this purpose, EMB agar was used to culture the samples. The samples were streaked on agar plates, labelled with a specific source code and incubated for 24-48 hours at 37 0C. The 24-hours positive samples were cultured. Each positive sample was cultured on Lactose broth and Nutrient agar slant and incubated at 37 0C for 24 hours.
Total Bacteria Counts
28 grams of nutrient agar was suspended in 1000ml of distilled water by heating and stirring. It was autoclaved for 15 minutes at 121°C, refrigerated and divided into Petri dishes and allowed to cool down at room temperature. The spread plate method was used. Serial dilution of each of the samples of water was prepared. Of each water sample, 0.1ml was spread on the nutrient Agar plate and incubated for 24 hours at 37°C. The number of colonies per plate, and the units of colony formation per ml (CFU/ml) were calculated. For the identification of bacterial species, sub cultures was carried out on MacConkey and mannitol salt Agars.
Total Coliform Count
The total coliform count was determined by most probable number (MPN) index method. Serial dilution of the sample was prepared. The 1st set of five tubes had 10ml of double strength MacConkeybroth, the second and third set had 10ml single strength of lactose broth with all the test tubes containing Durham tubes. All the tubes received 1ml of the water samples. These were incubated at 37°C for 24 hours for total coliform count. Acid production was determined by color changes in the tubes to yellow and gas production was determined by the gas trapped in the Durham tubes.
Fecal Coliform Count
The fecal coliform count was estimated using EMB (Eosin Methylene blue Agar) streaking method. A loop of broth from the positive tubes was streaked on EMB Agar. The plates were incubated at 37°C for 24 hours. The Colonies on the EMB plate is metallic green which confirmed the presence of Escherichia coli strains.
RESULTS AND DISCUSSIONS
3.1 Results for Heavy Metals
The Table 1.0 shown below is the result of mean concentration of some Heavy metals in the samples as determined using Atomic Absorption Spectro photometer
Table 1: The mean concentration of the Heavy metals in the water samples
| Sample ID | Cd (mg/l) | Fe (mg/l) | Zn (mg/l) | Mn (mg/l) | Cu (mg/l) | Pb (mg/l) |
| SAMIS- BOREHOLE | 0.0883 | 0.1349 | 0.0000 | 0.1166 | 0.0000 | 0.2708 |
| BU- BOREHOLE | 0.0872 | 0.1351 | 0.1184 | 0.0833 | 0.3955 | 0.0000 |
| DRP- BOREHOLE | 0.0914 | 0.1964 | 0.8888 | 0.3500 | 1.6427 | 1.3154 |
| AVS- BOREHOLE | 0.0883 | 0.1055 | 0.0169 | 0.0821 | 0.1308 | 0.0000 |
| TH- BOREHOLE | 0.1113 | 0.0547 | 0.0000 | 0.3516 | 0.2205 | 1.5729 |
| BMCI- BOREHOLE | 0.0898 | 0.0826 | 0.0041 | 0.3691 | 0.1809 | 1.6262 |
| BMCI-Well water | 0.1003 | 0.2298 | 0.0000 | 0.4598 | 0.1865 | 1.3544 |
| BU-Well water | 0.0951 | 0.1279 | 0.0000 | 0.0497 | 0.0175 | 1.4227 |
| RHLC- BOREHOLE | 0.0875 | 0.0972 | 0.0412 | 0.0985 | 0.0306 | 0.0000 |
| JSS P – BOREHOLE | 0.0890 | 0.0670 | 0.0000 | 0.0834 | 0.1333 | 1.5453 |
| JSS P – Well water | 0.0910 | 0.1386 | 0.0000 | 0.0687 | 0.0295 | 1.2560 |
| CC- BOREHOLE | 0.0931 | 0.0898 | 0.0000 | 0.4021 | 0.2110 | 1.4877 |
| SA- Well water | 0.1062 | 0.0666 | 0.0000 | 0.3720 | 0.2116 | 1.2904 |
| LBS- BOREHOLE | 0.0951 | 0.0300 | 0.0000 | 0.3337 | 0.2272 | 1.4776 |
| AL-BOREHOLE | 0.0886 | 0.1066 | 0.0000 | 0.3136 | 0.2279 | 1.4189 |
| WHO | 0.0030 | 0.3000 | 3.0000 | 0.0500 | 2.0000 | 0.0100 |
| USEPA | 0.0050 | 0.3000 | 5.0000 | 0.0500 | 1.0000 | 0.0150 |
| NESREA | 0.0030 | 0.3000 | 3.0000 | 0.0500 | 1.0000 | 0.0100 |
3.1.1 Manganese
The mean values for both well and borehole water samples from the fifteen locations which fall within the WHO and NSDWQ standard value (0.1mg/l) include, Samis-borehole, Bu-borehole, AVS-borehole, JSS-borehole and JSS-Well. Drinking water containing high levels of manganese can lead to Neurological disorder [8].
3.1.2 Iron
It was found that the mean values of both well water and borehole water samples from all the fifteen locations are above the WHO, USEPA and NSDWQ standard value (0.3mg/l). However the mean values for borehole water samples shows they have higher values when compared to that of well water. Presence of iron in drinking water may be due to the use of various iron salts as coagulating agents in water-treatment plants and where cast iron, steel, and galvanized iron pipes are used for water distribution. The commercial activities of automobile mechanics, artisans and carcasses of abandoned and unserviceable cars could be seen in the neighbourhood of sampling sites, High presence of iron in water promotes undesirable bacterial growth (“iron bacteria”) within a waterworks and distribution system, resulting in the deposition of a slimy coating on the piping. Aeration of iron-containing layers in the soil can affect the quality of groundwater if the nitrate leaching takes place.
3.1.3 Lead
The mean value of lead in the well and borehole water samples is above the WHO and NSDWQ standard value (0.01mg/l), except for AVS- borehole, BU-borehole and RHLC-borehole which is within the standard value. The presence of high lead concentration in water samples for the six locations might be due to the pesticides used decades ago or industrial activities that contaminated the soil and groundwater. Additionally, this could also result from household plumbing activities around the sampling sites. Excessive amount of lead in water can cause cancer, kidney disease, memory problems, high blood pressure, brain damage, hearing loss and behavioural problems [8]
3.1.4 Cadmium
The mean value of all water samples is above the WHO, USEPA and NSDWQ standard value (0.003 and 0.005mg/l). The results of animal studies suggest that very small amounts of cadmium in water can produce nephrotoxic and cardiovascular effects and large amount can damage the kidney, liver and heart and in severe cases may cause death. Higher levels of cadmium in water from the fifteen locations can result from the use and disposal of items containing cadmium. Cadmium may be derived from natural or industrial sources, or from cadmium compounds used in the production of plastic water pipes [9].
3.1.5 Zinc
The result shows that the values are below the USEPA, WHO and NESREA standard value (5 and 3 mg/l). Adverse effects of high zinc intake include nausea, vomiting, loss of appetite, abdominal cramps, diarrhoea, and headaches. Intakes of 150–450 mg of zinc per day have been associated with such chronic effects as low copper status, altered iron function and reduced immune function. Zinc can also interact with certain medications such as antibiotics, diuretics, and penicillamine (a drug used to treat rheumatoid arthritis) (NIS).
3.1.6 Copper
The mean value of Copper in the well and borehole water samples is below the WHO, USEPA and NESREA standard values (2.0 and 1.0 mg/l). The major source of copper in drinking water is corrosion of household plumbing and water fixtures. Copper is an essential micronutrient. The body requires copper in very small amounts. However, very large single or long-term intakes of copper may be harmful to your health [10]. Excess copper in the human body can cause stomach and intestinal distress such as nausea, vomiting, diarrhea and stomach cramps.
3.2 Result of Bacterial Count in the water Samples
The Table 2 shown below is the result of Total Bacteria Count, Total Coli form Count and E Coli in the samples as determined.
Table 2: Bacterial Count on the Water Samples
| Sample ID | TBC (Total Bacteria Count) (cfu/ml) | TCC (Total Coliform Count) (cfu/ml) | E coli |
| SAMIS- BOREHOLE | 60 | NIL | NIL |
| BU- BOREHOLE | 40 | 7 | NIL |
| DRP- BOREHOLE | TNTC | NIL | NIL |
| AVS- BOREHOLE | 83 | NIL | NIL |
| TH- BOREHOLE | 112 | NIL | NIL |
| BMCI- BOREHOLE | 140 | 7 | NIL |
| BMCI-Well water | TNTC | 6 | NIL |
| BU-Well water | 55 | 15 | NIL |
| RHLC- BOREHOLE | 70 | NIL | NIL |
| JSS P – BOREHOLE | 80 | 10 | NIL |
| JSS P – Well water | TNTC | 14 | NIL |
| CC- BOREHOLE | 170 | 15 | NIL |
| SA- Well water | TNTC | 20 | NIL |
| LBS- BOREHOLE | 210 | 30 | NIL |
| AL-BOREHOLE | 30 | 10 | NIL |
3.2.1 E COLI
The concentrations of the E coli in well water and borehole water samples from the fifteen school areas were found to be zero. The presence of E. coli is used as an indicator to monitor the possible presence of other more harmful microbes, such as Cryptosporidium, Giardia, Shigella, and norovirus. Some possible sources of fecal contamination include; agricultural runoff, wildlife that uses the water as their natural habitat, runoff from areas contaminated with pet manure, wastewater treatment plants, and on-site septic systems. Heavy precipitation may cause these organisms to be washed into creeks, rivers, streams, lakes, or ground water. Therefore, there is no potential health risk that exists for the communities due to the presence of microbial pathogens in water.
3.2.2 Total Coliform Count
Total coliform include bacteria that are found in the soil, in water that has been influenced by surface water. The total coliform was detected in the following samples; BU-borehole (7cfu/ml), BMCI-borehole (7cfu/ml), BMCI-WELL (6 cfu/ml), BU-well (15 cfu/ml), JSS P-borehole (10 cfu/ml), JSS P-well (14 cfu/ml), CC-borehole (15 cfu/ml), SA- well (20 cfu/ml), LBS-borehole (30 cfu/ml) and AL-borehole (10 cfu/ml). A positive total coliform sample should be considered an indication of pollution in your well (NYSD). Therefore, there is potential health risk of contracting a water-borne illness in these given locations.
3.2.3 Total Bacteria Count
The most basic test for bacterial contamination of a water supply is the test for total bacteria count. The standard for total bacteria count is 100cfu/100ml. The following locations are above the limit, DRP-borehole (TNTC cfu/ml), TH-borehole (112 cfu/ml), BMCI-borehole (140 cfu/ml), BMCI-WELL (TNTC cfu/ml), JSS P-well (TNTC cfu/ml), CC-borehole ((170 cfu/ml), SA- well (TNTCcfu/ml), LBS-borehole (210 cfu/ml).
Therefore, there is potential health risk of contracting a water-borne illness in these given locations.
3.3 The Results of Physicochemical Parameters of the Water Samples
The Table 3.0 shown below is the result of some Physicochemical Parameters of the water samples collected from school areas as determined
3.3.1 Odour
The odour of the well and borehole water samples from all the locations were found to be agreeable, and odourless, except for borehole water in CC- BOREHOLE, Well water in JSS Piwoyi, borehole water in TH- BOREHOLE and BMCI. Edema [11] suggests that the most troublesome and objectionable situations are created by man-made sources, such as domestic and industrial wastes and agricultural activities.
3.3.2 Colour
The samples in the fifteen locations were colourless. The colourless nature of the sample in some areas may be as a result of low dissolved and suspended solids in the water samples, and high level of dissolved and suspended solids in the areas where the water samples were found turbid. Colour in drinking water can be caused by dissolved and suspended materials, which may be due to natural causes or human activity [12].
3.3.3 pH
The pH values of the well and borehole samples are all within the permissible limit specified by the SON, except for the mean results of the borehole water from Samis- borehole water (5.91), RHLC-BOREHOLE (6.33), DRP- BOREHOLE (5.91) and ABS-BOREHOLE (6.42) which are below 6.5 and are slightly acidic but they are fairly comparable with the standard value of the SON (6.5 – 8.5). Drinking water with an elevated pH above 11 can cause skin, eye and mucous membrane irritation. On the opposite end of the scale, pH values below 6.5 cause ulcer and irritation due to the corrosive effect of the low pH level (Wikipedia-pH, 2010).
3.3.4 Conductivity
The result the conductivity of the samples ranges between 123-9385, with the AVS and TH-Boreholes having the highest of 9385 and 8677 respectively. The instrument is standardized with known values of conductance observed with standard KCl solution. Das et al [15] suggested that the underground drinking water quality of study area can be checked effectively by controlling conductivity of water and this may also be applied to water quality management of other study areas.
3.3.5 Turbidity
The turbidity mean results of the fifteen locations show that they are all below the permissible limit given by the SON (5 NTU). This is due to little or no presence of colloidal solids presents in the water that causes cloudy appearance and reduction in transparency. The higher the turbidity level, the higher the risk that people may develop gastrointestinal diseases [13]. This is especially problematic for immune-compromised people, because contaminants like viruses or bacteria can become attached to the suspended solids.
3.3.6 Total Dissolved Solids
The TDS in well water samples in the fifteen locations ranged between 80mg/l to 2230mg/l while that for borehole water samples ranged from 352mg/l to 6100mg/l, which shows that the Borehole water in the fifteen locations contain higher content of TDS than the well water samples. All the given water samples are above the standard value (500mg/l) except for BMCI borehole, Rich Hill learning centre borehole and Baze University borehole, which is below the permissible limit. A high TDS level alters the taste of water and makes it salty, bitter or metallic.
3.3.7 Chloride
Chloride content in the water quality serves as an indicator of pollution by sewage [14].. People accustomed to higher chloride in water are subjected to laxative effects. In the present analysis, chloride content, for all the mean values are below the standard value (250mg/l).
| Sample ID | Colour | Odour | Temp (oC) | Alkalinity(mg/ml) | Acidity(mg/ml) | Hardness. (mg/ml) | Appearance | pH | TDS (mg/l) | Turb (NTU) | Conductivity (mg/l) | Cl–(mg/l) | NH3 (mg/l) | S042- (mg/l) | F–(mg/l) |
| SAMIS- BOREHOLE | Colourless | Unobjectionable | 31 | 1.9 | 3.2 | Not clear | 5.91 | 2080 | 0.7 | 3200 | 0 | 0.049 | 155.9 | 0.01 | |
| BU- BOREHOLE | Colourless | Unobjectionable | 28 | 1.7 | 1.1 | 3.4 | Clear | 6.60 | 1610 | 0.4 | 2477 | 0 | 0.028 | 46.17 | 0.01 |
| DRP- BOREHOLE | Colourless | Unobjectionable | 29 | 1.7 | 1.4 | 2.4 | Not clear | 5.91 | 563 | 2.0 | 866 | 0 | 0.042 | 77.71 | 0.38 |
| AVS- BOREHOLE | Colourless | Unobjectionable | 27 | 2.0 | 1.6 | 3.6 | Clear | 6.42 | 6100 | 0.8 | 9385 | 0 | 0.077 | 67.47 | 0.02 |
| TH- BOREHOLE | Colourless | Objectionable | 29 | 3.8 | 1.8 | 2.0 | Clear | 6.96 | 5640 | 0.3 | 8677 | 0 | 0.056 | 186.2 | 0.01 |
| BMCI- BOREHOLE | Colourless | Objectionable | 32 | 2.6 | 0.8 | 3.2 | Not clear | 7.34 | 352 | 0.6 | 542 | 0 | 0.056 | 47.83 | 0.01 |
| BMCI-Well water | Colourless | Unobjectionable | 31 | 2.4 | 1.4 | 2.8 | Not clear | 6.61 | 1570 | 3.1 | 2415 | 0 | 0.049 | 55.58 | 0.02 |
| BU-Well water | Colourless | Unobjectionable | 28 | 1.5 | 1.2 | 2.0 | Clear | 6.69 | 80 | 1.3 | 123 | 79.41 | 0.056 | 35.61 | 0.01 |
| RHLC- BOREHOLE | Colourless | Unobjectionable | 28 | 2.0 | 0.7 | 2.0 | Clear | 6.33 | 437 | 0.2 | 672 | 0 | 0.035 | 50.80 | 0.01 |
| JSS P – BOREHOLE | Colourless | Unobjectionable | 30 | 1.5 | 1.3 | 2.0 | Clear | 6.54 | 545 | 0.5 | 838 | 0 | 0.049 | 25.87 | 2.10 |
| JSS P – Well water | Colourless | Objectionable | 31 | 4.3 | 1.1 | 1.6 | Not clear | 7.56 | 1190 | 0.5 | 1830 | 0 | 0.049 | 37.76 | 0.01 |
| CC- BOREHOLE | Colourless | Objectionable | 29 | 4.5 | 2.2 | 1.2 | Not clear | 7.40 | 1700 | 0.4 | 2615 | 0 | 0.014 | 36.44 | 0.01 |
| SA- Well water | Colourless | Unobjectionable | 27 | 2.7 | 1.9 | 1.8 | Not clear | 7.48 | 2230 | 0.3 | 3430 | 0 | 0.035 | 55.42 | 0.02 |
| LBS- BOREHOLE | Colourless | Unobjectionable | 27 | 7.3 | 1.7 | 2.2 | Clear | 7.28 | 3160 | 0.4 | 4861 | 0 | 0.056 | 80.35 | 0 |
| AL-BOREHOLE | Colourless | Unobjectionable | 30 | 3.0 | 1.9 | 3.0 | Clear | 7.37 | 3870 | 0.3 | 5953 | 0 | 0.014 | 46.17 | 0.01 |
| Son Standard | colourless | Odourless | 500 | 500 | 6.5-8.5 | 1500 | 5 | 250 | 400 | 1.5 |
Table 3.0: Physicochemical Parameters of the Water Samples
3.3.8 Total Alkalinity
The alkalinity of the water samples from the fifteen locations ranged from 1.5mg/l to 5.5mg/l. The amount of Alkalinity that should be in our water is 20-200 mg/l for typical drinking water. The water samples are not above the SON standard. Because high alkalinity disrupts the pH balance, it can lead to calcium build up.
The alkalinity of water is a measure of its capacity to neutralize acids. It is primarily due to salts of weak acids, although weak or strong base may also contribute. Alkalinity is usually impacted by bicarbonate, carbonate and hydroxide [16].
3.3.9 Hardness
From the result obtained, the mean value for hardness in well and borehole water samples from the fifteen locations ranged between 1.2- 3.6 mg/ml and are well below the SON permissible limit of 500mg/l [17]. General guidelines for classification of waters hardness are: 0 to 60 mg/L (milligrams per liter) as calcium carbonate is classified as soft ; 61 to 120 mg/L as moderately hard; 121 to 180 mg/L as hard; and more than 180 mg/L as very hard.
3.3.10 Fluoride
The fluoride mean result shows that the samples are below the given SON value which is 4.0 mg/l. High concentration of fluoride can result from climate of the area and the presence of volcanic and basaltic rocks which can alter the appearance of children’s teeth during tooth development; this is mostly mild and usually only an aesthetic concern [19].
3.3.11 Acidity and Alkalinity
The mean Acidity and Alkalinity values for the analysed samples ranged between 0.7-1.9 and 1.5-7.3 mg/ml respectively. Alkalinity acts as a stabilizer for pH.
3.3.12 Sulphate
The Sulphate ions concentration ranged between 186.2 mg/l in TH- BOREHOLE and 25.87 mg/l in JSS P – BOREHOLE which are below the SON permissible limit of 200-400mg/l. Sulphate increases the conductivity of water and so enhances corrosion processes which can then lead to a higher concentration of metals in the water [18]. High levels of sulphate affect the taste of the water.
3.3.13 Ammonia
Ammonia ion concentration ranges between 0.014mg/l and 0.077mg/l and are below the SON standard of 1.5mg/l for ammonia. The mean result from the fifteen locations is below the permissible limit. Ammonia is not of direct importance for health in the concentrations to be expected in drinking water. A health based guideline has therefore not been derived.
CONCLUSION AND RECOMMENDATION
3.5.1 Conclusion
From the overall results obtained, it is seen that pH values for (Salem Academy, Avannal School. Rich Hill Learning centre and De Royal Pearl) are all below the permissible limit specified by WHO and NSDWQ. Also, turbidity for all the fifteen locations for both borehole and well water are below the WHO and NSDWQ standard value. The chemical parameters like iron and lead in the studied areas are above the WHO and NSDWQ standard value. The microbial growth for well water in both bore hole and well water were found to be nil. As a result of these, the drinking waters from these study areas are not suitable for drinking but can be used for other domestic purpose, such as laundry, washing etc.
3.5.2 Recommendation
- Proper sanitation should be strictly observed around the vicinity of the boreholes and well water in these areas.
- Regular monitoring of water sources to ensure conformity to the SON or WHO standards and to assure the public of the portability of their water is necessary. In fact simple tests carried out regularly at short intervals are of more valued than detailed test mode occasionally.
REFERENCES
- Adekunle, I.M., Adetunji M.T., Gbadebo A. M and Banjoko O.B. (2007). Assessment of Groundwater Quality in a Typical Rural Settlement in Southwest Nigeria Int. J. Environ. Res. Public Health, 4(4), 307-318
- World Health Organisation (WHO), (2004). Guidelines for drinking-water quality 3rd Ed. Vol. 1 Geneva Pp. 145-196.
- Azizi, F.; Mohammadzadeh, H. Aquifer (2012). Vulnerability and evaluation of groundwater quality spatial variations in Ghachsaran Emamzadeh Jaafar plain using DRASTIC model and GWQI index. Water Eng. 2012, 5, 1–14.
- Edori, O. S. and Kpee, F. (2016). Physicochemical and heavy metal assessment of water samples from boreholes near some abattoirs in Port Harcourt, Rivers State, Nigeria. American Chemical Science Journal, 14(3): 1-8.
- Adepoju-Bello, A. A., Ojomolade, O. O. Ayoola, G. A. and Coker, H. A. B. (2009). Quantitative analysis of some toxic metals in domestic water obtained from Lagos metropolis. The Nig. J. Pharm., 42(1): 57-60
- Akpoveta O.V., Okoh B.E., and Osakwe S.A. (2011). Quality Assessment of Borehole Water used in the Vicinities of Benin, Edo State and Agbor, Delta State of Nigeria. Current Research in Chemistry, 3: 62-69.
- Alloway, B. J and Ayres D.C., (1997). Chemical principles of Environmental Pollution 2nd Ed. University of London UK Pp. 44-46.
- SON (2007) Nigerian Standard for Drinking Water Quality. Sttandard Organization Nigeria (SON).
- WHO/UNICEF (2012). Estimated data from WHO/UNICEF Joint Monitoring Programme (JMP) for water supply and sanitation. Progress on sanitation and drinking water. Geneva Switzerland and NewYork, NY, USA, 4.
- Nyakundi, V. , Munala, G. , Makworo, M. , Shikuku, J. , Ali, M. and Song’oro, E. (2020) Assessment of Drinking Water Quality in Umoja Innercore Estate, Nairobi. Journal of Water Resource and Protection, 12, 36-49. doi: 10.4236/jwarp.2020.121002.
- Edema M.O, Omemu, A.M (2001). Microbiology and Physiochemical Analysis of Different Water Sources. Int. J. Microbiol., 15(1): 57-61.
- Igwilo, I.O., O.J. Afonne, U.J. Maduabuchi and O.E. Orisakwe, (2006). Toxicological study of the Anam River in Otuocha, Anambra State, Nigeria. Arch. Environ. Occup. Health, 61(5): 205-208.
- Edori, O. S. and Kpee, F. (2016). Physicochemical and heavy metal assessment of water samples from boreholes near some abattoirs in Port Harcourt, Rivers State, Nigeria. American Chemical Science Journal, 14(3): 1-8
- Hassan Omer, N. (2020). Water Quality Parameters. IntechOpen. doi: 10.5772/intechopen.89657
- Das CR, Das S, Panda S. (2022) Groundwater quality monitoring by correlation, regression and hierarchical clustering analyses using WQI and PAST tools. Groundw Sustain Dev.
- Elinge, C. M., Itodo, A. U. Peni, I. J., Birnin-Yauri, U. A. and Mbongo, A. N. (2011). Assessment of heavy metals concentrations in bore-hole waters in Aliero Community of Kebbi State. Advances in Applied Research, 2(4): 279-282.
- APHA (1999) Standard Methods for the Examination of Water and Wastewater. American Public Health Association, Washington DC.
- Jibrin., N. A (2019) Evaluation of Groundwater Quality in Some Rural Areas of the Federal Capital Territory, Abuja, Nigeria Nigerian Research Journal of Chemical Sciences (ISSN: 2682-6054) Vol. 7.
- Den Besten P, Li W. Monogr Oral Sci. 2011;22:81-96. doi: 10.1159/000327028. Epub 2011 Jun 23. PMID: 21701193