
Implementation of the Fuzzy C-Means Method for Clustering Stunting Areas in West Sumatra
- Dr. Susila Bahri
- Rahayu Ningsih
- Dr. Ahmad Iqbal Baqi
- 186-193
- May 7, 2024
- Mathematics
Implementation of the Fuzzy C-Means Method for Clustering Stunting Areas in West Sumatra
Dr. Susila Bahri1*, Rahayu Ningsih2, Dr. Ahmad Iqbal Baqi3
Department of Mathematics and Data Science, University of Andalas
*Corresponding Author
DOI: https://doi.org/10.51584/IJRIAS.2024.904013
Received: 08 March 2024; Revised: 02 April 2024; Accepted: 05 April 2024; Published: 07 May 2024
ABSTRACT
Although the prevalence of stunting in Indonesia decreased from 27.6% to 21.6% from 2020 to 2022, this value still exceeds the target prevalence set by the WHO. West Sumatra is one of the provinces that contribute significantly to this prevalence. This research aims to classify 19 regencies and cities into stunting vulnerability groups (high, moderate, low) based on factors contributing to stunting reduction. By employing the FCM method, the study identified four areas with high stunting vulnerability, eight with moderate stunting, and seven with low stunting We performed the computation using Matlab software.
Keywords— Stunting vulnerability, FCM method, Prevalence, Stunting, Factors contributing to stunting reduction
INTRODUCTION
According to the Indonesian Nutrition Status Survey (SSGI), the prevalence rate of stunting in Indonesia decreased from 27.6% to 21.6% from 2020 to 2022 [1]. This figure remains above the target prevalence set by the World Health Organization (WHO). West Sumatra province has the highest stunting prevalence rate, reaching 25.2%, surpassing the WHO standard. Among the 19 districts in this province, West Pasaman district has the highest prevalence rate at 35.5%, while Sawahlunto city has the lowest stunting rate at 13.7% [2].
According to Databoks, in 2022, out of 19 districts/cities in West Sumatra, there are still 11 districts/cities that have a prevalence rate of stunting above 20%. However, their stunting prevalence rates exceed the WHO standard in other towns or districts. These rates still need to be considered low and have yet to reach the government’s target of reducing stunting prevalence by 14% [2].
Clustering is a technique used to group data into several clusters or groups so that the data within one cluster have a high degree of similarity. In contrast, the data between clusters have a low degree of similarity. Fuzzy clustering is a clustering method that considers the degree of membership in a fuzzy set as the basis for weighting in clustering [3]. Fuzzy C-Means determine the presence of each data point in a cluster based on its degree of membership [4].
In 2021, Tri Mulyaningsih et al. studied stunted children in Indonesia. The researchers used a multilevel determinant model to analyze the determinants of stunting at the household, district/city, and provincial levels by analyzing data on stunted children using [ 5]. In contrast to that study, this research utilizes the fuzzy c-means method to group regions or districts/cities based on factors contributing to stunting reduction. The Matlab software assists in classifying stunting levels in an area.
A. Factors Influencing the Reduction of Stunting
The factors or variables influencing the prevalence of stunted toddlers used in this study are as follows: The availability of community health centers or the ratio of community health centers per 100,000 population(X1), The availability of active integrated health posts or the proportion of villages with sufficient integrated health posts(X2), The availability of doctors or the ratio of doctors per 100,000 population(X3), The availability of nutritionists or the ratio of nutritionists per 100,000 population(X4), The availability of midwives or the ratio of midwives per 100,000 population(X5), Percentage of infants with low birth weight (X6), Adequacy of infant health services or the ratio of the number of infants aged 29 standards(X7), and adequacy of toddler health services or the ratio of the number of children under five years old receiving health services according to standards(X8). Stunting factors influence the area or location, dividing it into three clusters: areas with high, moderate, and low levels of stunting [6].
B. Fuzzy C-Means Method
The Fuzzy C-Means (FCM) method is a clustering technique frequently employed in the data analysis and identification of patterns [7]. The Fuzzy C-Means Algorithm is:[6]
1. Insert the data on factors influencing stunting in West Sumatra into the following Table I
TABLE I: The Factors Influencing Stunting West Sumatera In 2022
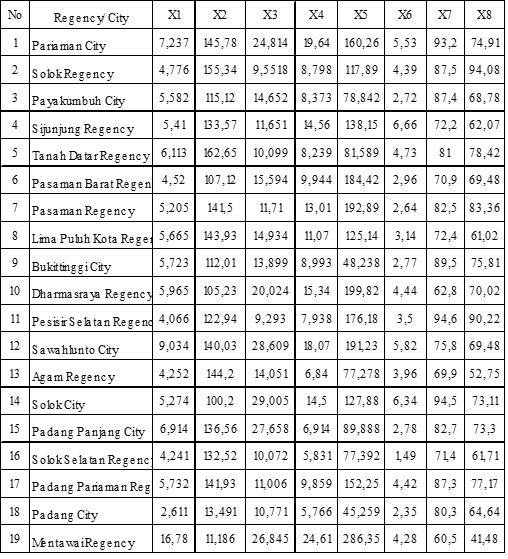
As elements of a matrix with dimensions n x m, where n represents the 19 districts in West Sumatra, and m represents the eight factors (variables) contributing to the reduction of stunting, is presented in Fig 1.
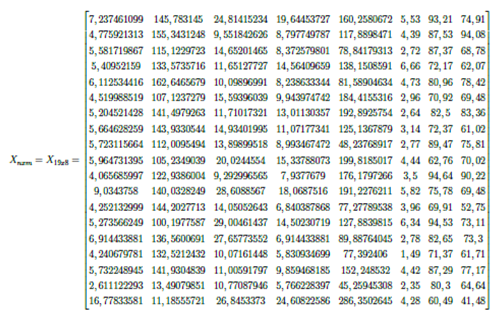
Fig 1 Matrix the factors influencing stunting in West Sumatra in 2022
2. Establishing parameters, parameter descriptions, and parameter values used in the Fuzzy C-Means method. The parameters and their descriptions are the number of clusters (c=3), the power (w=2), the maximum iteration (maxiter=100), the slightest error (e=1e-5), and the initial function objective(P0=0).
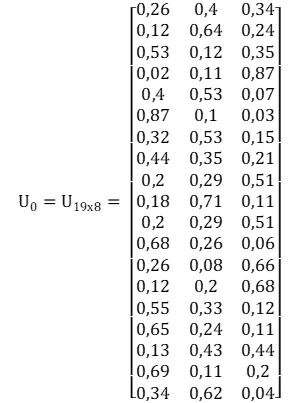
3. For the initial iteration t=1, generate real random numbers uik where i = 1,2,…,19 and the number of clusters k = 1,2,3 as elements of the initial partition matrix U0. Matrix U0 represents the initial membership degrees of each district for each cluster.
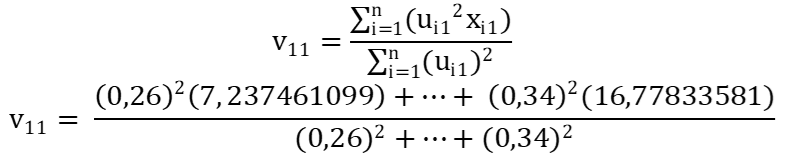
4. Calculate the centroid values of each cluster (V) in the first iteration. The formula to compute the cluster centroids is
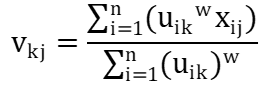
As an example of calculating the center of the first cluster for variable X1:
Using the same method, the center values of clusters 1, 2, 3 for each variable x1,…,x8 will be obtained as shown in Table II.
TABLE II: Center Values for First Iteration
| Center | X1 | X2 | X3 | X4 | X5 | X6 | X7 | X8 |
| 1 | 5,7325 | 109,378 | 17,0068 | 10,2746 | 128,807 | 3,2756 | 76,7129 | 67,859 |
| 2 | 7,2206 | 118,523 | 16,8703 | 13,4215 | 163,623 | 4,1084 | 77,2978 | 72,799 |
| 3 | 7,2309 | 118,691 | 16,8942 | 13,4405 | 163,855 | 4,1142 | 77,4074 | 72,902 |
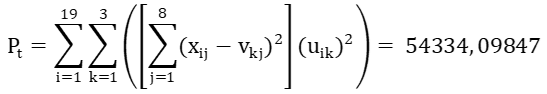
5. Calculate the objective function for the first iteration (P1). Using the equation, you can compute the accurate function value for the first iteration.
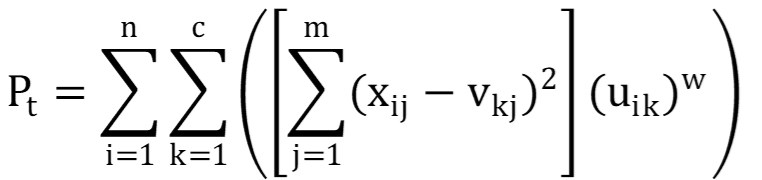
The calculation of the objective function in the first iteration (P1)
6. Calculate the new values of the Uik matrix for the first iteration based on the formula in the equation.
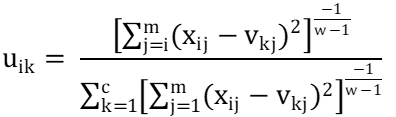
The membership degree value of object 1 in the first iteration is as follows:
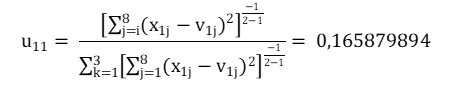
Applying the same method, we obtain new membership degrees and present them in Table III.
TABLE III: The Degree of the New Partition Matrix
| Regency/ City | cluster 1 | cluster 2 | cluster 3 |
| Pariaman City | 0,16588 | 0,4148 | 0,41932 |
| Solok Regency | 0,39698 | 0,30162 | 0,3014 |
| Payakumbuh City | 0,58101 | 0,21006 | 0,20893 |
| Sijunjung Regency | 0,40132 | 0,30081 | 0,29787 |
| Tanah Datar Regency | 0,45599 | 0,27234 | 0,27167 |
| Pasaman Barat Regency | 0,09162 | 0,45299 | 0,45539 |
| Pasaman Regency | 0,12398 | 0,43458 | 0,44144 |
| Lima Puluh Kota Regency | 0,47376 | 0,26387 | 0,26237 |
| Bukittinggi City | 0,50171 | 0,24963 | 0,24866 |
| Dharmasraya Regency | 0,13942 | 0,4292 | 0,43138 |
| Pesisir Selatan Regency | 0,11586 | 0,43853 | 0,44561 |
| Sawahlunto City | 0,1214 | 0,43619 | 0,4424 |
| Agam Regency | 0,50879 | 0,24614 | 0,24507 |
| Solok City | 0,6309 | 0,18537 | 0,18373 |
| Padang Panjang City | 0,54961 | 0,2257 | 0,22469 |
| Solok Selatan Regency | 0,5436 | 0,22877 | 0,22763 |
| Padang Pariaman Regency | 0,18563 | 0,40595 | 0,40843 |
| Padang City | 0,43704 | 0,28199 | 0,28097 |
| Mentawai Regency | 0,28222 | 0,35881 | 0,35896 |
7. Check the stopping condition for t=1 (initial iteration)
The clustering process concludes when the absolute difference between Pt and Pt-1 is less than 1e-5. As |P1 − P0| = |54334.0985 − 0| = 54334.0985 > 1e-5, the fourth step is reiterated until the value of |Pt − Pt−1| < 1e−5.
In this study, using the Matlab program, the iteration process stops at the 88th iteration with the value: |P88− P87| = |26581, 903000500 − 26581, 903009057| = 0, 000008557< 1e−5. With the final membership degree values at the 88th iteration In Table IV, the last membership values (Uakhir) for the 88th iteration will be displayed as follows:
TABLE IV: The Degree of the Iteration 88
| Regency/ City | cluster 1 | cluster 2 | cluster 3 |
| Pariaman City | 0,0513 | 0,8604 | 0,08883 |
| Solok Regency | 0,3418 | 0,558 | 0,1002 |
| Payakumbuh City | 0,9619 | 0,028 | 0,0101 |
| Sijunjung Regency | 0,0975 | 0,8288 | 0,0737 |
| Tanah Datar Regency | 0,7392 | 0,1997 | 0,0611 |
| Pasaman Barat Regency | 0,0248 | 0,1399 | 0,8352 |
| Pasaman Regency | 0,0728 | 0,5009 | 0,4263 |
| Lima Puluh Kota Regency | 0,2552 | 0,6556 | 0,0892 |
| Bukittinggi City | 0,8603 | 0,0956 | 0,0442 |
| Dharmasraya Regency | 0,0056 | 0,0238 | 0,9705 |
| Pesisir Selatan Regency | 0,0733 | 0,613 | 0,3137 |
| Sawahlunto City | 0,4765 | 0,455 | 0,0684 |
| Agam Regency | 0,8667 | 0,0986 | 0,0348 |
| Solok City | 0,2854 | 0,5403 | 0,1743 |
| Padang Panjang City | 0,8679 | 0,1035 | 0,0287 |
| Solok Selatan Regency | 0,0119 | 0,0338 | 0,9543 |
| Padang Pariaman Regency | 0,0202 | 0,9537 | 0,0261 |
| Padang City | 0,5081 | 0,2708 | 0,2212 |
| Mentawai Regency | 0,1607 | 0,2629 | 0,5764 |
Uakhir obtained the location of the cluster from each area, as shown in Table V.
TABLE V: Location of the Cluster of Each Data
| Regency/ City | cluster 1 | cluster 2 | cluster 3 |
| Pariaman City | * | ||
| Solok Regency | * | ||
| Payakumbuh City | * | ||
| Sijunjung Regency | * | ||
| Tanah Datar Regency | * | ||
| Pasaman Barat Regency | * | ||
| Pasaman Regency | * | ||
| Lima Puluh Kota Regency | * | ||
| Bukittinggi City | * | ||
| Dharmasraya Regency | * | ||
| Pesisir Selatan Regency | * | ||
| Sawahlunto City | * | ||
| Agam Regency | * | ||
| Solok City | * | ||
| Padang Panjang City | * | ||
| Solok Selatan Regency | * | ||
| Padang Pariaman Regency | * | ||
| Padang City | * | ||
| Mentawai Regency | * |
Observation of the clustering results is possible in Table VI
TABLE VI: Result Clustering
| Regency/ City | cluster | Total |
| Payakumbuh City, Tanah Datar Regency, Agam City, Bukittinggi City, Sawahlunto City, Padang City, Padang Panjang City. | 1 | 7 |
| Pariaman City, Solok Regency, Sijunjung Regency, Pasaman Regency, Lima Puluh Kota Regency, Pesisir Selatan Regency, Solok City, Padang pariaman Regency. | 2 | 8 |
| Pasaman Barat Regency, Dharmasraya Regency, Solok Selatan Regency, Mentawai Regency | 3 | 4 |
Cluster characterization of the variables (factors) contributes to reducing stunting. The tool is employed to determine the level of stunting in a region. Subsequently, the cluster centroid values will be presented in Table VII.
TABLE VII: Cluster Centroid
| Center | X1 | X2 | X3 | X4 | X5 | X6 | X7 | X8 |
| 1 | 5,3117 | 125,597 | 19,3187 | 14,6299 | 199,674 | 3,0117 | 84,0856 | 68,122 |
| 2 | 5,9305 | 133,74 | 15,8973 | 13,0988 | 150,18 | 4,7894 | 80,3997 | 74,0492 |
| 3 | 7,0281 | 98,7981 | 15,0462 | 7,6905 | 77,9703 | 3,9661 | 69,3883 | 67,8853 |
Observe the cluster centroid values for each variable in Table VII. three levels of stunting in the region are high, medium, and low. Therefore, for cluster 1, the variables with the highest centroid values are X3, X4, X5, and X7, while the variables with medium centroid values are X2 and X8. Subsequently, the variables with low centroid values are X1 and X6 for the other clusters. Similarly obtained as Table VIII.
TABLE VIII: Cluster Characteristics
| cluster 1 | cluster 2 | cluster 3 | |
| high | X3, X4, X5, X7 | X2, X6, X8 | X1 |
| medium | X2, X8 | X1, X3, X4, X5, X7 | X6 |
| low | X1, X6 | X2, X3, X4, X5, X7, X8 |
CONCLUSIONS
- Analyzing the clustering results of regions with factors influencing the reduction of stunting in West Sumatra using the Fuzzy C-Means method reveals that Kota Payakumbuh, Tanah Datar District, Agam City, Bukittinggi City, Sawahlunto City, Padang City, and Padang Panjang City, classified into cluster 1, display a low level of stunting vulnerabilityThe low level of stunting vulnerability in these areas is attributed to four high factors contributing to stunting reduction: the availability of doctors, nutritionists, and midwives per 100,000 population, along with the adequacy of infant health services or the ratio of the number of infants aged 29 days to 11 months receiving health services according to standards. These factors are more abundant compared to other clusters.
- Regions in cluster 2, namely Pariaman City, Solok District, Sijunjung District, Pasaman District, Lima Puluh Kota District, Pesisir Selatan District, Solok City, and Padang Pariaman District, exhibit a moderate level of stunting vulnerability due to the availability of active integrated health posts and high adequacy of health services for toddlers, or a high ratio of the number of children under five years old receiving health services according to standards.
- Meanwhile, cluster 3, comprising the regions Pasaman Barat District, Dharmasraya District, Solok Selatan District, and Mentawai Islands District, have a high level of stunting vulnerability because these areas have one high factor contributing to stunting reduction, namely the availability of community health centers) or the ratio of community health centers per 100,000 population.
REFERENCES
- Annur, Cindy Mutia. (2023). Daftar Prevalensi Balita Stunting di Indonesiapada 2022. https://databoks.katadata.co.id/datapublish/2023/02/02/daftar-prevalensi-balita;stunting-di-indonesia-pada-2022-provinsi-mana-teratas.
- Annur, Cindy Mutia. (2023). Ini Wilayah denganPrevalensi Stunting Tertinggi di Sumatra Barat pada 2022. https://databoks.katadata.co.id/datapublish/2023/02/16/ini-wilayah-dengan-prevalensi-stunting-tertinggi-di-sumatra-barat-pada-2022.
- Nurmin, D., Hayati, M. N., &Goejantoro, R. (2022). Penerapan Metode Fuzzy C-Means Pada PengelompokanKabupaten/Kota di Pulau Kalimantan BerdasarkanIndikatorKesejahteraan Rakyat Tahun 2020. EKSPONENSIAL, 13(2), 189-196.
- Wijayanti, W., HG, I. R., & YANUAR, F. (2021). Penggunaan Metode Fuzzy C-Means Untuk PengelompokanProvinsi di Indonesia BerdasarkanIndikator Kesehatan Lingkungan. JurnalMatematika UNAND, 10(1), 129-136.
- Mulyaningsih, T., Mohanty, I., Widyaningsih, V., Gebremedhin, T. A., Miranti, R., &Wiyono, V. H. (2021). Beyond personal factors: Multilevel determinants of childhood stunting in Indonesia. PloS one, 16(11), e0260265.
- Christyanti, R. D., Sulaiman, D., Utomo, A. P., & Ayyub, M. (2022). Implementation of Fuzzy C-Means in Clustering Stunting Prone Areas. International Journal of Natural Science and Engineering, 6(3)
- Setiawan, K. E., Kurniawan, A., Chowanda, A., & Suhartono, D. (2023). Clustering models for hospitals in Jakarta using fuzzy c-means and k-means. Procedia Computer Science, 216, 356-363.