
Integration of Petrophysical and 3D Seismic Attribute Analyses for Reservoir Characterization in Agana Field, Onshore Niger Delta, Nigeria
- Odiegwu Chukwukelu
- Aniwetalu Emmanuel
- Obiadi Izuchukwu
- Ahaneku Chibuzor
- Umeh Maureen
- Okeke George
- 344-359
- Jun 15, 2024
- Petroleum Engineering
Integration of Petrophysical and 3D Seismic Attribute Analyses for Reservoir Characterization in Agana Field, Onshore Niger Delta, Nigeria
Odiegwu Chukwukelu*1, Aniwetalu Emmanuel1, Obiadi Izuchukwu1, Ahaneku Chibuzor2, Umeh Maureen1, Okeke George1
1Department of Applied Geophysics, Nnamdi Azikiwe University, Awka, Anambra State, Nigeria
2Department of Geological Sciences Nnamdi Azikiwe University, Awka, Anambra State, Nigeria
*Corresponding Author
DOI: https://doi.org/10.51584/IJRIAS.2024.905031
Received: 04 May 2024; Accepted: 15 May 2024; Published: 15 June 2024
ABSTRACT
The study integrates petrophysical analysis, attribute studies of 3D seismic data to analyze structures, delineate reservoirs, identify prospects and estimate reserves within the Agana field. The study area is located in the coastal swamp of the Eastern Niger Delta. Four wells were used for the study. Four reservoirs A, B, C and D were identified and correlated across the wells. Volume attribute studies revealed a complexly faulted region. A total of sixty six faults were mapped and were labeled F1 to F66. The major faults were trending East-West direction, while the minor faults were trending in Northeast-Southwest direction. The trapping mechanism identified from the interpretation indicates that the field is characterized mostly by fault assisted closures. The results of the three surface attributes; RMS Amplitude, Extract value, Sum of Positive Amplitudes extracted from the subsurface structure maps identified only one prospect, B1 on horizon B. The average petrophysical parameters of reservoir B in the four wells which included thickness, net-to-gross, volume of shale, water saturation, hydrocarbon saturation and porosity, were calculated as 485.99ft, 0.58, 0.20, 0.52, 0.48, and 0.21, respectively. These average parameters were used to estimate the reserve for the identified prospect B1. The calculated results for Hydrocarbon Initially In Place (HIIP) and Hydrocarbon Pore Volume (HPV), are 303,709.43×106 STB, and 455,564.15ft3 respectively. Risk analysis based on Geologic Chance of Success showed that the prospect can be explored with 56% chance of success. The result showed integration of petrophysical and structural analysis with attribute studies to be more efficient in identifying prospect so that where structural interpretation is inefficient attribute studies compliment.
Keywords: Petrophysical Analysis, Attribute Analysis, Reservoirs, Hydrocarbon and Structures
INTRODUCTION
Despite growing calls to jettison the use of fossil fuels and work towards energy transition as occasioned by the reality of climate change, major countries of the world would continue to exploit their oil and gas reserves in pursuit of economic emancipation hence leaving a strong future for the oil and gas industry. The quest for industrialization has in no way placed pressure and greater challenge to increase energy supply.
Seismic data is most often used to identify potential structures for hydrocarbon accumulations (Telford et al., 1990). Subsurface configurations must be understood in details to effectively delineate the structures that are favourable for hydrocarbon accumulation (Coffen, 1984). This is because hydrocarbons are found in geologic traps that is, any combination of rock structure that will prevent oil and gas from escaping either vertically or laterally, (Wan, 1995). However these traps can either be structural or stratigraphic. According to Doust, and Omatsola, (1990), majority of the traps in the Niger Delta are structural and therefore focus in this study has been channeled towards mapping the structural traps available within the study area.
Conventional structural and stratigraphic interpretations have been the popular way of interpreting seismic data for the purpose of mapping geological structures, subsurface stratigraphy and reservoir architecture. It is often difficult to map subtle faults and other trace-to-trace discontinuities hidden in 3D seismic data by using conventional seismic interpretation methods. This is because they have smaller throws relative to the resolution limit of the seismic survey, which is a factor dependent on the frequency content, signal to noise ratio (SNR) of the dataset and also the depth to the reflecting horizon. (Odoh, et al, 2014)
Also complexly faulted subsurface configuration is capable of causing erroneous deductions if a well packaged interpretation approach and workflow are not put in place. For this reason many potential hydrocarbon reservoirs have been by-passed. Hence, the need to integrate structural analysis with attribute studies to extract more from the seismic data set and for a better visualization of the subsurface, and to use a well prepared analysis hinged on the use and integration of sufficient data for the unravelling of complex field subsurface structure as the search for oil and gas progresses into deeper waters.
As oil and gas targets have become more geologically complex, pressure has increased on seismic interpretation technologies to squeeze maximum value out of datasets and identify seismic anomalies that are linked to hydrocarbon-bearing structures and potential direct hydrocarbon indicators.
One means of doing this is through the use of attributes. Attributes today are integral to seismic interpretation, revealing otherwise hidden geological information and allowing relevant information to be extracted for integration purposes.
A seismic attribute is a quantity extracted or derived from seismic data that can be analyzed in order to enhance information that might be more subtle in a traditional seismic image, leading to a better geological or geophysical interpretation of the data.
Seismic attribute analysis helps to identify structural features missed using the conventional method of interpretation. It is important to note that not only does seismic attribute analysis help to identify structural features; it also helps to increase the chances of success and development of new prospect areas. Seismic attribute studies can and should play an important role in the development of reservoir management strategies.
A reservoir is a subsurface rock that has effective porosity and permeability which usually contains commercially exploitable quantity of hydrocarbon. Reservoir characterization is undertaken to determine its capability to both store and transmit fluid. Hence, characterization deals with the determination of reservoir properties/parameters such as porosity (Φ), permeability (K), fluid saturation, and Net Pay thickness. It is well recognized that improvements in reservoir characterization will reduce the amount of unexploitable hydrocarbon. This study attempts to integrate structural analysis and attribute studies of a seismic data in other to delineate and characterize potential reservoirs in the Agana field and also to estimate the reserve.
Geology and tectonic framework of the study area
The study area is located in the Coastal Swamp Depobelt of the Eastern Niger Delta basin. The Niger Delta is a major hydrocarbon producing basin in Nigeria where intensive exploration and exploitation activities have been on since early 1960’s owing to the discovery of commercial oil in Oloibiri-1 well in 1956 (Reijers et al., 1996).
The Niger Delta is situated in southern Nigeria (Fig. 1) between latitudes 3° N and 6° N and longitude 5° E and 8° E (Nwachukwu, and Chukwura, 1986). It covers an area of 75,000sqkm. It is bounded to the west and northwest by the western African shield, which terminates at the Benin hinge line and to the east, by the Calabar hinge line. The Anambra basin and Abakaliki anticlinorium mark its northern limit. To the south, it is bounded by the gulf of Guinea. The onshore portion of the Niger Delta province is delineated by the geology of southern Nigeria and southwestern Cameroon.
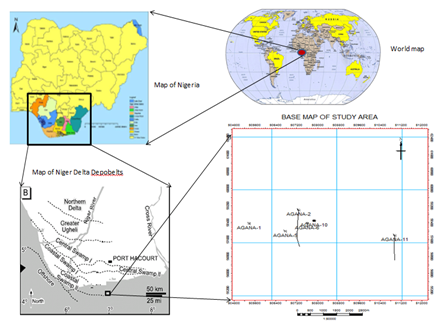
Fig. 1. Map of the study area showing the depobelts and the well locations
The tectonic framework of the continental margin along the West coast of Equatorial Africa is controlled by Cretaceous fracture zones expressed as trenches and ridges in the deep Atlantic. The fracture zone ridges subdivide the margin into individual basins and in Nigeria, form the boundary faults of the Cretaceous Benue-Abakaliki trough, which cuts far into the West African shield. The trough represents the failed arm of a rift triple junction associated with the opening of the southern Atlantic. The Delta formed at this site of a rift triple junction related to the opening of the Southern Atlantic starting in the Late Jurassic and continuing into the Cretaceous. After rifting ceased during Late Cretaceous (Lehner and De Ruiter, 1997), gravity tectonism became the primary deformational process. Shale mobility induced internal deformation and occurred in response to two processes (Kulke, 1995). First Shale diapirs formed from loading of poorly compacted, over-pressured, prodelta and delta slope clays (Akata Fm) by the higher density delta-front sands (Agbada Fm). Second, slope instability occurred due to lack of lateral basin ward support for the under-compacted delta-slope clays (Akata Fm). For any given depobelts, gravity tectonics were completed before the deposition of the Benin Formation and are expressed in complex structures including Shale diapirs, roll-over anticlines, collapsed crest structures, growth fault, back to back features and steeply dipping closely spaced flank faults. (Evamy and others 1978, Xiao and Suppe, 1992). These faults mostly offset different parts of the Agbada Fm and flatten into detachment planes near the top of the Akata Formation.
The Tertiary section of the Niger-Delta is divided into three Formations, representing prograding depositional facies that are distinguished mostly on the basis of sand-shale ratios. They are namely Benin Formation, the Paralic Agbada Formation and Prodelta Marine Akata Formation.
The Akata Formation at the base of the Niger-Delta is of marine origin and is composed of thick shale sequence, turbidite sand and minor amount of clay and silt. Beginning in the Paleocene and through the Recent, the Akata Formation formed during lowstands when terrestrial organic matter and clays were transported to deep water areas characterized by low energy conditions and energy deficiency (Stacher, 1995). Little of the formation has been drilled therefore only a structural map of the top of the formation is available. It is estimated that the formation is up to 7000m thick. (Doust and Omatsola, 1990). The formation underlies the entire delta and is typically over pressured.
The Agbada formation consists of paralic siliciclastics over 3,700m thick and represents the actual deltaic portion of the sequence. The clastics accumulated in delta-front delta-topset and fluvio-deltaic environment. The Benin formation is the uppermost unit. It is a continental latest Eocene to Recent deposit of alluvial and upper coastal plain sands that are up to 2000m thick (Avbovbo, 1978). It consists predominantly of freshwater bearing massive continental sands and gravels deposited in an upper deltaic plain environment and extends from the west across the whole Niger Delta area and southward beyond the existing coastline.
Most known traps in Niger Delta fields are structural although stratigraphic traps are not uncommon, Doust, H., Omatsola, M. E. (1990). The structural traps developed during synsedimentary deformation of the Agbada paralic sequence (Evamy et al, 1978), Stacher, P. (1995). Structural complexity increases from the north (earlier formed depobelts) to the south (later formed depobelts) in response to increasing instability of the under-compacted, over-pressured shale. Doust, H., Omatsola, M. E. (1990) describe a variety of structural trapping elements, including those associated with simple rollover structures (almost all the oil fields discovered so far in the Niger Delta complex are associated with roll-over anticlines.); clay filled channels, structures with multiple growth faults, structures with antithetic faults, and collapsed crest structures. The primary seal rock in the Niger Delta is the interbedded shale within the Agbada Formation. The shale provides three types of seals—clay smears along faults, interbedded sealing units against which reservoir sands are juxtaposed due to faulting, and vertical seals (Doust and Omatsola, 1990).
MATERIALS AND METHODS
The data used in this study were obtained from Shell Petroleum Development Company (SPDC) Port Harcourt. They consist of three dimensional Seismic reflection data, comprising (673 in-lines and 425 cross-lines); suite of geophysical wire-line logs for the six wells; a base map, check-shot, well header, and deviation data. Time-Structure and Depth-Structure maps were generated from the seismic sections while formation parameters such as porosity, water saturation, and net to gross were calculated from petro-physics. The procedures taken for both phases were carefully done with consideration of the objectives of the study. The software used for the data interpretation is the Schlumberger Petrel Interpretation software.
A quality control was carried out on the provided data to check for errors.
The entire data were loaded into the Schlumberger interpretation software in stages. The seismic data were loaded first and realized to decrease the memory space occupied on RAM. This was followed by the well data, deviation data, checkshot data and log data.
Well Correlation and petrophysical analysis
The analysis of well logs in this study was aimed at a qualitative determination of the properties of delineated reservoirs. The gamma ray log was used in identifying the lithology penetrated by the wells. A shale base line was first established. Maximum deflection of the log signature to the right of the shale base line was interpreted as shale while maximum deflection to the left of the shale base line was interpreted as sandstone. The resistivity log in combination with the GR log was used to differentiate between hydrocarbon and non-hydrocarbon bearing zones. In hydrocarbon bearing formation, the resistivity log signatures show high resistivity values than when in water bearing formation. Correlation of the identified reservoirs was carried out based on the similarity of the log signatures of gamma and resistivity logs. This was done to establish the areal extent and continuity of the reservoirs.
The volume of Shale, (Vsh) was calculated using the equation below;
Vsh = (GRlog – GRmin)/(GRmax – GRmin ) (1)
Where Vsh = Volume of shale
GRlog = Gamma ray log reading
GRmin = Minimum value of gamma ray reading
GRmax = Maximum value of gamma ray reading
Effective porosity, was calculated using the formular;
ΦE = ΦT – (Vsh x ΦT) (2)
Where ΦE = Effective porosity
ΦT = Total porosity
Vsh = Volume of shale
Total porosity was gotten using the equation:
ΦT = (ΦD )+ ΦN )/2 (3)
Where ΦT = Total porosity
ΦD = Porosity from density
ΦN = Porosity from neutron
Water saturation which is the percentage of pore space that is occupied by water, often expressed in percentage, was obtained from Archie’s equation as follows;
![]() (4)
(4)
Where SW = Water saturation
n= Saturation exponent taken as 1
a= empirical constant also taken as 1
RW = Resistivity of water formation
Φm = Cementation exponent taken as 2
Rt = True resistivity
Hydrocarbon Saturation, Sh is the percentage of pore volume in a formation occupied by hydrocarbon was determined by subtracting the value obtained for water saturation from 100% i.e.
Sh = (100 – Sw) % (5)
The gross reservoir thickness H, for each reservoir in all the wells was determined by looking at tops and bases of the reservoir sands across the well. It is the total thickness of the reservoir including the shaly units. The net thickness which is the sum of the thickness of all the sand units alone within each reservoir was determined as h. The net to gross was then calculated as follows.
NTG = h/H (6)
Where h = Net reservoir thickness
H = Gross reservoir thickness
The average (mean) value of each of the parameters was also calculated.
The calculated average values for reservoir B were used to estimate the reserve for the identified prospect as follows;
Hydrocarbon Initially In Place (HIIP)
HIIP = GRV X NTG X Փ X Sh X FVF (7)
Where GRV = Gross Rock Volume from survey map = 8.07051 x 106 ft3
NTG = Net to Gross
Փ = Porosity
Sh = Hydrocarbon Saturation = 1-Sw
FVF = Formation Volume Factor = 1.5
Hydrocarbon Pore Volume (HPV)
HPV = GRV X NTG X POROSITY X HYDROCARBON SATURATION (8)
A risk analysis was done on the identified prospect by adopting the standard of the Niger Delta basin and considering the key petroleum elements (source rock, reservoir rock, seal, trap, timing)
The Geologic Chance of Success is calculated thus;
GCS = Reservoir x Seal x Trap x Timing (8)
Seismic data analysis
Seismic-to-well tie compares the reservoir tops identified on the well logs with specific reflections on the seismic section. Seismic-To-Well tie was done using the sonic and density logs of Agana 10 well. These were multiplied to obtain the Acoustic Impedance (AI).
AI = v x ρ (9)
AI = Acoustic Impedance
V = p-wave velocity of the medium obtained from sonic log
ρ = Density of the medium
RC = (ρ2 v2 – ρ1 v1)/(ρ2 v2 + ρ1 v1 ) (10)
RC = Reflection Coefficient
ρ1v1 = Acoustic Impedance of first medium
ρ2v2 = Acoustic Impedance of the second medium
From the acoustic impedance, the Reflection Coefficient series were obtained and were convolved with the Ricker 35Hz wavelet generated by the software to generate the synthetic seismogram. The result showed a very good tie between the synthetic seismogram and the seismic data (fig 2).
A variance (edge) attribute was first run on the original seismic data as a recognissance to enhance visualization of the structural pattern of the study area. It was also used as a guide in mapping the faults in the study area.
Identification of faults on the seismic section was based on reflection discontinuity at fault plane, vertical displacement of reflection, mis-closures in tying reflections around loops, abrupt termination of events, overlapping of reflections, and change in pattern of events across the faults. Mapping of faults was done across the entire seismic volume.
Three horizons A, B and C were picked which coincided with the tops of sands A, B and C identified on the well logs. The horizons were picked using the time equivalent of the tops of sands A, B and C located on the well path. The corresponding time values of the three horizons on all the cross-lines were picked with the use of the in-lines to generate the time map. The depth of these sand tops were converted to time using the check-shots data, and the nearest, brightest and most continuous reflection were mapped on the in-lines and cross-lines. The three horizons were mapped round the whole seismic volume.
Seismic structural maps were generated to evaluate the geometry of the mapped horizons. These maps also give an interpreter a 3D perspective of the mapped surfaces. The time values of the three horizons were converted to depth with the use of the linear function below, which was generated from the check-shot data provided.
Y = -0.20514X – 464.265 (11)
This simple regression equation was used to generate the look up function for the time-depth conversion. The values obtained were used to produce the depth structure contoured maps.
Seismic structural maps were generated to evaluate the geometry of the mapped horizons. These maps also give an interpreter a 3D perspective of the mapped surfaces. The time values of the three horizons were converted to depth with the use of the linear function below, which was generated from the check-shot data provided.
Three attributes (i.e. Extract value, RMS Amplitude and Sum of positive Amplitude) were extracted from the depth structure maps and displayed as flattened maps for each of the interpreted horizons after surface attributes had been extracted from the depth structure maps, the prospect was identified. This was done by identifying bright spots, structural traps or closures found around fault blocks on the maps. The new Prospect (lead) is an area represented on the attribute map where hydrocarbons are likely to accumulate. This area was demarcated as P1. This was also correlated across all the attribute maps generated.
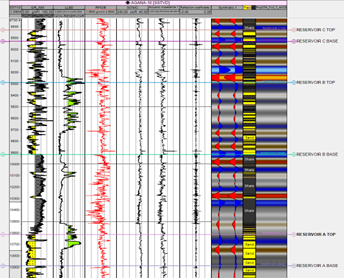
Fig. 2 Synthetic seismogram display using well 10 sonic log
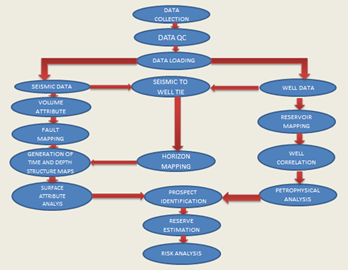
Fig. 3 Study workflow
RESULTS AND INTERPRETATION
Well log analysis
Four reservoirs were identified, Reservoir A, B, C and D. The reservoirs correlated across the four wells used in the study based on similarity in gamma ray and resistivity logs signatures. But they are of varying depths and thicknesses across the wells. Agana 5 and Agana 6 wells did not penetrate reservoir A which is the thickest reservoir. The result is shown below.
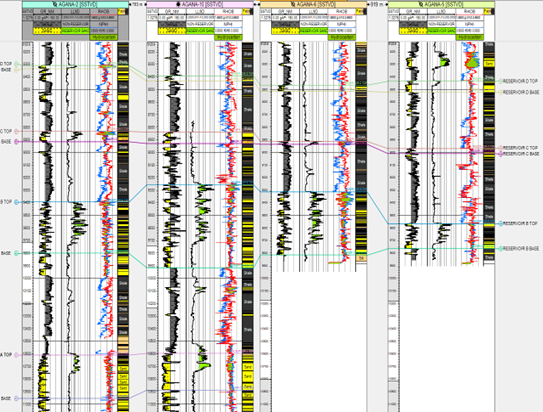
Fig. 4 Well log correlation panel for the four wells
Fault Interpretation
A surface attribute (variance edge) was run on the original seismic volume and a slice taken at 2000 ms. The result of the variance attribute studies revealed a complexly faulted region. The variance edge attribute helped to enhance visualization of the fault architecture of the region and served as a guide in the mapping of the faults. The result is shown in figure 5 below.
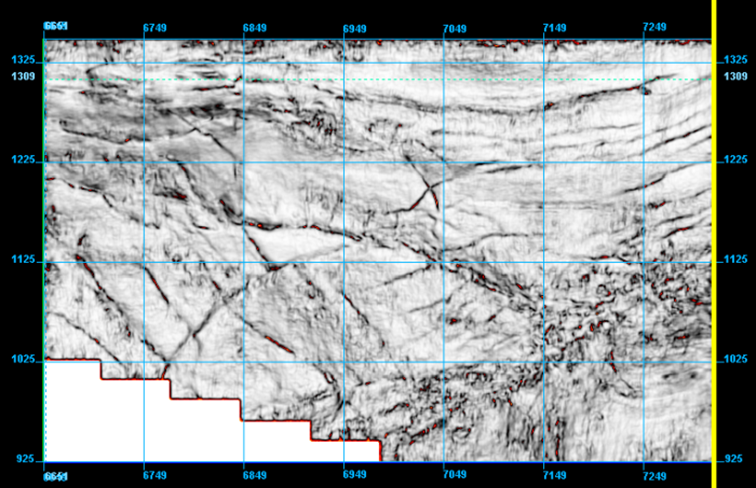
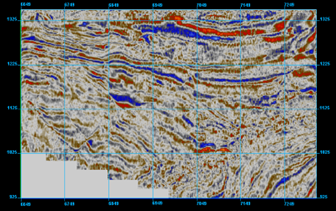
Fig. 5 Display of the variance edge and the seismic slices at 2000ms showing enhanced visualization of fault architecture
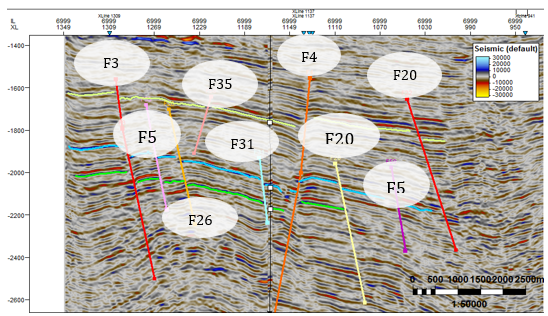
Fig. 6 Display of interpreted faults and horizons
The structural framework was done by picking assigned fault segments on inline sections of seismic with the trace appearing on the corresponding cross lines. These faults are represented on the seismic sections as a discontinuous reflection along a preferred orientation of reflectors or as distortion of amplitude around the fault zones. A total of sixty six faults coded as F1, F2, F3, F4, F5, F6, F8, F9, F10 to F66 were identified. The Northeast-Southwest trending faults F2 and F24 serve as a major
hydrocarbon traps for wells 10 and 6 in the region (fig 4.12). Also the East-West trending regional fault is an important trapping fault holding the hydrocarbon in well 5 (fig. 8).
Two major regional faults F3 and F4 (Figure 7) were identified and correlated across the field. The hydrocarbon traps are basically fault assisted.
Horizon Interpretation
A total of three horizons were interpreted across the field, horizon A, B, and C. These horizons coincided with the tops of the identified reservoirs A, B, and C in the four wells used in the study. The mapping was done across the entire survey area. Both time and depth structure maps were generated for each of the horizons. Figure 7 shows the seismic density display of the three horizons. Time structure maps were generated from the horizon maps. Also using the plot of time versus depth a look up function was generated for time to depth conversion. The time and depth structural maps for the three horizons showed great similarities. Figures 8A, 8B, 8C, 9A, 9B & 9C.
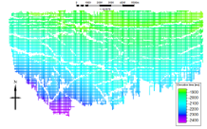
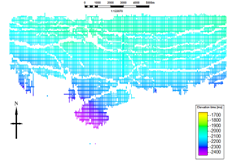
Fig. 7 Seismic density display of interpreted horizons A, B & C
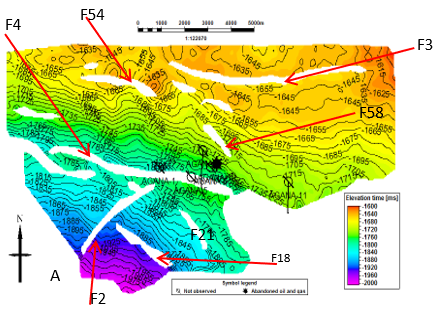
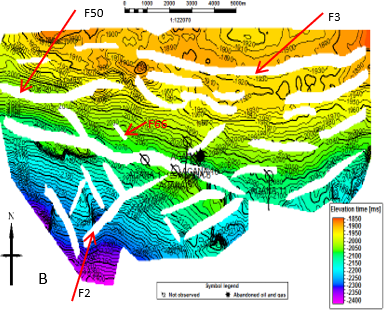
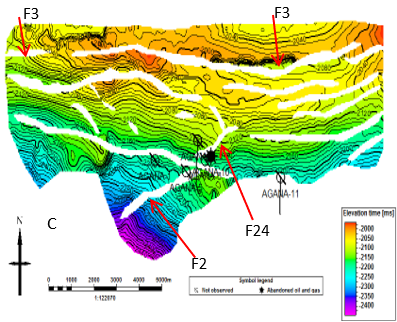
Fig.8. time maps of horizons A, B and C
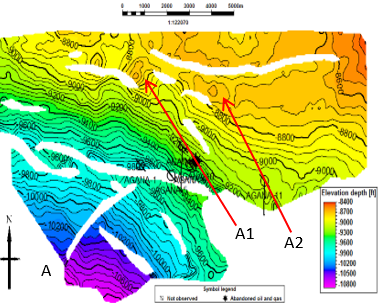
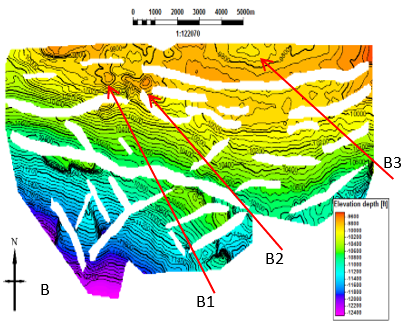
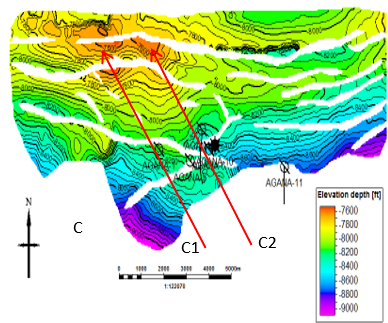
Fig.9. Depth structure maps of horizons A, B and C
On the depth map of A two closures that were fault assisted on F6 and F28 (figs 8A and 9A) were identified and were labeled as A1 and A2. On depth map of B two fault dependent closures on F4 and F53 (figs 8B and 9B) and one possible anticlinal closures labeled B1, B2, and B3 were identified on map B. Also, on map C two structural closures were identified C1 and C2 that were fault assisted on the regional fault F3 (figs 8C and 9C). These closures were identified on the structurally high areas. These were used as leads that were further subjected to attribute analysis for prospect identification.
Attribute Analysis and prospect identification
Three attributes (i.e. Extract value, RMS Amplitude and Sum of positive Amplitude) were extracted from the depth structure maps and displayed as flattened maps for each of the interpreted horizons (fig 10-12).
For horizon A the extract value attribute gave negative seismic attribute on the two identify structural closures A1 and A2 and the RMS amplitude attribute gave very low amplitudes on the structural closures showing no evidence of sand deposit. While the Sum of positive amplitude attribute gave zero amplitude on the same structural closures. Thus no prospect was identified on horizn A.
For reservoir B, the extract value amplitude gave positive values on the identify anticlinal closure B3 and negative seismic value on the fault dependent closures B1 and B2. While the RMS Amplitude analysis gave high values on the anticlinal closure B3 indicating evidence of sand deposit and negative values for the closures B1 and B2 indicating no evidence of sand deposit. And lastly, the analysis of the Sum of positive amplitude attribute yielded high amplitudes on anticlinal closure B3 indicating that the sand deposit is hydrocarbon saturated as only only hydrocarbon saturated sand can give rise to high RMS amplitude values and very low amplitudes on the fault dependent closures B1 and B2. Hence one prospect was identified on horizon B and is labelled P1.
For horizon C the extract value attribute gave negative seismic attribute on the two identify structural closures C1 and C2 and the RMS amplitude attribute gave very low amplitudes on the structural closures showing no evidence of sand deposit. While the Sum of positive amplitude attribute gave zero amplitude on the same structural closures. Thus no prospect was identified on horizn C.
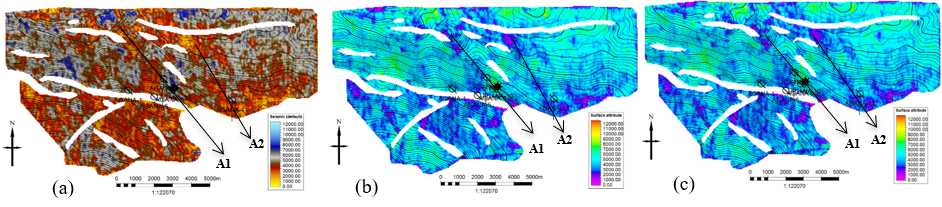
Fig. 10. Display of surface attribute map for Horizon A. (a) Extract value attribute. (b) RMS amplitude attribute (c) Sum of positive amplitude attribute. No prospect was identified on A1 & A2
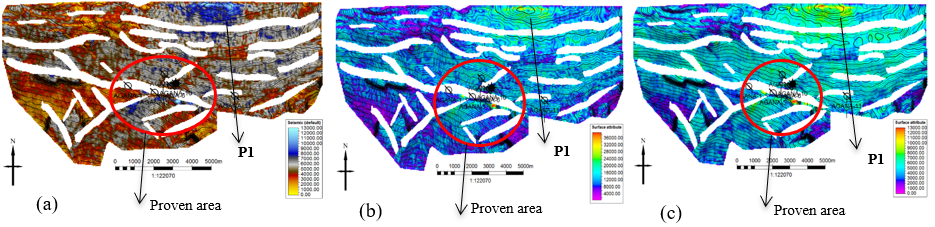
Fig. 11. Display of surface attribute map for Horizon B. (a) Extract value attribute. (b) RMS amplitude attribute (c) Sum of positive amplitude attribute.
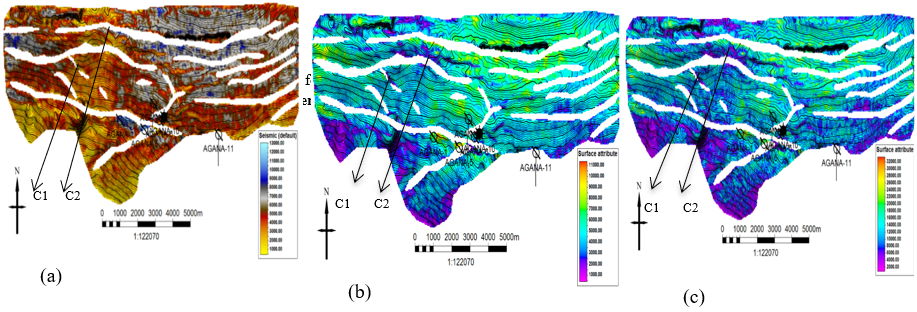
Fig. 12. Display of surface attribute map for Horizon C. (a) Extract value attribute. (b) RMS amplitude attribute (c) Sum of positive amplitude attribute. No prospect was identified on C1 & C2
| Horizon | Closure | Extract value | RMS Amplitude | Sum of positive amplitude | interpretation |
| A | A1 | Negative | Very low | Zero | No prospect |
| A2 | Negative | Very low | Zero | No prospect | |
| B | B1 | Negative | Very low | Zero | No prospect |
| B2 | Negative | Very low | Zero | No prospect | |
| B3 | Positive | High | Localized high | prospect | |
| C | C1 | Negative | Very low | Zero | No prospect |
| C2 | Negative | Very low | Zero | No prospect |
Table 1 Summary of seismic attribute studies of Horizon A, B, C
Petrophysical Evaluation
The result of the petrophysical evaluation of reservoir B is presented in the table below.
| Wells | Gross thickness (ft) | Net thickness (ft) | Net-To-Gross (NTG) | Shale volume (Vsh) | Water saturation (Ws) | Hydrocarbon saturation (Sh) | Porosity (ɸ) |
| Agana 02 | 582.34 | 314.46 | 0.54 | 0.39 | 0.54 | 0.46 | 0.22 |
| Agana 10 | 660.14 | 376.28 | 0.57 | 0.12 | 0.53 | 0.47 | 0.21 |
| Agana 06 | 502.90 | 241.39 | 0.48 | 0.14 | 0.46 | 0.54 | 0.15 |
| Agana 05 | 198.56 | 127.08 | 0.64 | 0.15 | 0.57 | 0.43 | 0.25 |
| Average | 485.99 | 264.80 | 0.56 | 0.20 | 0.52 | 0.48 | 0.21 |
Table 2. Summary of results of petrophysical evaluation of reservoir B
The result shows a good net-to-gross and very good porosity values for the reservoir.
Estimation of Reserve for identified prospect
The average petrophysical parameters of reservoir B were used to estimate the reserve of the identified prospect using the equation earlier stated above and the results are presented as follows;
- Hydrocarbon Pore Volume
HPV = GRV x NTG x Փ x Sh
Where: GRV = Gross Rock Volume from survey map = 8.07051 x 106 ft3
NTG = Net to Gross = 0.56
Փ = Porosity = 0.21
Sh = Hydrocarbon Saturation = 0.48
HPV = 8.07051 x 106 x 0.56 x 0.21 x 0.48
HPV = 4.55564 x 106 ft3
- Hydrocarbon Initially In Place (HIIP)
HIIP = HPV / FVF
FVF = Formation Volume Factor for oil = 1.5
HIIP = 455564.15 / 1.5 = 303,709.43X 106 STB
- Risk Analysis of Identified Prospect
Following the standard of Niger Delta values are assigned to the following key petroleum play elements as follows; Source rock = 1, Reservoir rock = 0.8, Seal = 1, Trap = 0.7, Timing = 1
The geologic chance of success is thus calculated as follows.
GCS = 1 x 0.8 x 1 x 0.7 x1 = 0.56 = 56%
CONCLUSION
Four reservoirs A, B, C, and D were identified and correlated across the 4 wells along depositional dip with reservoir B being the thickest and A being the deepest. All the reservoirs identified were hydrocarbon-bearing as revealed from the resistivity logs
Results of the variance (edge) attribute reveal the area under study to be a highly faulted region. A total of sixty six faults were identified. The major faults were trending east-west while the minor faults were trending north-south. The structures identified in the area are favourable for hydrocarbon accumulation.
From the results of the three attribute studies carried out, one prospect B3 was identified between 9600 ft and 9900 ft on horizon B. Other possible prospects were interpreted to be empty.
Petrophysical analysis of reservoir B gave net to gross as 0.56, water saturation as 0.52, hydrocarbon saturation as 0.48, and porosity, 0.21.
The Hydrocarbon Initially In Place (HIIP) for the identified prospect is 303709.43X 106 STB.
Risk analysis based on Geologic Chance of Success showed that the prospect can be explored with 56% chance of success. It is recommended that more seismic should be acquired towards the Northeast of the prospect in other to determine the extent of the closure and if there is a fault above the prospect B3. Also, a fault seal analysis should be carried out to ascertain the integrity of the fault.
Therefore, Interpretation of the 3D seismic data for prospect identification has been demonstrated to be more efficient by integrating structural analysis with attribute studies so that where structural analysis is inefficient attribute studies compliment.
REFERENCES
- Avbovbo A. A., 1978, Tertiary Lithostratigraphy of Niger Delta. American Association of Petroleum Geologists Bulletin, vol 62, pp. 295-300.
- Coffen, J. A., 1984, Interpreting seismic data: Penwell Publishing Company, Tulsa Oklahoma. pp. 39-118.
- Doust, H., Omatsola, M. E., 1990, Niger Delta, In : J. D. Edwards, P. A Santogrossi (eds.), Divergent/passive margin basins, American Association of Petroleum Geologists; pp. 239–248.
- Evamy, B.D., Haremboure, J., Kamerling, P., Molloy, F.A., and Rowlands, P.H., 1978, Hydrocarbon habitat of Tertiary Niger Delta: American Association of Petroleum Geologists Bulletin, vol. 62, pp. 1-39.
- Kulke, H., 1995, Nigeria, In, Kulke, H., Ed., Regional Petroleum Geology of the World. Part II: Africa; America; Australia And Antarctica: Berlin, Gebrüder Borntraeger, pp. 143-172.
- Lehner, P., and De Ruiter, P.A.C., 1977, Structural history of Atlantic Margin of Africa: American Association of Petroleum Geologists Bulletin, vol. 61, pp. 961-981.
- Nwachukwu, J.I. and Chukwurah, P.I., 1986, Organic matter of Agbada Formation, Niger Delta, Nigeria: American Association of Petroleum Geologists Bulletin, Vol. 70, pp 48-55.
- Odoh, B.I., Ilechukwu, J.N. and Okoli, N.I., 2014, The Use of Seismic Attributes to Enhance Fault Interpretation of OT Field, Niger Delta. International Journal of Geosciences, vol 5, pp. 826- 834.
- Reijers, T.J.A., S.W. Petters and C.S. Nwajide, 1996, The Niger Delta Basin, in: T.J.A. Reijers (ed.), Selected Chapters on Geology: SPDC corporate reprographic services, Warri, Nigeria, pp. 103- 114.
- Stacher, P. 1995, Present Understanding of the Niger Delta Hydrocarbon Habitat, In, Oti, M. N., and Postman Eds., Geology of Deltas: Rotterdam, A. A., Balkema, pp. 257-267.
- Wan Q., 1995, Reservoir delineation using 3-D seismic data of the Ping Hu field, East China, Thesis, University of Colorado. pp. 6-8
- Xiao, H., and Suppe, J., 1992, Origin of rollover: American Association of Petroleum Geologists Bulletin, vol. 76, pp. 509-229.