
Investigation of Heavy Metal Toxicity and Sustainability of Aquatic Ecosystems in Jabi Lake, Abuja
- Hadiza Abubakar Ahmad
- T.G. Mohammed
- Bugaje M. A.
- 269-283
- Mar 17, 2024
- Education
Investigation of Heavy Metal Toxicity and Sustainability of Aquatic Ecosystems in Jabi Lake, Abuja
Hadiza Abubakar Ahmad1*, T.G. Mohammed2 and Bugaje M. A.3
1Department of Geography and Environmental Management, University of Abuja, Nigeria.
2Crisis Management Centre, Department of State Service, Abuja, Nigeria.
4Department of Environmental Science and Management Technology Federal Polytechnic Nasarawa State , Nigeria
*Corresponding Author
DOI: https://doi.org/10.51584/IJRIAS.2024.90223
Received: 12 February 2024; Accepted: 14 February 2024; Published: 17 March 2024
ABSTRACT
The discharge of pollutants into freshwater ecosystems threatens environmental health and human means of livelihoods, especially in regions reliant on fisheries. This study explores the intricate relationship between aquatic toxicity and the Fauna sustainability in Jabi Lake, Abuja. Focusing on Clarias gariepinus, fish species. Nine fish samples and three water samples from Jabi Lake, Abuja, were analyzed for five heavy metals (Cu, Zn, Pb, Mn, and Fe), using Atomic Absorption Spectrometry (AAS). Results revealed permissible heavy metal concentrations in fish and water, according to FAO standards. However, prolonged exposure raises concerns for human health. Mean values for metal concentrations in fish (Cu 0.22±0.01 to 0.23±0.01 mg/kg; Zn 2.12±0.01 to 2.24±0.09 mg/kg; Pb 0.01±0.005 to 0.02±0.005 mg/kg; Mn 0.34±0.02 to 0.5±0.03 mg/kg; Fe 4.24±0.06 to 5.78±0.51 mg/kg), while in water (Cu 0.34±0.02 to 0.52±0.01 mg/l; Zn 2.91±0.045 to 3.2±0.19 mg/l; Pb 0.01±0.005 to 0.02±0.005 mg/l; Mn 0.71±0.01 to 0.9±0.02 mg/l; Fe 5.21±0.01 to 5.97±0.02 mg/l) were within permissible limits, except for Mn and Fe in water, which exceeded the WHO standards. Statistical analyses, including the student’s t-test (P<0.05), show significant differences in Pb, Zn, and Mn concentrations in fish and water, but not in Cu and Fe. Anthropogenic activities like construction, sand filling, illegal fishing, and waste disposal contribute to fish diversity depletion, affecting vulnerable species like Catfish, Tilapia, Nile Perch, and Crayfish. The study noted declining incomes for local fishers due to disappearing fish species. While Catfish muscle’s metal concentrations meet FAO standards, ongoing monitoring is vital to preserve the ecosystem and safeguard human health. Mitigating anthropogenic activities and protecting vulnerable species are imperative for environmental integrity and community well-being.
Keywords: Heavy metals, Toxicity, Sustainability, Aquatic ecosystem
INTRODUCTION
A lake is often thought of as a region of varying size that is bordered by land and contains a significant amount of water. Humans use lakes for a variety of activities, that include fishing, irrigation, recreation, industrial water supply, transportation, as well as and storage of wastewater effluents. Additionally, they provide habitats and dwellings for the aquatic diversity, which depends on one another to survive, which is referred to as a food web. The inhabitants of lakes’ surrounding areas value them.
With the rapid growth of population, the problem of heavy metal contamination in estuarine waters is increasing in sensitivity and seriousness. The problem of heavy metal pollution as a result of urbanization and industrialization has become a serious environmental problem. Aquatic ecosystem is not the only affected by heavy metals, human health is also seriously threatened (Aziz et al., 2023; Tang et al., 2023; Hong et al. 2020). There are natural and anthropogenic sources of heavy metals discharge into the aquatic ecosystem. The natural include soil erosion, weathering, water loss, and underwater volcanic eruption while the anthropogenic sources include pesticides losses, mining and industrial wastewater as well as the combustion emissions from fossil fuels. When the concentration and toxicity levels of heavy metals exceed the tolerance of aquatic organisms, they will produce serious toxic effects on their related indicators and even their life activities. Singh et al. (2023) and Petrea et al. (2020) noted that toxic heavy metals have effects on the health and survival of aquatic ecosystem by virtue of their high toxicity, bioaccumulation and persistence. Heavy metals, unlike organic pollutants, are not biodegradable and tend to accumulate in living organisms when they are released into the environment, which can threaten the health of all forms of life (plants, animals, and humans).
Cobalt (Co), lead (Pb), mercury (Hg), arsenic (As), thallium (Tl), nickel (Ni), manganese (Mn), zinc (Zn), cadmium (Cd), and chromium (Cr) are a few of the more than ten (10) heavy metals that have a special significance in ecotoxicology due to their high persistence. Pb, Ni, and Cd are toxic even in trace concentrations, while metal levels of Mn, Zn, and Cr are hazardous above a certain threshold. When these heavy metal levels exceed the advised limit for each element in drinking water which varies, toxicity is manifested. According to the WHO 2008 report, the recommended upper limits for these contaminants are 2.0 mg/kg for Pb and Ni in fish and 0.01 mg/l, 0.07 mg/l, 3.0 mg/l, 0.003 mg/l, and 0.05 mg/l for drinking water, respectively. High amounts of exposure to these heavy metals have a number of negative effects, including serious damage to the brain and kidneys, the inability to conceive in pregnant women, harm to the male reproductive system, and even the possibility of death.
According to Oguzie and Izevbigie (2009), fish was regarded as a significant variable to water systems for the evaluation of level of pollution in metal. As part of their normal metabolism, heavy metals are taken up from water, food, or sediment by aquatic life (Anim et al., 2010), and their accumulations in aquatic habitats are monitored by evaluating the concentration of sediments, water, and plants. To learn more about how these metals are transferred to fish from aquatic ecosystems, researchers have examined the transfer factor of metals found in fish organs such as the gills, liver, muscles, and scales in relation to water and sediments (Authman and Abbas, 2007). According to Oztürk et al. (2009), sediments play an important part in the recovery of contaminants in aquatic systems under favorable conditions. They are key sinks for a variety of pollutants, including pesticides and metals.
Many residents in the FCT depend on the Jabi Lake, a freshwater lake that is closed off to the public. It is where commercial fishing comes from. The nearby settlements use it to supply drinking water as well as for recreational purposes. Human activities including recreation, irrigation, fishing, industrialization, and the discharge of residential sewage have an impact on it. These could cause the lake to absorb different types of contaminants loaded with heavy metals via diverse mechanisms. The growth of fish may be harmed by some heavy metals, and some of them may also be dangerous for consumers. Fish accumulation levels are utilized as a bio-indicator when heavy metals are used to pollute lake water. Heavy metal loads, in particular, enter the lake by a variety of mechanisms, and their accumulations might change depending on the local season.
The study is done on Clarias gariepinus fish species, widely believed to be the most popular fish eaten by the locals and are extensively distributed in the lake.Given the significance of C. gariepinus in the diets of Nigerians generally and of Abuja residents specifically, it is important to employ this particular fish species as a bioindicator of pollution in the aquatic environment due to the likelihood that many people in the city consume fish from Jabi Lake. In addition, studies on the freshwater fish Clarias gariepinus from rivers have shown the accumulation of toxic substances and risk assessment (Bawuro et al., 2018; Ekere et al., 2018; Madu et al., 2017).The concentration of heavy metals in fish (C. gariepinus) living in open lakes in cities, however, is poorly understood. Lakes are vulnerable to contamination due to the rising activity surrounding lakes in cities, including automotive traffic, recreation, commercial and construction operations, shopping centers, and bakeries.
Jabi Lake is a significant body of water in north central Nigeria that provides essential resources like freshwater food for local use and drinking water. Nigeria’s economy is becoming more diverse, with a particular emphasis on agro-based products. The Jabi Lake is used extensively by residents for fishing and business purposes. Since the markets may have been overrun by Jabi Lake’s captured fish, it is crucial to investigate the health hazards associated with them.
However, due to the lack of a water treatment system and the urbanization of Abuja, Untreated effluents, solid waste, agricultural wastes, asphalt, and fuel residue from road traffic and boat cargoes are also potential contaminants of the Lake. As a result, it is important to evaluate how pollution has affected the lake’s wildlife.Because of the natural accumulation of metals in the edible fish from the Jabi Lake, humans are at danger of developing toxic shock. In order to determine whether the level of heavy metalsin Jabi Lake were within the standards set by the WHO.
MATERIALS AND METHODS
The Federal Capital Territory (FCT), also known as Abuja, was established by law in 1976 with the goal of creating a superior capital Metropolis to Lagos (Federal Capital Development Authority, 1978, 1979). The Federal Capital Territory’s (FCT) Kado and Jabi Districts contain Jabi Lake, a man-made body of water that collects water from the foot of the Katampe rocks (Umar and Ebong, 2013). It is situated between Longitudes 6o49’34.30″ and 6o49’33.45″ East, and Latitudes 9o23’34.30″ and 9o23’33.45″ North. The lake’s approximate total surface size is 1,300 hectares (3,200 acres) (Ekwe et al., 2019). The reservoir’s initial design allowed it to supply water to 100,000 people. The reservoir, however, changed into a fishing and tourist destination after the larger Lower Usuma Dam was built. A recreational park and shopping center are located at the lake’s edge, and fishing is typically done there all year round.
The site for this investigation was chosen because of the contaminants from anthropogenic activities and leisure activities near the lake. Additionally, C. gariepinus is the most frequently encountered and traded fish species in the Lake.Since the late 1980s, land use in the Lake’s vicinity has steadily increased. Jabi Lake Park, a region surrounding the lake, was given that name in 2007 and a resort is planned for it (Onuegbu et al., 2012). The Park hosts social gatherings, and the lake offers recreational opportunities including boat excursions. (Susan, 2012). Also, residents around the lake are dependents on the lake for their livelihood. It is not uncommon to see boatmen paddling on the vast expanse of the Jabi Lake. Some of these men are residents of a place called Fishermen Village, close to the lake and they have been making a living from the fish they catch on this lake for years.
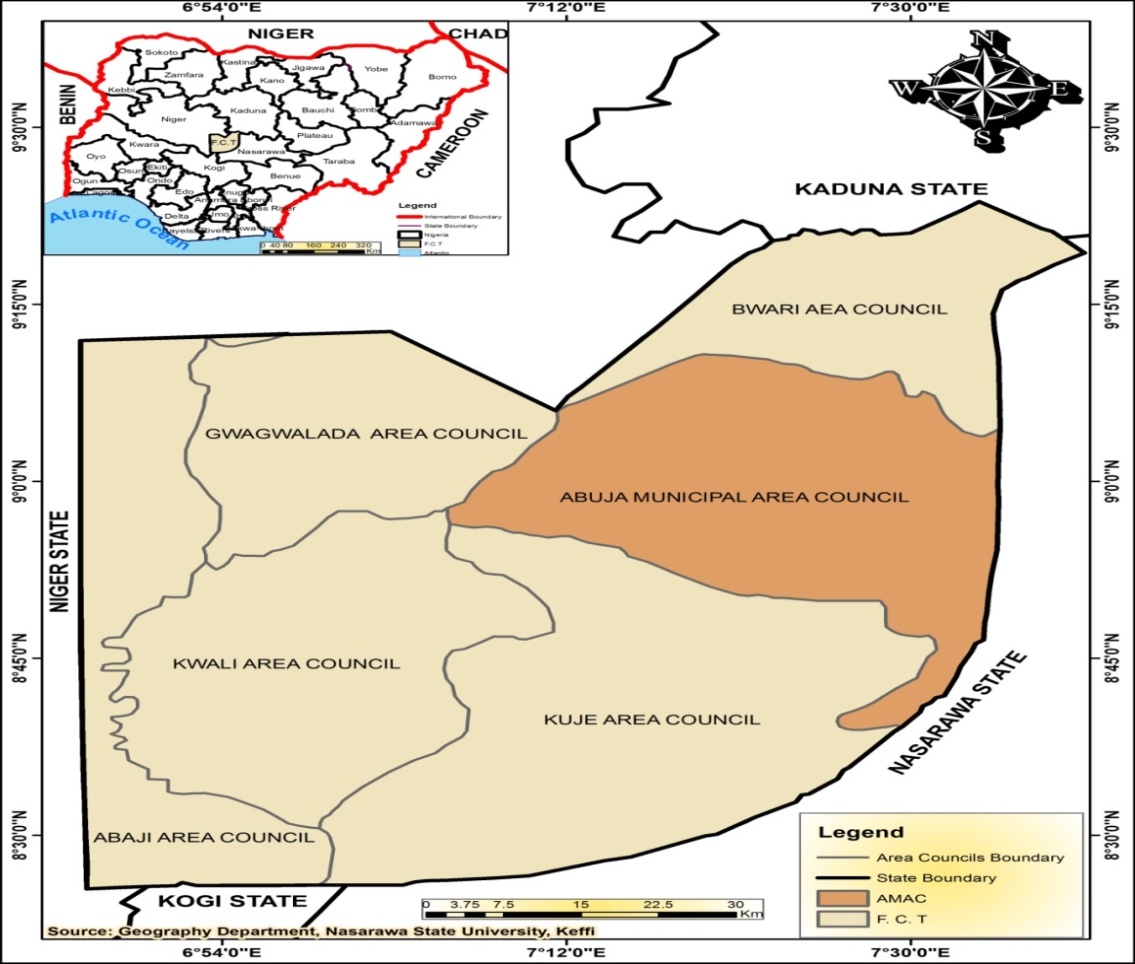
Fig.1: FCT showing AMAC.
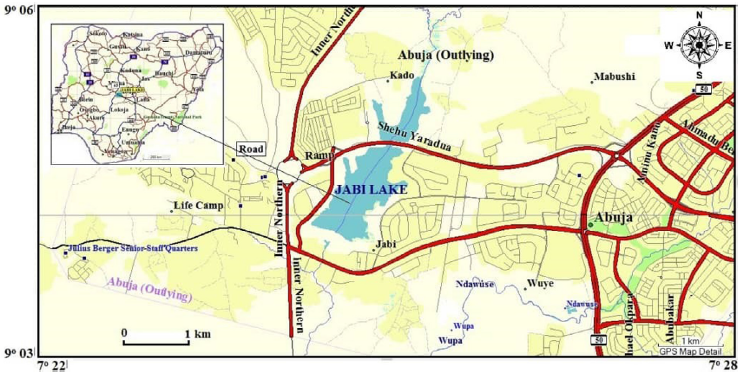
Fig. 2: The Study Area Showing Jabi Lake
The study area experiences regular rainfall during the rainy season, which runs from April to October each year. This is due to the territory’s location on the windward side of the Jos Plateau and the zone of rising air masses. The study area is located in the West African sub-region’s Guinean forest-savanna mosaic zone. However, there are some areas of rain forest in the Gwagwa plains, particularly in the harsh terrain to the southeast of the region, where gullies and rough terrain are present. Among the few remaining examples of mature forest vegetation in Nigeria is found in these parts of the study area. While the territory’s soils are often light and sandy, particularly on the largest plains like the Kugurara, Roboes, and Rubochi plains. The soils are very easily eroded because of the high sand content, in particular. The existence of stony lower horizons can be seen in the shallow depths. However, those in the well-known Gwagwa plains are deep and clayey, possibly due to the influence of parent rocks such gabbro and biotite granite with fine to medium grained textures. As a result, the Gwagwa plains’ rich soils are the most fertile and fruitful. Additionally, because they are essentially from completely exposed interfluve peaks, they are perfect for urban development.
The study relies essentially on primary data to achieve the research objectives. The experimental research design was employed in this study aimed at providing insights into the underlying factors that contribute or otherwise to the aquatic toxicity and fauna sustainability in Jabi Lake, Abuja. It also focuses on analyzing metal concentrations, assessing relationships to draw conclusions. A pre-investigation of the study area was conducted to obtain first-hand information and identify the location and extent of the sampling areas. The survey elicits information that determines the appropriate sampling techniques for the study. From three specifically chosen Jabi Lake locations in July, 2023, water and fish samples were taken. Using a 1L polyethylene sampling container during the sampling period, three replicate surface water samples were obtained from the same station but three separate locations. Using a 4oC ice box, bottles of samples were transported to the lab. Next, a composite of the three duplicated samples from every site was made for use in all laboratory analytical procedures. Gariepinus Clarias Fishermen assisted in catching and the gathering fish at each sampling location. Only the edible tissue (fillet) was immediately removed from the samples when they were collected, wrapped in plastic bags, and transferred to the lab in an ice-cooled box where they were stored at -20oC.
ANALYSIS OF HEAVY METALS
Fish and water samples were tested for Cu, Pb, Mn, Fe, and Zn concentrations. Both flame and furnace atomic absorption spectrometry were used to analyze the metals present in water and fish samples. For the measurements, the ASC-990 autosampler for GFAAS, the ASC-900 autosampler for flame, and the PG-990 Atomic Absorption Spectrophotometer were used. Tables 3.1 and 3.2 list the working conditions for Cu, Pb, Mn, Fe, and Zn analysis by FAAS and/or GFAAS. The equipment was calibrated using a variety of standard solutions. The samples were aspirated into the AAS apparatus using the usual procedure following calibration (APHP, 1998). Duplicate analyses of the samples were performed, and identical analyses of the blank results were also performed. Fish and water samples were examined for Pb using GFAAS and Zn and Mn using FAAS, respectively. FAAS was used to analyze the samples of fish for Cu and the water samples for Fe. GFAAS examined fish samples for Fe and water samples for Cu. To remove matrix interferences, modifiers (Mg (NO3)2 and NH4 H2PO4) were utilized for GFAAS.
Table 1 Instrumental conditions for the flame analysis on the PG-990 AAS
| Element | Cu, Fe | Pb, Zn, | Mn |
| Wavelength(nm) | 324.7 | 232.0 | 213.9 |
| Slit width (nm) | 0.4 | 0.2 | 0.4 |
| Lamp | HCL | HCL | HCL |
| Lamp current (mA) | 5.0 | 5.0 | 5.0 |
| Detection limit (mg/L) | 0.004 | 0.008 | 0.003 |
| Gas | Acetylene | Acetylene | Acetylene |
Table 2 Instrumental conditions for the furnace analysis on the PG-990 AAS
| Element | Cu, Fe | Pb, Zn, | Mn |
| Wavelength (nm) | 324.7 | 283.3 | 232.0 |
| Slit width (nm) | 0.4 | 0.4 | 0.2 |
| Lamp | HCL | HCL | HCL |
| Lamp current(mA) | 3.0 | 3.0 | 4.0 |
| Detection limit (pg/mL) | 3.43 | 3.88 | 8.57 |
| Inert gas | Argon | Argon | Argon |
Using a statistical package (SPSS 2023), the data were statistically analyzed to determine if there was a significant variation (p-value ≤0.05) in the amounts of the chosen heavy metals between the water and fish samples. The data were analyzed using the Paired Sample t-test.
RESULTS AND DISCUSSION
Mean Levels of Heavy Metal (Cu, Pb, Mn, Fe and Zn) Concentrations in Edible Muscles of Clarias gariepinus (Cat Fish) in Jabi Lake.
The mean levels of heavy metals in samples of Clarias gariepinus (Cat Fish) from the Jabi Lake was assessed. This is presented in Fig. 3 – 8. Fig 3 shows that Cu had mean concentration of 0.22±0.01, 0.22±0.01 and 0.23±0.01mg/kg at sampling stations 1, 2 and 3 respectively. These values were within the threshold of the FAO (30.0 mg/kg). However, a fish population that has accumulated copper over time may pose dangerous risks. High consumption of copper damages the liver and kidneys, it can cause headaches, nausea, dizziness, and diarrhea; yet it is unknown if cancer can be caused by Cu. This result concurs with that of Ekere et al. (2018), who found that the copper concentration of edible C. gariepinus fish caught in the confluence of the Rivers Benue and Niger in Nigeria ranged from 0.36 to 1.01 mg/kg and was below the FAO’s criteria of 30.0 mg/kg.
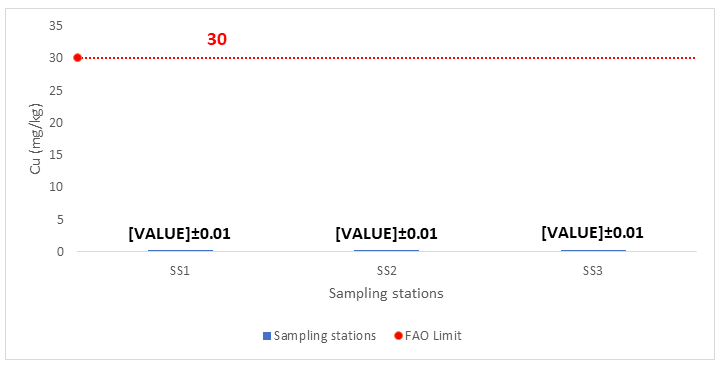
Fig3: Concentrations of Copper in C. Gariepinus
In the same vein, Fig 4 shows that the mean concentration of Zn in C. gariepinusons samples from the three sampling stations were2.12±0.01, 2.14±0.03 and 2.24±0.09 mg/kg respectively. These findings indicated that, the fish does not offer a direct threat to the people eating the fish found in the locality, since they were substantially below the 100 mg/kg recommended level for Zn in fish, and fish products. However, the amounts at the sampling points varied widely, with sample 3 location registering the highest value at 2.24±0.09 mg/kg. According to FAO/WHO (2011), the high concentration at sampling station 3 may have been caused by industrial and/or domestic wastewater. There have been reports of Zn concentrations in fish and fish products that are lower than those found in the current study and the recommended limit of 75 mg/kg (Oguzie and Izevbigie, 2009).
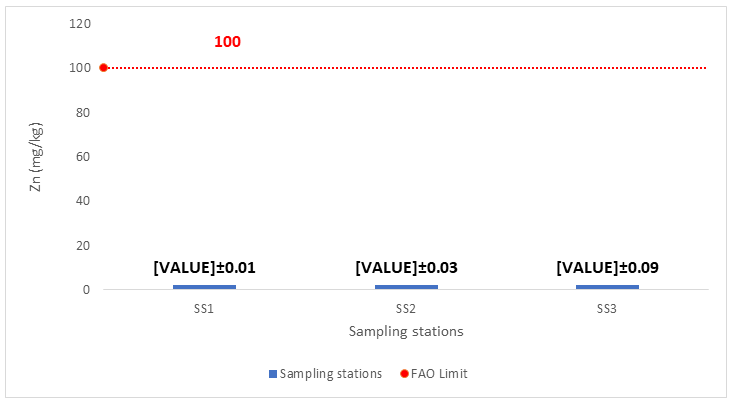
Figure 4: Concentrations of Zinc in C. gariepinus
Similarly, Fig 5 shows that Pb had mean concentration of 0.01±0.005, 0.01±0.01 and 0.02±0.005 mg/kg in samples of C. gariepinus from sampling stations 1, 2 and 3 respectively. The outcome indicated that, the Pb concentration in fish and fish products were below the 0.5 mg/kg recommended limit, suggesting that they pose no immediate concern to people eating the fish found in the locality. Other publications indicated that lead levels in C. gariepinus taken from the River Niger ranged between 2.61 to 5.07 mg/kg (Madu et al., 2017), which do not support the results of the present study. Sampling station 3 located downstream of the lake showed significant quantities (0.02–0.005 mg/kg) that could be ascribed to agricultural, industrial, and residential waste water. Since very low amounts of Pb are known to be harmful, Pb poisoning from fish in these stations is still a concern (Obasohan and Oronsaye, 2004). Long-term Pb exposure may also cause cancer and slowly advancing physical, muscular, and neurological degenerative processes.
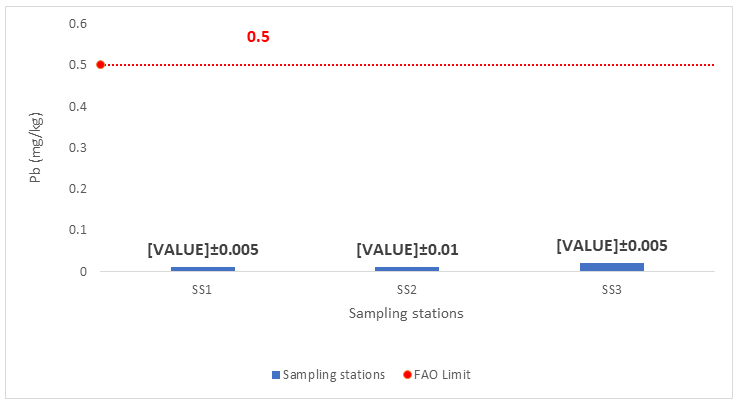
Fig. 5: Concentrations of Lead in C. gariepinus
Fig.6 demonstrates that samples of C. gariepinus from sampling stations 1, 2, and 3 exhibited mean concentrations of Mn of 0.34±0.02, 0.38±0.03 and 0.5±0.03 mg/kg, respectively. These results indicated that, the fish is safe for consumption by people around the locality as the values were below the 1.0 mg/kg recommended limit for Mn in fish and fish products. Sampling station 3 reported a greater value than the other stations, which could possibly be credited to the agricultural, industrial, and residential effluent. Fish gills from the River Nile have been shown to contain higher concentrations of Mn than in the current study and also higher above the recommended limit (Alaa and Osman, 2010). Manganese has been found to cause a variety of psychiatric and motor disturbances, known as Manganism, which has affected those working in the production and processing of manganese alloys.
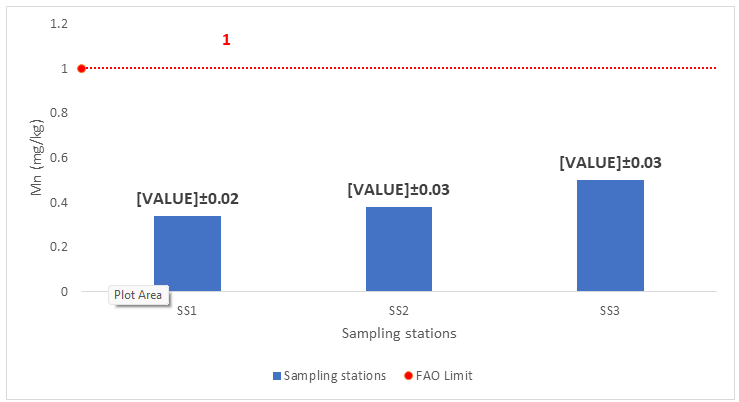
Fig.6: Concentrations of Manganese in C. gariepinus
Fig.7 shows that Fe had mean concentrations of 4.24±0.06, 4.85±0.25 and 5.78±0.51 mg/kg in samples of C. gariepinus from sampling stations 1, 2 and 3 respectively. The results indicated that the fish do not have any immediate threat for those consuming the fish found in this area because they were much below the recommended limit of 100.0 mg/kg for Fe in fish and fish products. Iron plays an important role in diet, it helps the red blood cells transport oxygen to all parts of the body (Abbasapour et al., 2014). Iron is crucial to diet since it aids in the red blood cells’ ability to carry oxygen to every region of the body. However, a higher iron concentration may boost hemoglobin levels in the blood while simultaneously raising the possibility of diabetes and liver cancer (Torti, 2013). Freshwater taken from the Lower Niger River in Nigeria has been shown to contain iron (Fe) (Madu et al., 2017). The previous study’s iron content level ranged from 37.44 to 84.68 mg/kg. This finding was however not in consonance with the findings of this study.
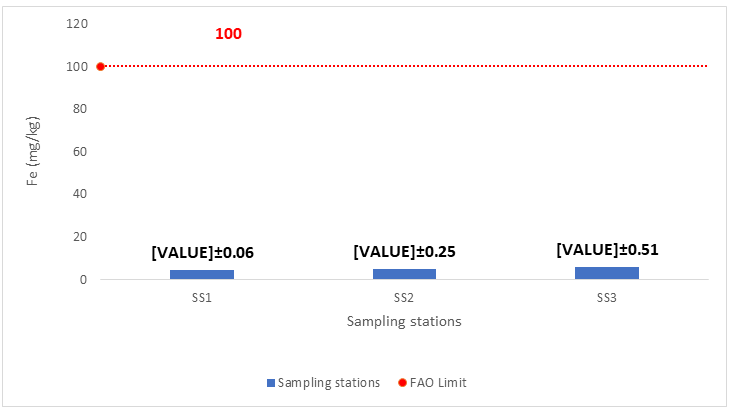
Fig.7: Concentrations of Iron in C. gariepinus
Mean Levels of Heavy Metals (Cu, Pb, Mn, Fe and Zn) Concentrations in Water Samples from the Jabi Lake
Three separate sampling stations, specifically upstream, midstream, and downstream were used to collect the water samples from the Jabi Lake. The mean levels of Cu, Pb, Mn, Fe and Zn in the water obtained are presented in Fig.8 – 12. Fig.8 shows that the copper element in the water samples has mean values of 0.34±0.02, 0.33±0.02 and 0.52±0.01 mg/l for upstream, midstream and downstream samples. The findings revealed that, concentration of copper element in the sampled water was below the WHO permissible limit of 1.5 mg/l. This finding is in consonance to the observation of Ishayaet al. (2018). In their work, they found copper concentration in stream water in Azara-Awe to be within the permissible limit of FME. Copper is a vital element for all living things, including humans, and it is required for optimal health in our diet in small amounts. However, excessive copper in water can have negative health effects such as nausea, vomiting, diarrhea, and stomach cramps. According to Ishaya et al. (2016), childhood Cirrhosis is associated with excessive copper concentrations which can get into children through contaminated water.
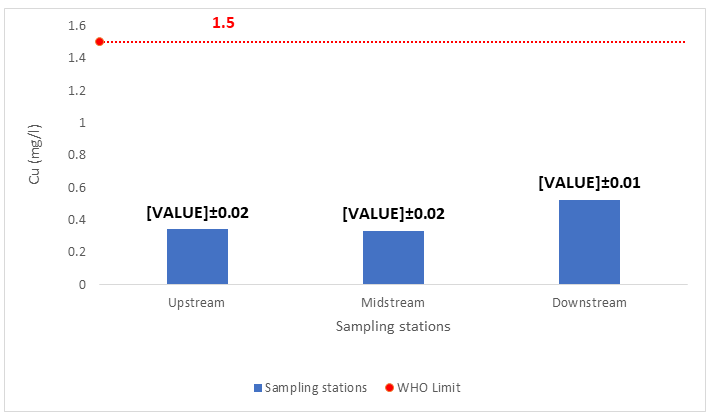
Fig.8: Copper content of the sampled water
Fig.9 reveals that Zn element in water samples has mean values of 2.91±0.045, 3.15±0.13 and 3.2±0.19 mg/l for upstream, midstream and downstream samples. All of the sampling locations found that the average Zn concentrations were below the 5.0 mg/l recommended limit by WHO for Zn in drinking water, indicating that, the water was safe for human consumption with regard to Zn. However, there were noticeable discrepancies in the Zn levels between the sampling stations, with downstream (3.2±0.19 mg/l) recording noticeably high levels and upstream (2.91±0.045mg/l) recording the lowest values. The high concentration in the downstream samples could be the result of untreated urban, industrial and residential effluent (Kithiia, 2006).Agatha (2010) noted that the water contaminated with Zn might be dangerous to other aquatic life and to humans. She advised continuous monitoring of contamination levels to determine the effect of the heavy metal in the aquatic system.
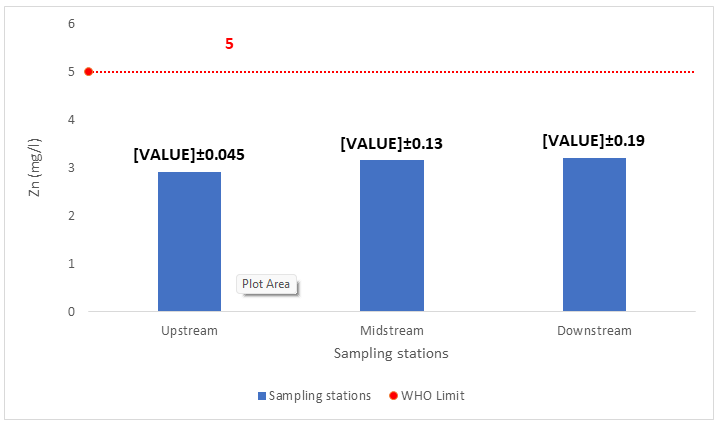
Fig.9: Zinc content of the sampled water
Fig.10 shows that lead element in water samples has mean values of 0.01±0.005, 0.01±0.005 and 0.02±0.005 mg/l. Results from all of the sampling locations indicated that Pb mean concentrations were below the recommended level of 0.05 mg/l for Pb in drinking water, suggesting that the water was Pb-free and suitable for human consumption (WHO, 2008). Significant difference was evident from all the sampling stations, with the downstream sample recording the highest Pb mean value of 0.02±0.005 mg/l which was attributed to untreated industrial effluent. Chronic exposure to Pb has been associated to child development retardation (WHO, 2008), indicating that Pb is harmful even at low levels with negative health effects.
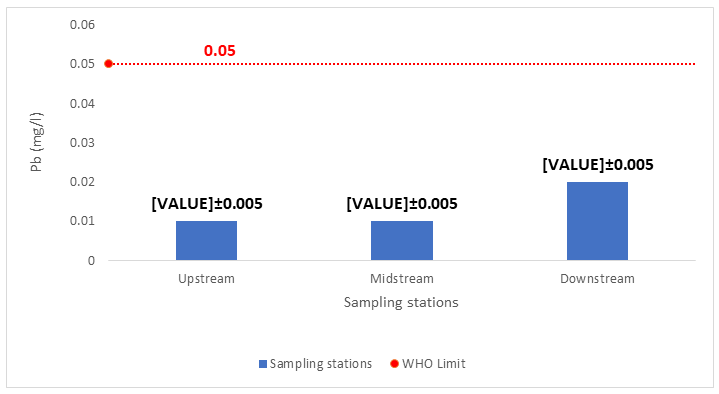
Fig.10:Lead content of the sampled water
Manganese (Mn) is widely distributed as one of the most abundant elements in the earth’s crust particularly found in soil, groundwater and in some cases, surface water (Zhanget al., 2014). Mn is an essential trace element with many biological functions but toxic at higher doses. The concentration of manganese element in the sampled water are presented in Fig.11. It shows that Mn element in water samples have mean values of 0.71±0.01, 0.71±0.01 and 0.9±0.02 mg/l.The result depicts an increase in the element of manganese above the WHO standard of 0.05mg/l in the respective samples, of the lake water. Manganese produces extremely objectionable stains even at low concentration, and thus limit the use of water for cleaning and laundry. High levels of manganese exposure have been linked to nervous system damage, leading to a disease that resembles Parkinsonism. Other forms of toxicity, such as cancer or harm to the reproductive system, are not likely to be caused by manganese. According to Zhang et al. (2014), young children seem to absorb more manganese compared to older age groups while excreting less of it. This highlights how crucial it is for kids and pregnant women to have access to clean drinking water.
The significant natural sources of the elevated levels may have resulted from various treated and untreated liquid wastes being released into the water body, as well as dissolving’s from surrounding rocks and soils that are exposed to surface water (Alaa and Osman, 2010). Other rivers were found to have similar concentrations of manganese amounts as those reported by this current analysis. According to Alaa and Osman (2010), Nairobi River had mean concentrations of 2.5 mg/l and the River Nile had concentrations ranging from 0.033 to 0.14 mg/l. The discharge of various treated and untreated liquid wastes to the water body, industrial wastes, and air inflow of dust were all responsible for these. Inputs from rocks and soils directly exposed to surface water were additionally identified.
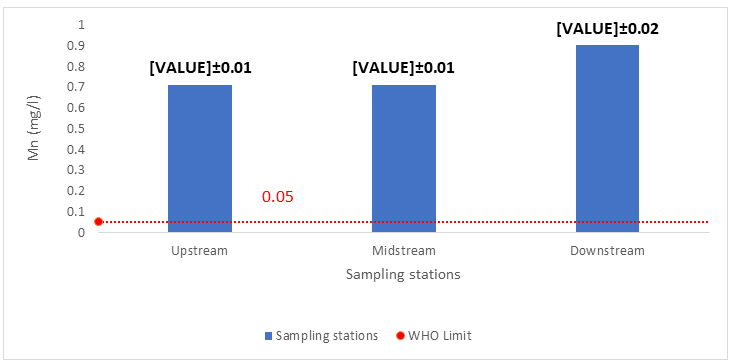
Fig.11: Manganese content of the sampled water
Fig. 12 shows that element of iron in the water samples has mean concentrations of 5.21±0.01, 5.91±0.02 and 5.97±0.02mg/l. The concentration of iron minerals in the sampled water is well above the WHO limit (0.3mg/l). However, Nriagum (2008) asserted that the concentration of iron above 1.0mg/l could cause ill health such as gastro intestinal irritation. Thus, direct consumption of water containing high iron contents is unhealthy due to toxic action of iron compounds. Similar result was recorded in the work of Abuiet al. (2017) using River Kaduna as a case study, they observed that the concentration of iron metals ranged from 1.676mg/l to 5.45mg/l.
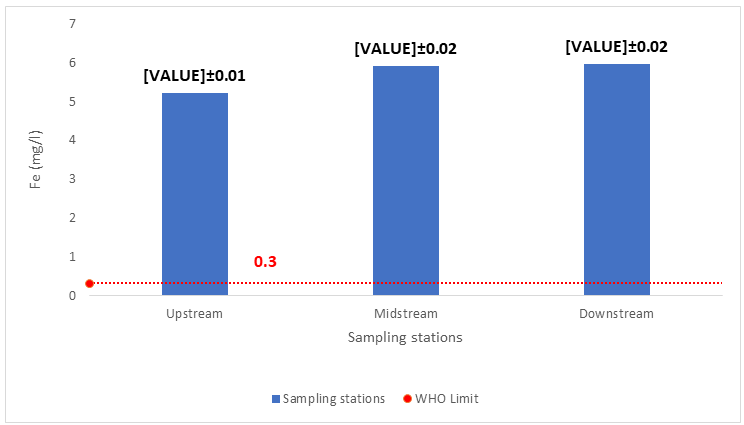
Figure 12: Iron content of the sampled water
Test of significance
The mean concentration of the heavy metals (Cu, Zn, Mn, Pb and Fe) in fish and water samples were subjected to the student t-test for significant differences. This was in relation to the study hypotheses which state as follows;
Ho: there is no significant difference in the concentrations of the metals (Cu, Zn, Mn, Pb and Fe) in fish and water from the lake.
The analysis was subjected to 0.05% level of confidence. Accordingly, P = ≤.05 signifies statistical significance. The result of the analysis is presented in Table 4.1 respectively.
Table 3: Student’s t-test on heavy metals in Fish and Water from the lake
| Fish | Water | t-stat | t Critical Value | Remark | |
| Cu | 0.22±0.005 | 0.39±0.11 | 2.96779675 | 0.0972 | NS |
| Zn | 2.16±0.06 | 3.08±0.15 | 13.81728241 | 0.0051 | S |
| Pb | 0.013±0.005 | 0.013±0.005 | 0.241665 | 0.003 | S |
| Mn | 0.406±0.083 | 0.773±0.109 | 18.08388860 | 0.0030 | S |
| Fe | 4.956±0.775 | 5.696±0.422 | 2.67897987 | 0.1156 | NS |
NS= Not Significant (t-stat> P value)
S= Significant (t-stat<t critical-value)
Table 3 shows that at P(2) = 0.09725487 and P(2)= 0.11565715 there was no significant difference in the concentration of Copper and Iron in the fish and water samples from the lake. In the same vein, the table shows that at P (2) = 0.00519707; P(2) = 0.003 and P(2)= 0.003 there were significant differences in the concentrations of Zinc, Lead and Manganese in the fish and water samples from the lake respectively. The finding might not be unconnected with the ability of fish to bioaccumulate a lot of these metals from the aquatic environment into their bodily tissues. Researchers such as Oguzie and Izevbigie (2009) and Wangboje and Oransaye (2010) have documented the bioaccumulation of metals by fish. Different amounts of Cu, Mn, and Pb were bioaccumulated. This is so that fish, like other aquatic organisms, can concentrate heavy metals to concentration levels in their tissues that are several orders of magnitude higher than those in water.
DISCUSSION OF FINDINGS
The study investigated the relationship between aquatic toxicity and the sustainability of the aquatic ecosystems in Jabi Lake of the FCT. The concentration of Cu, Pb, Mn, Fe and Zn in edible muscles of Clarias gariepinuswas determined, the concentration of same heavy metals above in water samples collected from 3 points along Jabi lake (up-stream, mid-stream and downstream) was also determined, a comparison was made between the level of metal concentration in both water samples and samples of Clarias gariepinus from Jabi lake with FAO standard vis-à-vis depicting implication to sustainability. Findings from the study revealed that there were concentrations of heavy metals in the edible tissues of the fishes; Copper had mean concentrations of 0.22±0.01, 0.22±0.01 and 0.23±0.01mg/kg at sampling stations 1, 2 and 3. Although these values were within the threshold of the FAO (30.0 mg/kg). Nevertheless, persistent copper buildup in fish may result in potential hazards. Similarly, concentrations of Zinc were also recorded in C. Gariepinus with mean concentration of 2.12±0.01, 2.14±0.03 and 2.24±0.09mg/kg. Also, these values were far below the permissible threshold of the FAO (100 mg/kg) for Zinc. This suggests that the fish in this location do not immediately present a risk to those who eat them.
In the same vein, finding shows that concentration of lead was also recorded in the fish samples with mean values of 0.01±0.005, 0.01±0.01 and 0.02±0.005 mg/kg. The values obtained fell under the acceptable Pb limit in fish and fish products of 0.5 mg/kg. Industrial and/or residential wastewater may be responsible for the high concentration in sampling station 3. Additionally, the results demonstrate that samples of C. gariepinus exhibited mean manganese concentrations of 0.34±0.02, 0.38±0.03, and 0.5±0.03 mg/kg. These outcomes fell under the FAO-recommended limit for Mn in fish and fish products (1.0 mg/kg). Findings further shows that, Iron had mean concentration of 4.24±0.06, 4.85±0.25 and 5.78±0.51 mg/kg. These results fell significantly lower than the acceptable limit for Fe in fish and fish products, which is 100.0 mg/kg.
In addition, the study shows that there was presence of heavy metal concentrations in the samples of water collected from the Jabi Lake. Findings shows that copper element in the water had mean values of 0.34±0.02, 0.33±0.02 and 0.52±0.01 mg/l. these values were all within the permissible limit of 1.5 mg/l set by the WHO. Similarly, finding shows that Zinc in the water had mean concentration of 2.91±0.045, 3.15±0.13 and 3.2±0.19 mg/l. These values were also within the threshold of 5.0 mg/l set by the WHO. In the same vein, the lead concentration in the water sample had mean values of 0.01±0.005, 0.01±0.005 and 0.02±0.005 mg/l. The values obtained fell below the permitted range for Pb in drinking water, which is 0.05 mg/l. It was revealed also that Manganese in the water sample had mean values of 0.71±0.01, 0.71±0.01 and 0.9±0.02 mg/l. The result depicts an increase in the element of manganese above the WHO standard of 0.05mg/l in the respective samples. The study further revealed that Iron had mean values of 5.21±0.01, 5.91±0.02 and 5.97±0.02mg/l. Also, the concentration of iron minerals in the sampled water is well above the WHO limit (0.3mg/l).
From the student’s t-test result, it was revealed that at P (2) = 0.09725487 and P(2)= 0.11565715 there was no significant difference in the concentration of Copper and Iron in the fish and water samples from the lake, in the same vein the findings also shows that at P (2) = 0.00519707; P(2) = 0.003 and P(2)= 0.003 there was a significant difference in the concentration of Zinc, Lead and Manganese in the fish and water samples from the lake respectively. This finding might be as a result of the fish ability to bioaccumulate a significant amount of these metals from the aquatic environment into their body tissues.
CONCLUSION
The samples of Clarias gariepinus fish tissues obtained from the Jabi Lake were discovered to have all of the evaluated heavy metals (Cu, Zn, Pb, Mn and Fe) at different levels. Findings from the study revealed that all the heavy metals analyzed were all within the permissible limit set by FAO. Samples of water obtained from upstream, midstream and downstream of the lake were also discovered to contain all the analyzed heavy metals (Cu, Zn, Pb, Mn and Fe) at different levels. Findings from the study showed that concentrations of Copper, Zinc and Lead did not exceed the limit of the WHO, while concentrations of Manganese and Iron exceeded the limits of the WHO respectively. The student’s t-test statistics revealed that there was no significant difference in the concentrations of Copper and Iron in the fish and water samples from the lake. Additionally, the test revealed a substantial variation in the concentrations of zinc, lead, and manganese in the fish and water samples of the Lake and this could be as a result of the ability of fish to bioaccumulate much of these metals into their body tissues from the aquatic environment. This study therefore recommends that accumulations of heavy metals observed in catfish muscle of the study area were less than the FAO standard, to keep the fish safe for consumption and to preserve the aquatic ecology, the load of heavy metals input into the lake from the likely sources should be monitored frequently and control measures should be put in place.
REFERENCES
- Abbaspour, N., Hurrell, R. and Kelishadi, R. (2014). Review on iron and its importance for human health. J Res Med Sci., 164-74. PMID: 24778671; PMCID: PMC3999603.
- Abui, Y., Ezra, V., Bonet, R. and Amos, B.(2017).Assessment of Heavy Metals Level of River Kaduna at Kaduna Metropolis, Nigeria. J. Appl. Sci. Environ. Manage., 21 (2) 347 – 352.
- Agatha, A.N. (2010). Levels of Some Heavy Metals in Tissues of Bonga Fish, Ethmallosafimbriatafrom Forcados River. Journal of Applied Environmental and Biological Sciences,1, 44-47.
- Alaa, G.M., Osman, W.K. (2010). Water Quality and heavy metal monitoring in water, sediments, and tissues of the African catfish Clariasgariepinus (Burchell, 1822) from the River Nile, Egypt. Journal of Environmental Protection, 1:389-400.
- Anim, A.K., Ahialey, E.K., Duodu, G.O., Ackah, M. and Bentil, N.O. (2010). Accumulation profile of heavy metals in fish samples from Nsawam, along the Densu River, Ghana. Research Journal of Environmental and Earth Sciences,3:56-60.
- Authman, M. and Abbas, H. (2007). Accumulation and distribution of copper and zincin both water and some vital tissues of two fish species (tilapia zilii and Mugilcephalus) of Lake Qarun, Fayoum province, Egypt. Pakistan Journal of Biological Science, 10, 13.
- Aziz, K. H. H., Mustafa, F. S., Omer, K. M., Hama, S., Hamarawi, F. and Rahman, K. O. (2023). Heavy metal pollution in the aquatic environment: Efficient and low-cost removal approaches to eliminate their toxicity: A review. Royal Society of Chemistry, 13, 17595 – 17610. DOI: 10.1039/d3ra00723e.
- Bawuro, R. B., Voegborlo, A. and Adimado, A. (2018). Bioaccumulation of heavy metals in some tissues of fish in Lake Geriyo, Adamawa State, Nigeria. J. Environ. Public Health, 1854892. doi: 10.1155/2018/1854892
- Ekere, N.R., Yakubu, N.M., Ihedioha, J.N. (2018). Assessment of levels and potential health risk of heavy metals in water and selected fish species from the Benue-Niger River Confluence, Lokoja, Nigeria. J. Aquat. Food Prod. Technol. 772– 782. doi: 10.1080/104 98850.2018.14 99061
- Ekwe, M.C., Asma, T. I., Ifeoluwa, A.B., Oluwatola, I.A, David, O. Eand Jemimah, N. (2019). Assessment of Urban Cooling Island Effects of Jabi Lake Reservoir, Abuja on its Surrounding Microclimate using Geospatial Techniques. Global Journal of Science Frontier Research: A Physics and Space Science,19(2).
- FAO\WHO (2011). National Research Council Recommended Dietary 626 Allowances (10th ed). National Academy Press. Washington, DC. USA.
- Hong, Y., Liao, W., Yan, Z., Bai, Y., Feng, C., Xu, Z. and Xu, D. (2020). Progress in the research of the toxicity effect mechanisms of heavy metals on freshwater organisms and their water quality criteria in China. Journal of Chemistry, 20, 1 – 12. https://doi.org/10.1155/2020/9010348
- Ishaya, S., Alhassan, M.M. and Onarigu, I.A (2018). Effects of Barite Mining on Water Quality in Azara-Awe Local Government Area of Nasarawa State, Nigeria. Ghana Journal of Geography, 10(2), 36 – 47.
- Ishaya, S., Adakayi, P. E. and Areo, I.O. (2016). An assessment of River Usuma Water quality for Livestock Consumption in Gwagwalada Town, Federal Capital Territory, Nigeria. Abuja Journal of Geography and Development, 4(1), 38-50.
- Kithiia, S.M. (2006). The effects of land use types on hydrology and water quality of Upper Athi River basin, Kenya. University of Nairobi.
- Madu, J.C., Odo, G.E., Asogwa, C.N. and Nwani, C.D. (2017). Heavy metal concentrations in, and human health risk assessment of three commercially valuable fish species in the lower Niger River, Nigeria, Afr. J. Aquat. Sci. 42, 341–349, doi: 10.2989/16085914.2017.1410463.
- Nriagu, J. O. and Simmons, M. S. (2008). Food contamination from environmental sources. John Wiley and Sons.
- Obasohan, E. E and Oronsaye, J. A. O. (2004). Bioaccumulation of heavy metals by some cichlids from Ogba River, Benin City, Nigeria. Nig. Ann. Nat. Sci., 5 (2), 11-27.
- Oguzie, F.A. and Izevbigie, E.E. (2009). Heavy metals concentration in the organs of the silver Catfish, Chrysichthysnigrodigitatus (Lacèpéde) caught upstream of the Ikpoba river and the reservoir in Benin City. Bioscience Research Communications, 21, 189-197.
- Onuegbu, T. U., Ogbu, I. M., Ilochi, N.O., Obumselu, O. F. and Okafor, I. (2012). Preparation of environmentally friendly bio-coal briquette from ground nutshell and maize comb biomass waste: Comparative effects of Ignition time and water boiling studies. Current Research in Chemistry, 4(4), 110-118
- Öztürk, M., Özözen, G., Minareci, O. and Minareci, E. (2009) Determination of heavy metals in fish, water and sediments of avsar dam lake in turkey. .Iranian Journal of Environmental Health Science and Engineering, 6, 73-80.
- Petrea, S. M. et al. (2020). A machine learning approach in analyzing bioaccumulation of heavy metals in Turbot Tissues. Molecules, 25, 4696. https://doi.org/10.3390/molecules25204696
- Singh, V., Singh, N., Rai, S. N., Kumar, A., Singh, A. K., Singh, M. P., Sahoo, A., Shekhar, S., Vamanu, E. and Mishra, V. (2023). Heavy metal contamination in the aqutic ecosystem: Toxicity and its remediation using eco-friendly approaches. Toxics, 11, 147. https://doi.org/10.3390/toxics11020147
- Susan, E. Ajonye, I.E.B., Halilu, S., Ibrahim, A. and Salman, K. (2012). Remote sensing assessment of Jabi Lake and its environs: A developmental perspective. Archives of Agriculture and Environmental Science, 1(1), 1-8.
- Thang, Z., Liu, X., Niu, X., Yin, H., Liu, M., Zhang, D. and Guo, H. (2023). Ecological risk assessment of aquatic organisms induced by heavy metals in the estuarine waters of the Pearl River. Scientific Reports, 13, 9145. https://doi.org/10.1038/s41598-023-35798-x.
- Umar, M.A. and Ebong, M.C. (2013). Determination of Heavy Metals in Soil, Water, Sediment, Fish and Cray Fish of Jabi Lake in the Federal Capital Territory, Abuja, Nigeria. International Journal of Research in Pure and Applied Chemistry, 2(2), 25-31.
- Wangboje, O. M. and Oronsaye, J.A.O. (2010). Trace Metals in Some Benthic Fishes of the Ikpoba River Dam, Benin City, Nigeria. African Journal of Biotechnology, 9, 8860-8864.
- World Health Organization (WHO) (2008). Guidelines for Drinking-water Quality; 3rd Edition 1-459.
- Zhang, B., Xia, W., Li, Y., Bassig, B. A., Zhou, A., and Wang, Y.(2014). Prenatal exposure to lead in relation to risk of preterm low birth weight: a matched case–control study in China. Reprod Toxicol 57:190–195, PMID: 26122562. 10.1016/j.reprotox.2015.06.051.