
Levels of Polycyclic Aromatic Hydrocarbons in Ugborodo River and Fish at Escravos, Nigeria
- Igonikon A. C.
- Awolo S. N.
- Ideriah T. J. K
- Gobo A. E.
- Ayotamuno A
- 236-243
- Feb 7, 2025
- Environmental Science
Levels of Polycyclic Aromatic Hydrocarbons in Ugborodo River and Fish at Escravos, Nigeria
Igonikon A. C.1, Awolo S. N.2, Ideriah T. J. K3, Gobo A. E.1, Ayotamuno A1
1Institute of Geosciences and Environmental Management, Rivers State University, Port Harcourt
2Department of Chemistry, Rivers State University, Port Harcourt
3Institute of Pollution Studies, Rivers State University, Port Harcourt
DOI: https://doi.org/10.51584/IJRIAS.2025.1001019
Received: 31 December 2024; Accepted: 04 January 2025; Published: 07 February 2025
ABSTRACT
The levels of Polycyclic Aromatic Hydrocarbons in Produced Water and the receiving Ugborodo River at Escravos, Nigeria were assessed in this study using Gas Chromatography-Mass Spectrometer. The results showed total PAH levels ranged between 0.726 and 1.215 ppm across all sampling stations. The maximum PAH level in fish sample A was 0.00573 ppm and in fish sample S was 0.00042 ppm. The Total Polycyclic Aromatic Hydrocarbon (PAH) levels were above the WHO limit of 0.0002 mg/L. The PAH levels obtained in this study may pose serious environmental and health risks due to bioaccumulation of these PAH compounds. There was significant difference in the levels of PAHs between the stations as well as the fish types. Thus, adequate treatment of the surface water in the study areas is recommended as this could reduce the PAHs levels in aquatic lives.
Keywords; Polycyclic Aromatic Hydrocarbons, Fish, Ugborodo River, Escravos, Nigeria
INTRODUCTION
The oil and gas industry is a major sector of the world’s economy because it is the main source of global energy. The revenue generated through operations in oil and gas activities has sustained the economy of many nations which has resulted in considerable increase in oil and gas exploration, production, refining and marketing (International Energy Agency (IEA), 2016). Petroleum products have been serving as feedstock for production of several consumer goods. The benefits of oil and gas production are no doubt invaluable, but this is not without demerits, there is an ugly side of the story that has subjected host communities to the consequences of pollution and environmental degradation (Ogolo et al., 2022).
The industrialization of the sea is expanding worldwide. Increasing oil and gas exploration activities in the absence of sufficient baseline data in sea ecosystems has made environmental management challenging (Cordes et al., 2016). There are many different types of facilities from which offshore drilling operations take place. These include bottom founded drilling rigs (Jack- up barges and Swamp barges), combined drilling and production facilities either bottom founded or floating platforms, and deep water mobile offshore drilling units (MODU) including semi-submersibles and drill ships. These are capable of operating in water depths up to 3,000 metres (9,800 ft).
Consequently, the extraction of oil from tar sands and by hydraulic fracturing (fracking) – is considerably more water-intensive than conventional oil and gas. Steam is used to reduce the viscosity of tar sands, making extraction easier, while in fracking, water with chemical additives is injected into shale rock to open cracks and allow oil and gas to escape to the surface. A proportion of this injected water comes back out of the well as wastewater. An average of five to six barrels of water is used for every barrel of crude oil produced, but the quantity can be as high as 30 barrels. The quantity of injected water required for fracking ranges from eight million litres to 30 million litres per well, and the availability of water is a constraint on fracking in some countries (Scott and Pickard, 2020).
In addition, produced water which is natural water or formation water is always found together with petroleum in reservoirs. It is slightly acidic and sits below the hydrocarbons in porous reservoir media, (Reynolds, 2003). Extraction of oil and gas leads to a reduction in reservoir pressure, and additional water is usually injected into the reservoir water layer to maintain hydraulic pressure and enhance oil recovery. Produced water has a complex composition, but its constituents can be broadly classified into organic and inorganic compounds including dissolved and dispersed oils, grease, heavy metals, radionuclides, treating chemicals, formation solids, salts, dissolved gases, scale products, waxes, microorganisms and dissolved oxygen (Hayes and Arthur, 2004). Globally, around 250 million barrels of water are produced daily from both oil and gas fields, and more than 40% of this is discharged into the environment.
Consequently, oil and gas activities through their produced water effluents if not managed properly will have a detrimental effect on aquatic lives and human health as it concerns domestic uses and purposes. For instance, the marine ecosystems have divisional zones of the pelagic zone which includes the water and organisms that spend their lives floating or swimming in the water. The marine biome is divided into three distinct ecosystems: oceans, coral reefs and estuaries. The oceans, which include the Pacific, Atlantic, Indian, Southern and Arctic Oceans are interconnected and cover about 71% of the Earth’s surface. Coral reefs are located in warm, shallower waters, and are primarily made up of corals, which are a combination of algae and animal polyp, numerous fish, sea urchins, invertebrates, microorganisms and other living things inhabit coral reefs. Estuaries are those areas where freshwater streams or rivers meet the ocean. Estuaries support many types of species, including oysters, crabs, waterfowl, and macro-flora such as seaweed and marsh grasses (European Commission, 2014; Neal, 2019). The benthic zone includes the sea floor and the organisms that live there. Benthic zones include semi-dry areas such as intertidal zones, coastal marine ecosystems like coral reefs, and also deep ocean trenches. Benthic organisms receive nutrients from organic matter that falls from the pelagic zone. Benthic plants and plant-like organisms include sea grasses, seaweeds, and algae. Examples of benthic animals include crabs, corals, shellfish, and sea stars (Arvidson, 2019).
The marine environment, as a complex system is mainly influenced by various physical, chemical and biological processes. The open ocean is more stable compared to the near shore waters, where the interaction with the terrestrial zone is more effective in bringing about variations in different physico-chemical parameters. Hence a thorough knowledge of hydrography is indispensable to estimate the quality of the environment and its influence on biological fertility (Poonam and Rahul, 2012) especially as such human practices like oil and gas which can adversely impact and alter the physico-chemical properties of the water thereby affecting marine life. The quality of produced water as oil and gas industrial effluents therefore becomes useful in this regard because it stresses the importance of the marine environments as hotspots for the sustenance of life, food etc.
Conversely, produced water effluents released into the marine environment as a result of oil and gas activities have several implications on water quality overtime. For instance, there can be water breakthrough from injected water outside the reservoir area, and as oil and gas production continues, a time comes when formation water reaches production well, and production of water begins alongside the hydrocarbons. This water is known as Produced Water or Oilfield Brine, accounting for the largest volume of by-product generated during oil and gas recovery operations (Reynolds, 2003). It is a mixture of injected water, formation water, hydrocarbons and treating chemicals, generally classified as oilfield produced water, and natural gas produced water depending on the source.
More significantly, oilfields are responsible for more than 60% of daily waste water effluent generated worldwide, (Fakhru’l-Razi et al., 2009). The rate of oilfield produced water production is expected to increase as oilfield ages. Other factors have been reported to affect the quantity of produced water generated in an oilfield. Oil field operators are particularly interested in producing crude oil but must find a way to handle the “necessary evil” (produced water) that comes with it in order to ensure efficiency in their operations. Due to this reality facing oil field operators, so many research works have been done to find a way to handle produced water around the world to limit its impact on the marine environment.
Produced water is considered an industrial waste (United States Environmental Protection Agency (USEPA), 2015). Produced waters can vary significantly in composition and salinity, depending on the type of production operation, the geologic source of the water, and the treatment of the water once it is brought to the surface (Tibbetts et al., 1992). Since no two produced waters are alike, region-specific studies need to be conducted to address the potential environmental risks from disposal. The combination of dissolved and particulate inorganic metals, radioactive material and salinity pose unresolved questions regarding the fate and potential effects of the wastewater’s disposal on an ecosystem.
Large volumes of wastewater are generated in the oil and gas industry, and projections show that these volumes will only increase. Currently most of this wastewater is managed by disposing of it using a practice known as underground injection, where that water can no longer be accessed or used. The limits of injection are evident in some areas, and new approaches are becoming necessary. Some stakeholders are asking whether it makes sense to continue to waste this water, particularly in water scarce areas of the world where oil and gas is produced, and what steps would be necessary to treat and renew it for other purposes. The Niger Delta region is characterized with various oil and gas activities and majority of these industries generate produced water – produced water contains oil and suspended solids. Some produced water contains heavy metals and traces of naturally occurring radioactive material (NORM), which over time deposits radioactive scale in the piping at the well. Metals found in produced water include zinc, lead, manganese, iron, and barium. It is based on this background that the study shall evaluate the physico-chemical and heavy metals properties in produced water effluents and receiving Ugborodo River at Escravos, Niger Delta, Nigeria.
MATERIALS AND METHODS
The Study Area
Escravos is located in the Niger Delta region of Nigeria and this area belongs to the South-east, South-west and south-south region of Nigeria. It is located between latitudes 5º 00’N and 6º 30’N and longitudes 5º 20’E and 9º 00’E. It has a popular river called Niger River which is sitting directly on the Gulf of Guinea on the Atlantic Ocean in Nigeria (Figures 1 and 2). The Niger Delta region which is mostly located to the southern part of Nigeria makes it one of the world’s largest arcuate fan-shaped river deltas (Encyclopaedia Britanica, 2014). Escravos is located in Warri South Local Government Area of Delta State. This area belongs to the Niger Delta which is about 100 kilometres (62 mi) southeast of Lagos.
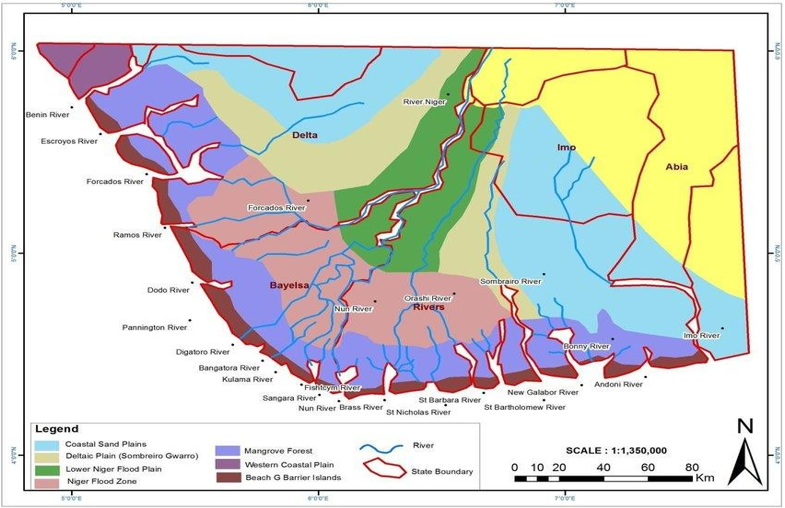
Figure 1: Escravos and Adjoining Ugborodo River (Park, 2004)
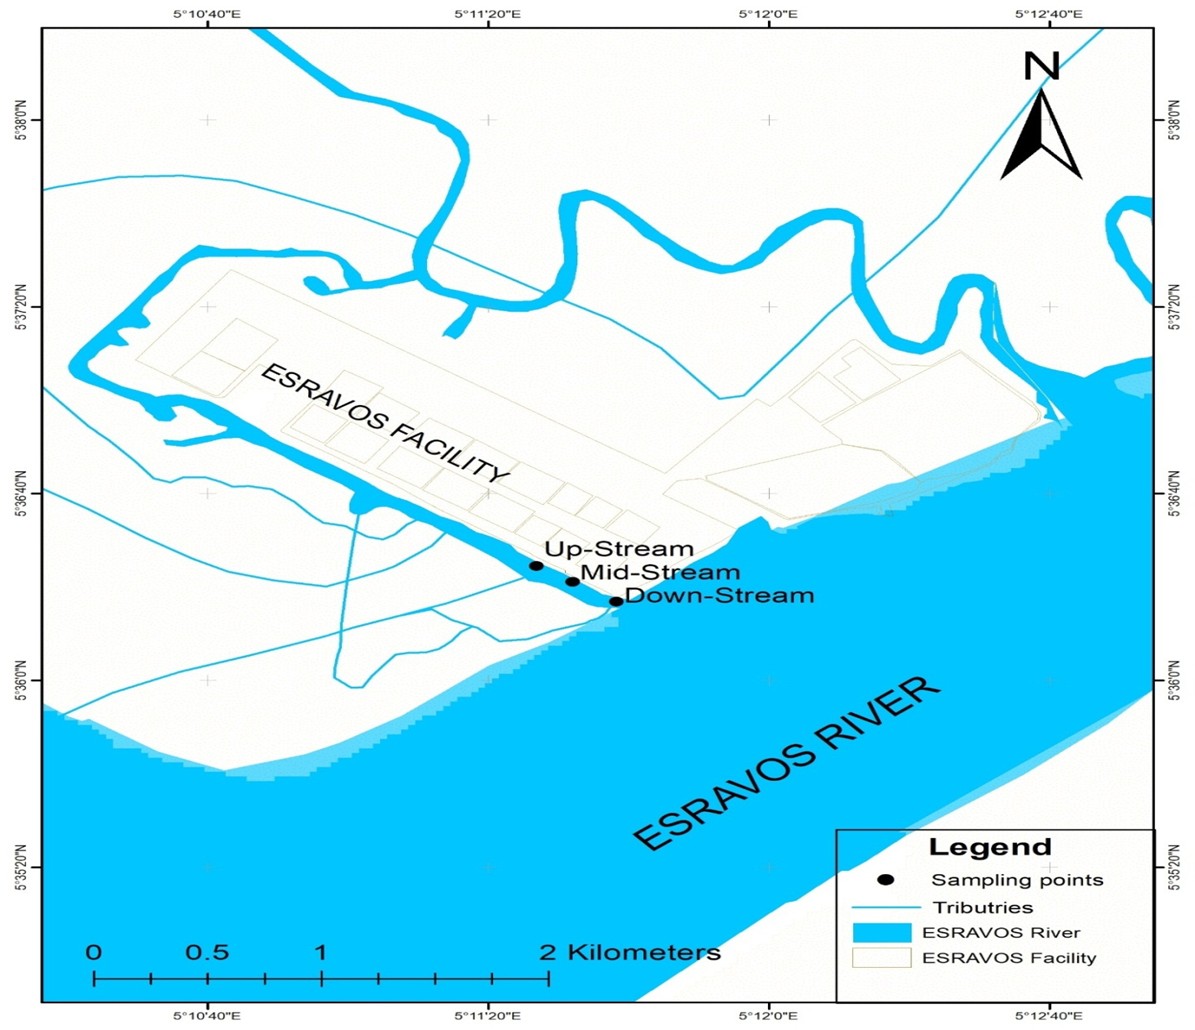
Figure 2: A Map Showing Ugborodo River and Sampling Points
The communities in Escravos include Ugborodu, Ogidigben, Jala, Madagho and Ajidubu. Escravos plays host to two major transnational oil companies Shell and Chevron. Shell has three flow stations (Sagara, Otumara and Ogidigbe flow stations), while Chevron has its flow station offshore (National Oil Spill Detection and Remediation Agency (NOSDRA), 2019).
Sample Collection and Analysis
Water samples were collected from produced water from the oil terminals at Escravos. Surface water samples were also collected from the Ugborodo River at different segments (upstream, mid-stream and downstream). The water samples were collected in triplicates in pre-rinsed 1 litre glass bottles The discharge points from the produced water from oil terminals were the source points where water samples were collected in triplicates for laboratory analysis. The water segments at the receiving Ugborodo River at upstream, mid-stream and downstream constituted points of sources where water samples were collected in triplicates and transferred to the laboratory for analysis using recommended standards.
Fish samples were caught using gill nets and the analysis carried out according to APHA (2005). The fishes were washed using deionized water and placed in separate polyethylene bags with ice cubes. The fish samples were kept frozen at -20°C until ready for analyses (Baharom and Ishak, 2015). Both water and fish samples were collected monthly for six months.
PAHs extracts were analyzed by using a 3800 Varian Gas Chromatography Coupled to a Varian Saturn 2200 Mass Spectrometer (GC-MS), equipped with a 30m x 0.25 mm i.d (inner diameter) WCOTCP-Sil 8 CB column. The GC – MS was operated under the following conditions: the initial column temperature was 70 °C. After an initial holding time of 1 min, the temperature was programmed to rise to 300 °C at a rate of 10 °C /min for 30mins.
The injector and detector temperatures were 25 °C and 300 °C respectively. Helium was used as the carrier gas at a flow rate of 2 ml/min. The method was according to the established procedure by the EPA method 8270D. PAHs concentrations were identified based on their retention time and confirmed by comparing their mass spectra with the reference standard.
RESULTS AND DISCUSSION
Polycyclic Aromatic Hydrocarbon (PAH) in Surface Water Samples
The results of the PAH levels in the surface water samples is shown in Table 1. Naphthalene levels ranged between 0.015 – 0.366 ppm; Acenaphthene levels ranged between 0.032 – 0.200 ppm; Acenaphthylene levels ranged between 0.002 – 0.012 ppm; Fluorene levels ranged between 0.011 – 0.020 ppm; Phenanthrene levels ranged between 0.014 – 0.052 ppm; Anthracene levels fell between 0.014 – 0.081 ppm; Fluoranthene levels fell between 0.014 – 0.064 ppm; Pyrene levels fell between 0.023 – 0.252 ppm; Benz(a)anthracene levels fell between 0.007 – 0.025 ppm; Chrysene levels fell between 0.032 – 0.124 ppm; Benzo(b)fluoranthene levels fell between 0.013 – 0.073 ppm; Benzo(k)fluoranthene levels fell between 0.029 – 0.046 ppm; Benzo(a)pyrene levels fell between 0.032 – 0.050 ppm; Indeno(1,2,3-c,d) )pyrene levels fell between 0.035 – 0.074 ppm; Dibenz(a,h)anthracene levels fell between 0.025 – 0.047 ppm while Benzo{g,h,i)perylene levels fell between 0.012 – 0.069 ppm. Total PAH levels ranged between 0.726 and 1.215 ppm across all sampling stations.
The Total Polycyclic Aromatic Hydrocarbon (PAH) levels were above the WHO (2011) limit of 0.0002 mg/L. The PAH levels obtained in this study may pose serious environmental and health risks due to bioaccumulation of these PAH compounds. The health effects of PAH compounds are not stereotyped as individual PAH compounds have different health effects (Rengarajan et al., 2015).
Table 1: Mean Levels of Polycyclic Aromatic Hydrocarbons (PAHs) in Surface Water Samples
| PAHs (ppm) | Stn 1 | Stn 2 | Stn 3 | Stn 4 | Stn 5 | USEPA Limits |
| Naphthalene | 0.015±0.0 | 0.053±0.1 | 0.366±0.3 | 0.264±0.1 | 0.202±0.2 | 4.0×10⁻² c |
| Acenaphthylene | 0.150±0.2 | 0.187±0.2 | 0.200±0.2 | 0.032±0.0 | 0.175±0.0 | 2.0×10⁻¹ b |
| Acenaphthene | 0.002±0.0 | 0.004±0.1 | 0.012±0.1 | 0.009±0.2 | 0.007±0.0 | 2.0×10⁻¹ b |
| Florene | 0.011±0.0 | 0.014±0.2 | 0.016±0.0 | 0.016±0.1 | 0.020±0.0 | 2.0×10⁻¹ b |
| Phenanthrene | 0.014±0.0 | 0.033±0.0 | 0.035±0.0 | 0.032±0.2 | 0.052±0.0 | 2.0×10⁻¹ b |
| Anthracene | 0.021±0.0 | 0.033±0.0 | 0.035±0.0 | 0.014±0.1 | 0.081±0.1 | 2.0×10⁻¹ b |
| Fluoranthene | 0.014±0.0 | 0.020±0.0 | 0.024±0.1 | 0.017±0.0 | 0.064±0.1 | 2.0×10⁻¹ b |
| Pyrene | 0.214±0.2 | 0.023±0.0 | 0.252±0.2 | 0.036±0.0 | 0.054±0.1 | 2.0×10⁻¹ b |
| Benz (a) Anthracene | 0.016±0.0 | 0.023±0.0 | 0.025±0.1 | 0.007±0.3 | 0.015±0.2 | 1.0×10⁻⁴ a |
| Chrysene | 0.124±0.1 | 0.044±0.0 | 0.036±0.2 | 0.032±0.0 | 0.063±0.1 | 2.0×10⁻⁴ a |
| Benzo (b) Fluoranthene | 0.061±0.1 | 0.073±0.1 | 0.065±0.1 | 0.013±0.1 | 0.056±0.1 | 2.0×10⁻⁴ a |
| Benzo (k) Fluoranthene | 0.037±0.2 | 0.044±0.2 | 0.034±0.2 | 0.029±0.0 | 0.046±0.0 | 2.0×10⁻⁴ a |
| Benzo (a) Pyrene | 0.032±0.0 | 0.042±0.0 | 0.032±0.1 | 0.050±0.0 | 0.048±0.2 | 2.0×10⁻⁴ a |
| Indeno (1, 2, 3,-c,d) Pyrene | 0.051±0.0 | 0.059±0.0 | 0.035±0.0 | 0.050±0.0 | 0.074±0.1 | 4.0×10⁻⁴ a |
| Dibenz (a, h) anthracene | 0.038±0.2 | 0.047±0.2 | 0.036±0.1 | 0.025±0.0 | 0.037±0.0 | 3.0×10⁻⁴ a |
| Benzo (g, h, i) pyrylene | 0.025±0.1 | 0.042±0.1 | 0.012±0.0 | 0.050±0.1 | 0.069±0.1 | 4.0×10⁻² c |
USEPA Limits: a = 2013; b = 2014; c = 1996
Polycyclic Aromatic Hydrocarbon (PAH) in Fish Samples
The results of PAH levels in the fish samples is shown in Table 2. Naphthalene levels ranged between 0.015 – 0.366 ppm; Acenaphthene levels ranged between 0.032 – 0.200 ppm; Acenaphthylene levels ranged between 0.002 – 0.012 ppm; Fluorene levels ranged between 0.011 – 0.020 ppm; Phenanthrene levels ranged between 0.014 – 0.052 ppm; Anthracene levels fell between 0.014 – 0.081 ppm; Fluoranthene levels fell between 0.014 – 0.064 ppm; Pyrene levels fell between 0.023 – 0.252 ppm; Benz(a)anthracene levels fell between 0.007 – 0.025 ppm; Chrysene levels fell between 0.032 – 0.124 ppm; Benzo(b)fluoranthene levels fell between 0.013 – 0.073 ppm; Benzo(k)fluoranthene levels fell between 0.029 – 0.046 ppm; Benzo(a)pyrene levels fell between 0.032 – 0.050 ppm; Indeno(1,2,3-c,d) )pyrene levels fell between 0.035 – 0.074 ppm; Dibenz(a,h)anthracene levels fell between 0.025 – 0.047 ppm while Benzo{g,h,i)perylene levels fell between 0.012 – 0.069 ppm. Total PAH levels ranged between 0.726 and 1.215 ppm across all sampling stations.
Table 2: Mean Levels of Polycyclic Aromatic Hydrocarbons in Fish
| Parameters | Sample S | Sample A | FMENV Limits |
| Naphthalene | 0.00016 | 0.00022 | NS |
| Acenaphthylene | 0.00004 | 0.00018 | NS |
| Acenaphthene | 0.00012 | 0.00003 | NS |
| Fluorene | 0.00002 | 0.00004 | NS |
| Phenanthrene | <0.0001 | 0.00008 | NS |
| Anthracene | <0.00001 | <0.00001 | NS |
| Fluoranthene | <0.00001 | 0.00013 | NS |
| Pyrene | 0.00007 | 0.00019 | NS |
| Benzo(a)anthracene | <0.00001 | <0.00001 | NS |
| Chrysene | <0.00001 | 0.00466 | NS |
| Benzo(b)fluoranthene | <0.00001 | <0.00001 | NS |
| Benzo(k)Fluoranthene | <0.00001 | <0.00001 | NS |
| Benzo(a)Pyrene | <0.00001 | <0.00001 | NS |
| Indenol(1,2,3-c,d)pyrene | <0.00001 | <0.00001 | NS |
| Dibenzo(a,h)anthracene | <0.00001 | <0.00001 | NS |
| Benzo(g,h,i)perylene | <0.00001 | 0.00019 | NS |
| Total PAH | 0.00042 | 0.00573 | NS |
The total PAH concentration in both samples falls within a very low range, with Sample S showing much lower levels than Sample A. Sample A, at 0.00573 ppm, presents a nearly 14-fold higher concentration of total PAHs compared to Sample S, which had 0.00042 ppm. The Federal Ministry of Environment (FMEnv) of Nigeria has not set specific limits for PAHs in fish. However, according to global environmental protection agencies such as the World Health Organization (WHO) and the United States Environmental Protection Agency (USEPA), there is a growing concern about the presence of even trace amounts of PAHs in food due to their carcinogenic properties (Jiang et al., 2021). A study conducted by Asif et al. (2022) reported total PAH levels ranging from 0.01 to 0.05 ppm in fish samples from industrial regions, which is significantly higher than what was observed in Sample S (0.00042 ppm) and somewhat comparable to the levels found in Sample A (0.00573 ppm). Similarly, Ajibola et al. (2019) reported PAH levels ranging from 0.003 to 0.015 ppm in smoked fish from local markets, with the highest concentrations found in heavily polluted areas. The lower levels of PAHs detected in this study may be attributed to less exposure to environmental pollution or differences in fish species and their lipid content, which influences PAH accumulation (Nisbet & LaGoy, 2018). However, the elevated levels in Sample A could indicate localized pollution sources, such as oil spills, industrial discharges, or urban runoff, which are commonly associated with increased PAH concentrations in aquatic environments (Li et al., 2020).
In general, Analysis of Variance of the results reveal that there was significant difference (p < 0.05) between the means of all the PAH components analysed.
At 0.01 significance level, the strong positive correlations between the PAH components observed on the Pearson’s correlation matrix were between Naphthalene and Acenaphthene (r = 0.966), Acenaphthene and Benzo(a)Anthracene (r = 0.858), Acenaphthylene and Benzo(j)Fluoranthene (r = 0.944), Fluorene and Phenanthrene (r = 0.850), Fluorene and Anthracene (r = 0.820), Fluorene and Fluoranthene (r = 0.813), Phenanthrene and Anthracene (r = 0.802), Phenanthrene and Fluoranthene (r = 0.832), Phenanthrene and Benzo(g,h,i)Pyrelene (r = 0.656), Anthracene and Fluoranthene (r = 0.974), Benzo(a)anthracene and Benzo(b)Fluoranthene (r = 0.841), Benzo(b)Fluoranthene and Dibenz(a,h)anthracene (r = 0.794), Benzo(k)Fluoranthene and Indeno (1,2,3,-c,d)Pyrene (r = 0.769), Benzo(a)Pyrene and Benzo(g,h,i)Pyrene (r = 0.923) and Indeno (1,2,3,-c,d)Pyrene and Benzo(g,h,i)Pyrene (r = 0.860); while strong negative correlations existed between Pyrene and Benzo(a)Pyrene (r = -0.907) and between Pyrene and Benzo(g,h,i)Pyrene (r = -0.838).
At 0.05 significance level, the strong positive correlations between the PAH components observed on the Pearson’s correlation matrix were between Anthracene and Benzo(k)Fluoranthene (r = 0.718), Anthracene and Indeno(1,2,3,-c,d)Pyrene (r = 0.641), Fluoranthene and Indeno(1,2,3,-c,d)Pyrene (r = 0.698), Fluoranthene and Benzo(g,h,i)Pyrelene (r = 0.680), Benzo(a)Pyrene and Indeno(1,2,3,-c,d)Pyrene (r = 0.664), while strong negative correlations existed between Naphthalene and Chrysene (r = -0.691), Naphthalene and Dibenz(a,h)Anthracene (r = -0.637), Pyrene and Indeno(1,2,3,-c,d)Pyrene (r = -0.706), Benzo(a)anthracene and Benzo(a)Pyrene (r = -0.687), Benzo(a)anthracene and Benzo(g,h,i)Pyrelene (r = -0.649) and between Benzo(b)Fluoranthene and Benzo(k)Fluoranthene (r = -0.641).
CONCLUSION
The total Polycyclic Aromatic Hydrocarbons levels in both surface water and fish were above acceptable limits. There was significant difference in the levels of PAHs between the stations as well as the fish types. Thus, adequate treatment of the surface water in the study areas is recommended as this could reduce the PAHs levels in aquatic lives.
REFERENCES
- Ajibola, O., Rowan, A. D., Ogedengbe, C. O., Mshelia, M. B., Cabral, D. J., Eze, A. A., … & Belenky, P. (2019). Urogenital schistosomiasis is associated with signatures of microbiome dysbiosis in Nigerian adolescents. Scientific reports, 9(1), 829.
- APHA AWWA, WEF (2005). Standard Methods for the Examination of Water and Waste Water 21st ed. American Public Health Association, Washington, D.C.; 2005
- Arvidsson, H.G.S., & Arvidsson, R. (2019). The Uppsala Model of internationalisation and beyond. International Journal of Finance and Administration. 42(2), 221-239.
- Asif, Z., Chen, Z., an, C., & Dong, J. (2022). Environmental impacts and challenges associated with oil spills on shorelines. Journal of Marine Science and Engineering, 10(6), 762.
- Baharom, Z.S., and Ishak, M.Y. (2015). Determination of heavy metal accumulation in fish species in Galas River, Kelantan and Beranang mining pool, Selangor. Procedia Environmental Sciences, 30, 320-325
- Cordes et al., (2016). Environmental Impacts of the Deep-Water Oil and Gas Industry: A Review to Guide Management Strategies.
- Encyclopaedia Britannica (2014). Ultimate Edition: 3 Encyclopedias in One Resource: Adult, Student and Children’s; PC/MAC DVD-ROM. Encyclopaedia Britannica. Ultimate edition
- European Commission. EC regulation 2015/1933 amending EC regulation 1881/2006 regarding maximum levels of PAHs in foodstuffs, Torino Italy. 2015.
- Fakhru’L-Razi, A.; Pendashteh, A.; Abdullah, L.C.; Biak, D.R.A.; Madaeni, S.S.; and Abidin, Z.Z. (2009). Review of technologies for oil and gas produced water treatment. Journal of Hazard. Mater., 170, 530–551.
- Hayes, T. & Arthur, D. (2004). Overview of emerging produced water treatment technologies. Free Radical and Biological Medicine, 8(4), 3101 – 3109.
- IEA (2016) (International Energy Agency). Water-energy nexus: World Energy Outlook-Special Report. https:// iea.org/reports/water-energy-nexus
- Jiang, Z., Xu, C., Liu, Q., Liang, J., Weng, Z., Xu, J., & Gu, A. (2021). Urinary biomarkers of polycyclic aromatic hydrocarbons and their associations with liver function in adolescents. Environmental Pollution, 278, 116842.
- Li, A. (2020). Spitzer’s perspective of polycyclic aromatic hydrocarbons in galaxies. Nature Astronomy, 4(4), 339-351.
- National Oil Spill Detection and Remediation Agency (NOSDRA), (2019). Escravos: Nigerian Federal Government Agencies. Available at: https://ejatlas.org/conflict/chevron-and-shell-ravage-escravos-nigeria
- Neal, C., Price, S. J., Ford, J. R., & Cooper, A. (2011). Humans as major geological and geomorphological agents in the Anthropocene: the significance of artificial ground in Great Britain. Philosophical Transactions of the Royal Society A: Mathematical, Physical and Engineering Sciences, 369(1938), 1056-1084.
- Nisbet, T., Lagan, T., Loiselle, D., & Han, J. C. (2018). Pulmonary arterial hypertension reduces energy efficiency of right, but not left, rat ventricular trabeculae. The Journal of physiology, 596(7), 1153-1166.
- Ogolo, N. A., Anih, O. C. and Onyekonwu, M. O. (2022). Institute of Petroleum Studies, Faculty of Engineering, University of Port Harcourt, Rivers State, Nigeria 2 Department of Chemical Engineering, Faculty of Engineering, University of Port Harcourt, Rivers State, Nigeria.
- Park, K., Oh, S. M., & Chung, K. H. (2004). Combination of in vitro bioassays encompassing different mechanisms to determine the endocrine-disrupting effects of river water. Science of the Total Environment, 354(2-3), 252-264.
- Poonam B, Rahul K (2012). Status of seawater quality at few industrially important coasts of Gujarat (India) off Arabian Sea. Indian Journal of Geo-Marine Sciences 41(1): 90-97
- Rengarajan, T., Rajendran, P., Nandakumar, N., Lokeshkumar, B., Rajendran, P. and Nishigaki, I. (2015). Exposure to Polycyclic Aromatic Hydrocarbons with Special Focus on Cancer. Asian Pacific Journal of Tropical Biomedical, 5, 182–189.
- Reynolds, R. R. (2003). Produced Water and Associated Issues: A Manual for the Independent Operator, vol. 6 Oklahoma Geological Survey Open-file Report (pg.1-56).
- Scott, A. and Pickard, S. (2020). FAQ 3: oil and gas, poverty, the environment and human rights. Available at: https:// odi.org/en/about/our-work/climate-and-sustainability/faq-3-oil-and-gas-poverty-the-environment-…
- Tibbetts, P. J. C., Buchanan, I. T., Gawel, L. J., & Large, R. (1992). A comprehensive determination of produced water composition. In Produced water: Technological/environmental issues and solutions(pp. 97-112). Boston, MA: Springer US.